Edtech Traction Slides: 6 Real Pitch Deck Examples
How education startups show traction: learners, paying students and revenue side by side, organic sign-ups with zero ad spend, three big numbers.
Edtech Traction Slides: Real Pitch Deck Examples
Six traction slides from education decks (a global learning group, a coding app, a learning platform for companies in Latin America, tutoring sold to school districts, a cooking-based curriculum for schools, and an e-learning research centre), shown in full. Education products often have many free learners and far fewer payers, so investors look for the gap between users and paying customers, who the buyer is (parent, school, district or company) and how fast revenue grows. The stronger slides separate users from payers and give revenue; the weaker one mixes figures that do not match.
TL;DR
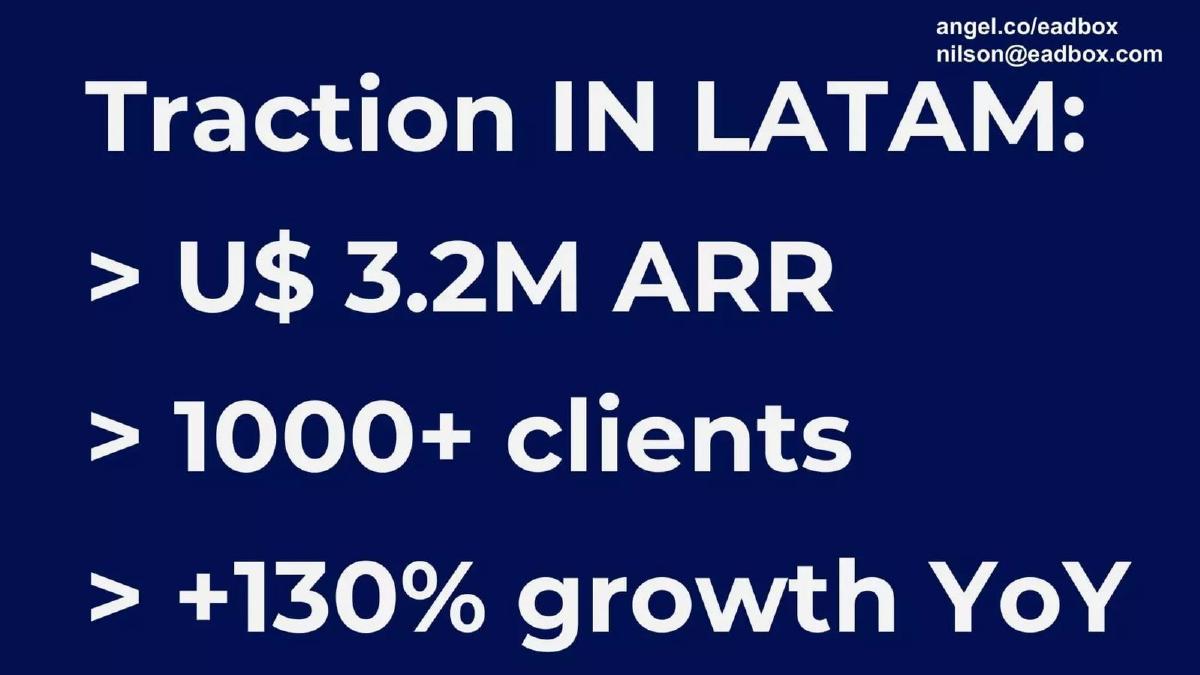
An edtech traction slide should separate learners from payers and show revenue and growth. Genius Group gives students, paying students, partners, revenue and gross margin as five separate figures. Sololearn shows 21 million profiles and 300,000 to 350,000 new sign-ups a month with no marketing spend. Eadbox states $3.2M ARR, 1,000+ clients and 130% yearly growth. Paper shows district revenue growing each year with the amounts blacked out. Chef Koochooloo lists every school customer, downloads and $100k revenue. CeIR lists paying clients, users and revenue that do not line up, the weaker example here.
Edtech traction slides
Each example shows the exact stored slide above its analysis and links to the full teardown. Stronger examples first. Claims and figures are as shown on the slides; we have not verified them.
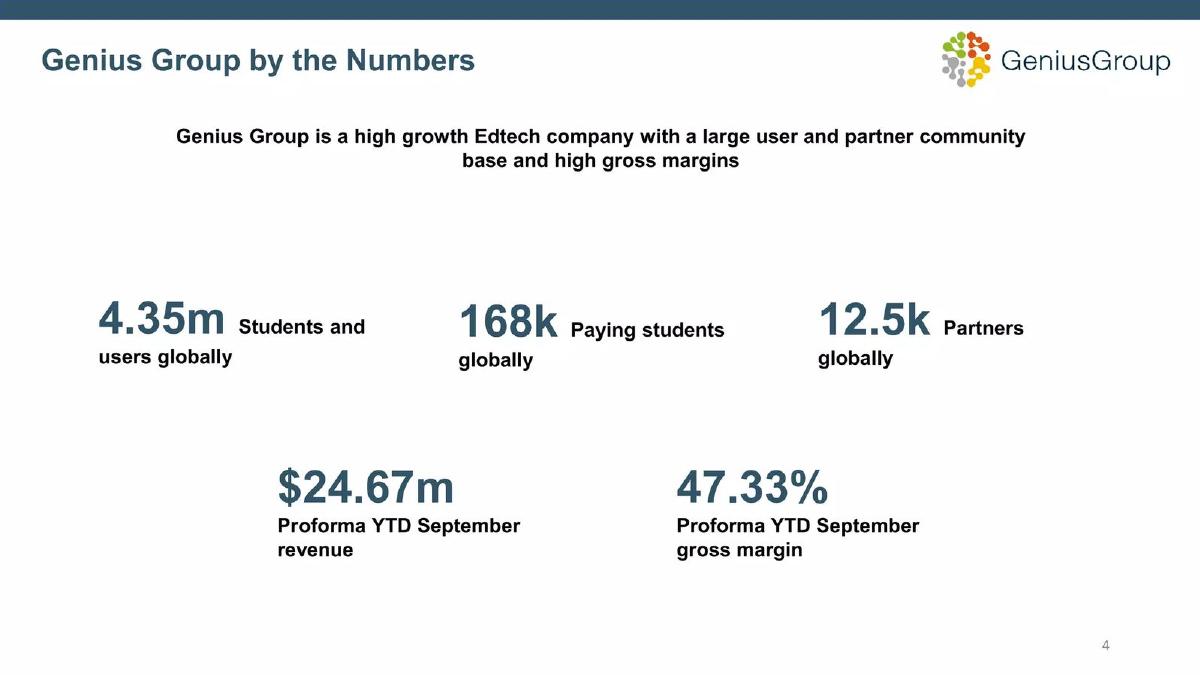
Genius Group traction slide — slide 4
Growth stage (recorded). Online education for entrepreneurs. Five figures in two rows.
Genius Group deck, slide 4. Exact stored slide matched to this analysis.
Our analysis: The clearest example here: an investor can see at once that about 4% of users pay, and what revenue and margin that produces.
Evidence and limitation: Users, paying students, partners, revenue and margin, with the period stated; revenue is pro forma (adjusted), not reported.
What a founder can adapt: Show total learners, paying learners and revenue for the same period, and say if a figure is adjusted.
Supporting analysis
What the deck claims: "Genius Group by the Numbers." "Genius Group is a high growth Edtech company with a large user and partner community base and high gross margins." "4.35m Students and users globally." "168k Paying students globally." "12.5k Partners globally." "$24.67m Proforma YTD September revenue." "47.33% Proforma YTD September gross margin."
Presentation choice: Putting total users and paying students side by side answers the first question about any education business.
When it does not fit: Pro forma figures without a note on what was adjusted; add a footnote.
Series B (recorded). App for learning to code. Organic growth in three tiles and two awards.
Sololearn deck, slide 4. Exact stored slide matched to this analysis.
Our analysis: Makes one point well: people find the app without paid ads, so growth has cost little.
Evidence and limitation: Total profiles, monthly new sign-ups, a search ranking and two awards; no paying users or revenue.
What a founder can adapt: If growth is organic, say so and pair it with a monthly sign-up figure.
Supporting analysis
What the deck claims: "Only organic growth." "Zero spend on marketing." "21M Profiles." "#1 Organic search result on App Store and Google Play." "300K-350K New organic registrations every month." "FbStart Global app of the year." "Editors' choice."
Presentation choice: "Zero spend on marketing" next to monthly sign-ups tells an investor acquisition is cheap.
When it does not fit: Profiles are not active learners; add monthly active users and how many pay.
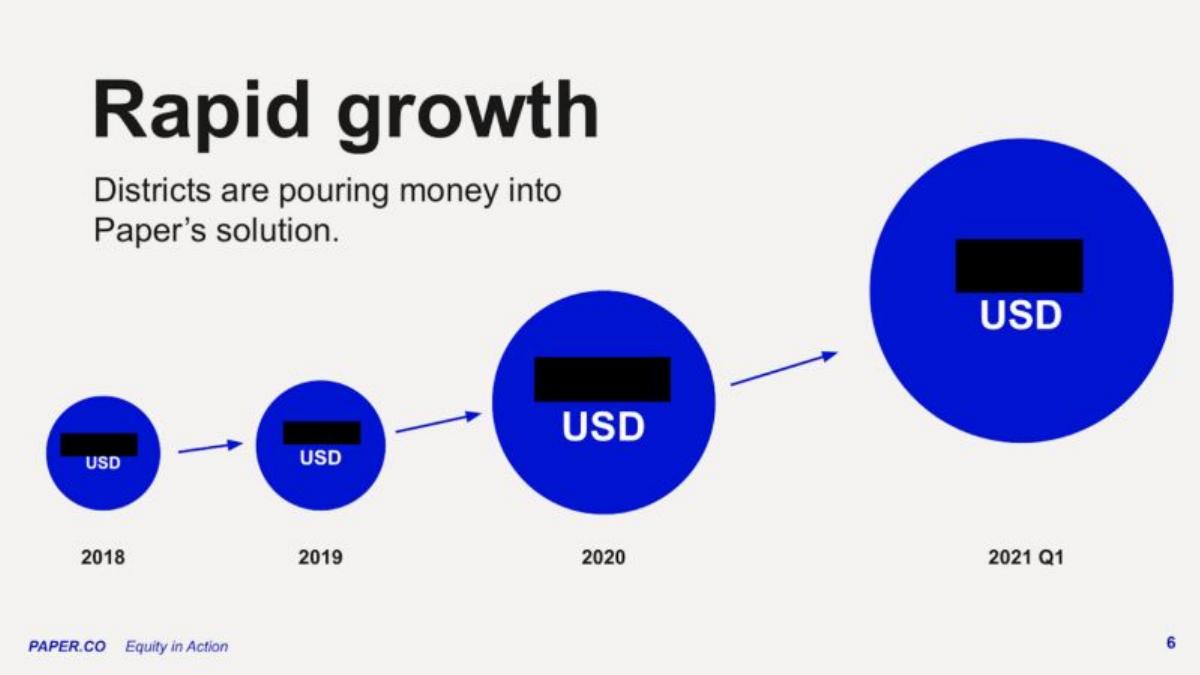
Series C (recorded). Online tutoring sold to school districts. Growing circles with amounts blacked out.
Paper deck, slide 6. Exact stored slide matched to this analysis.
Our analysis: The circles show fast growth and the headline names the buyer, even without the numbers.
Evidence and limitation: Relative size of yearly revenue and the buyer (districts); the actual amounts are redacted in the shared copy.
What a founder can adapt: Show revenue by year and name the buyer in the headline.
Supporting analysis
What the deck claims: "Rapid growth." "Districts are pouring money into Paper's solution." Four circles labelled 2018, 2019, 2020 and 2021 Q1, each marked "USD", with the amounts covered by black bars.
Presentation choice: Growing circle sizes show the trend at a glance, and "districts" tells investors who signs the contract.
When it does not fit: In your own deck, share the numbers with investors; redaction here reflects the public copy.
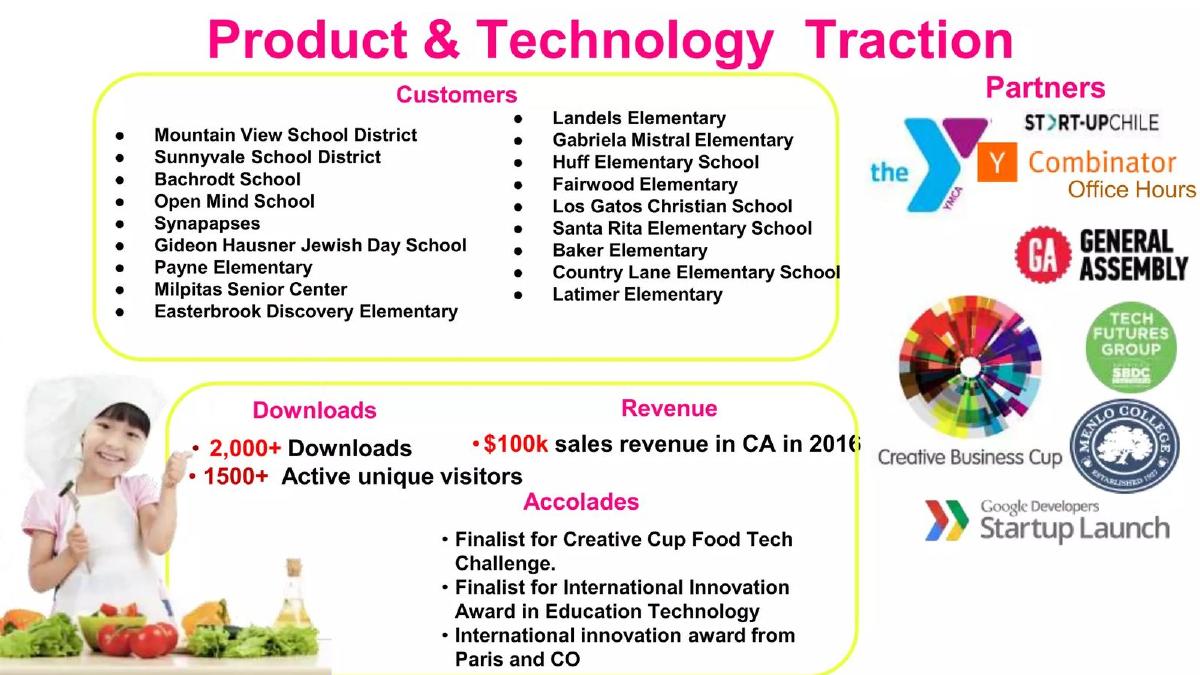
Stage not recorded. Cooking-based science and culture lessons for schools. Customers, partners, downloads and revenue.
Chef Koochooloo deck, slide 5. Exact stored slide matched to this analysis.
Our analysis: The named schools and districts are strong proof of buyers, but the slide crowds in too much, so the $100k revenue is easy to miss.
Evidence and limitation: Named school customers, downloads, revenue for one state and year, awards and partner logos.
What a founder can adapt: Keep the customer names, move awards and partner logos to another slide, and make revenue the largest number.
Supporting analysis
What the deck claims: "Product & Technology Traction." Customers include "Mountain View School District", "Sunnyvale School District", "Milpitas Senior Center" and about fifteen schools. "2,000+ Downloads." "1500+ Active unique visitors." "$100k sales revenue in CA in 2016." Accolades include "Finalist for International Innovation Award in Education Technology." Partner logos include Y Combinator Office Hours, Start-Up Chile and General Assembly.
Presentation choice: A list of real school customers shows the product is bought, not just tried.
When it does not fit: Mixing office hours programmes with paying customers; investors may read them as the same thing.
Seed (recorded). E-learning training, consultancy and research. Five bullets over a curve.
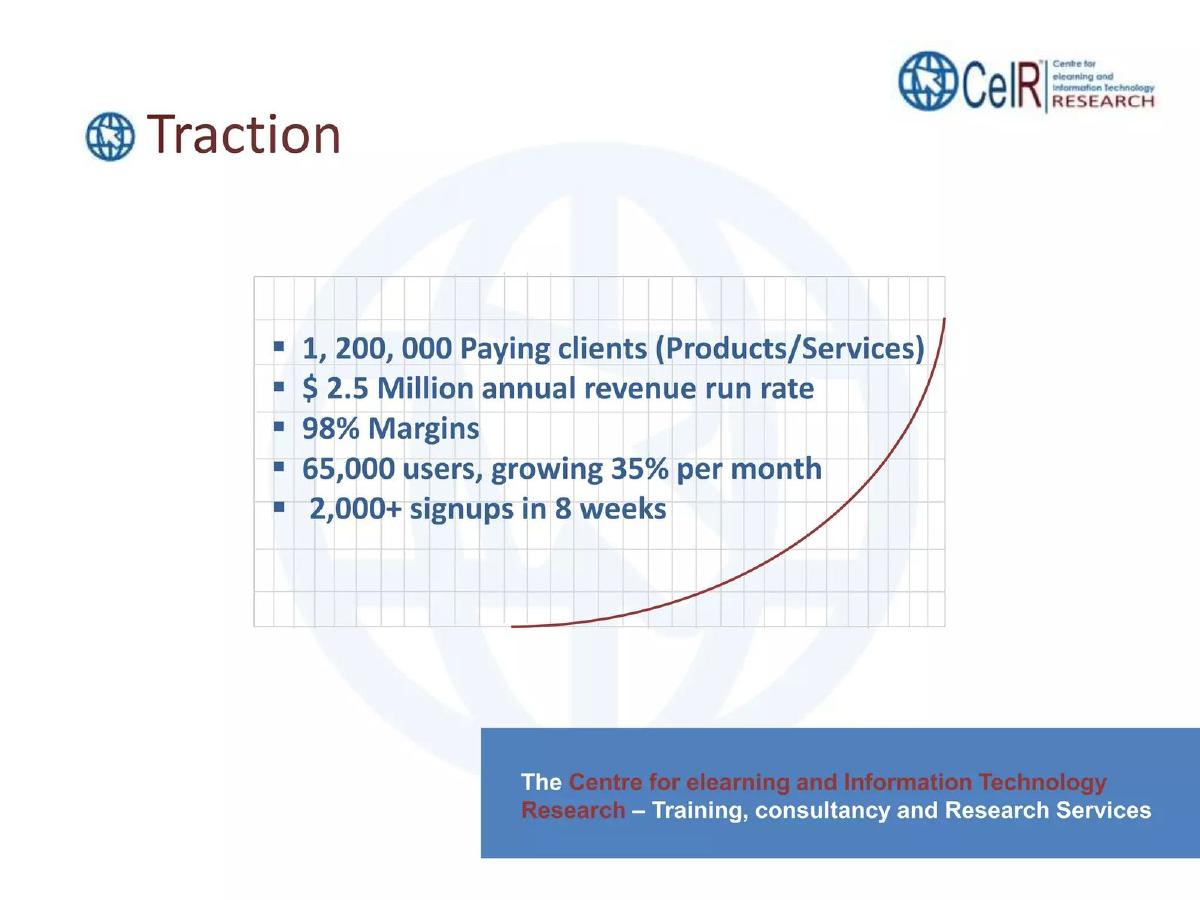
CeIR deck, slide 5. Exact stored slide matched to this analysis.
Our analysis: The weaker example: the numbers raise questions instead of answering them, and the curve behind them has no axes.
Evidence and limitation: Five figures; 1.2 million paying clients alongside 65,000 users and $2.5M revenue do not line up.
What a founder can adapt: Define each term (client, user, sign-up) and make sure the counts fit together.
Supporting analysis
What the deck claims: "Traction." "1,200,000 Paying clients (Products/Services)." "$2.5 Million annual revenue run rate." "98% Margins." "65,000 users, growing 35% per month." "2,000+ signups in 8 weeks."
Presentation choice: Included for contrast; figures that contradict each other cost credibility.
When it does not fit: A decorative growth curve with no axes or values.
Whether each slide separates users from payers, names the buyer, shows revenue and gives a growth rate.
Example
Product
Users vs payers
Buyer named
Revenue shown
Growth rate
Genius Group
Entrepreneur education
Yes
Students
Yes, pro forma
No
Sololearn
Coding app
Users only
No
No
Sign-ups per month
Eadbox
Corporate training
Clients only
Companies
ARR
Yearly
Paper
District tutoring
No
Districts
Redacted
By year
Chef Koochooloo
School curriculum
Downloads and schools
Named schools
$100k, one year
No
CeIR
E-learning services
Unclear
No
Run rate
Monthly, users
Key Takeaways
Show users and paying customers as separate numbers.
Name the buyer: parents, schools, districts or employers.
Give revenue or ARR and a growth rate with its period.
Check that every figure on the slide agrees with the others.
Build your edtech traction slide
Separate learners from payers, then show revenue and how fast it grows.
Learners. Total and monthly active learners, with the date.
Payers. How many pay, and who: parents, schools, districts or employers.
Revenue. ARR or yearly revenue, and growth over a stated period.
Consistency. Check that users, payers and revenue fit together.
Copyable framework: [n] learners, [n] active monthly, [n] paying [buyer type] as of [date]. [Revenue or ARR], up [rate] over [period].
Illustrative example 1 — written by us
Before: 1,200,000 Paying clients (Products/Services). $2.5 Million annual revenue run rate. 65,000 users, growing 35% per month.
After: [n] paying organisations and [n] individual learners as of [date]. $2.5M annual revenue run rate. Active users: 65,000, up 35% a month over [period].
What improved: Our illustrative rewrite; not CeIR's wording. Bracketed parts are placeholders to fill with real facts. It splits payers by type, dates the figures and removes the conflict between clients and users.
What this guide adds
The library has a general traction guide and sector traction guides for SaaS, fintech, AI, marketplaces and healthcare, plus edtech problem, solution, product and business model guides, but no edtech traction guide. This page looks at how education companies show usage, paying customers and revenue.
Sector labels come from the sector recorded for each published teardown (high confidence for all six). None of these six slides appears in another guide. One other slide from the Paper deck is used elsewhere in the library for a different lesson.
Four ways edtech decks show traction
Users versus payers (Genius Group, Sololearn): a large learner count next to paying students or new sign-ups.
Headline revenue (Eadbox, Paper): ARR or yearly revenue, shown as big numbers or growing circles.
Named school customers (Chef Koochooloo): the list of schools and districts that bought it.
Bullet figures (CeIR): several numbers in a list, weaker when they do not agree.
Common mistakes
Users presented as customers. Free learners and paying customers need separate numbers.
No buyer named. Say whether parents, schools, districts or companies pay.
Growth with no period. Give the months or years a growth rate covers.
Figures that conflict. Check that every number on the slide agrees with the others.
Diagnostic checklist
Learners and payers shown separately.
The buyer named.
Revenue or ARR with a date.
A growth rate with its period.
Frequently asked questions
How we chose these examples
Corpus: published pitch deck teardowns on StartupFundraising.com. Founder-uploaded private decks are excluded.
Selection (2026-09-27): we took teardowns whose recorded sector is edtech, with a stored slide image and a slide title about traction, growth, momentum, numbers or results. We read the candidates, left out market-growth slides, slides already used in other guides (Careerdean, Empowerly, Pathrise), and a slide from an IT services company filed under this sector (Quambase), and kept six that show different ways of presenting edtech traction. CeIR is included as a weaker example for contrast. We found six suitable slides rather than forcing a seventh.
Sector is the category recorded for each teardown (high confidence for all six). Stages as recorded: Genius Group and Eadbox, growth; Sololearn, Series B; Paper, Series C; CeIR, seed; Chef Koochooloo, not recorded.
Review: stored slide images were checked on 2026-09-27 and matched to company, deck and slide number, and quoted text was read from the images (editorial model review). No person has yet completed an editorial review of this page.
Claims and figures are as shown on the slides; we have not verified them. We make no claim that any slide caused a fundraising outcome.