Healthcare Traction Slides: 7 Real Pitch Deck Examples
How health startups show traction: revenue growth plus biobank and pharma adoption, patients and clinicians in one table, ARR beside university logos.
Healthcare Traction Slides: Real Pitch Deck Examples
Seven traction slides from health company decks (genetics research software, a patient education platform, student mental health, personalized vitamins, an online doctor and lab-test service, a clinic network in Kenya, and a medical device network), shown in full. Health sales are slow and involve several buyers, so investors look for proof that patients use it, that clinicians or institutions adopted it, and that someone pays. The stronger slides name who adopted it and give a number for each group; the weaker one lists dated steps with no users or revenue.
TL;DR
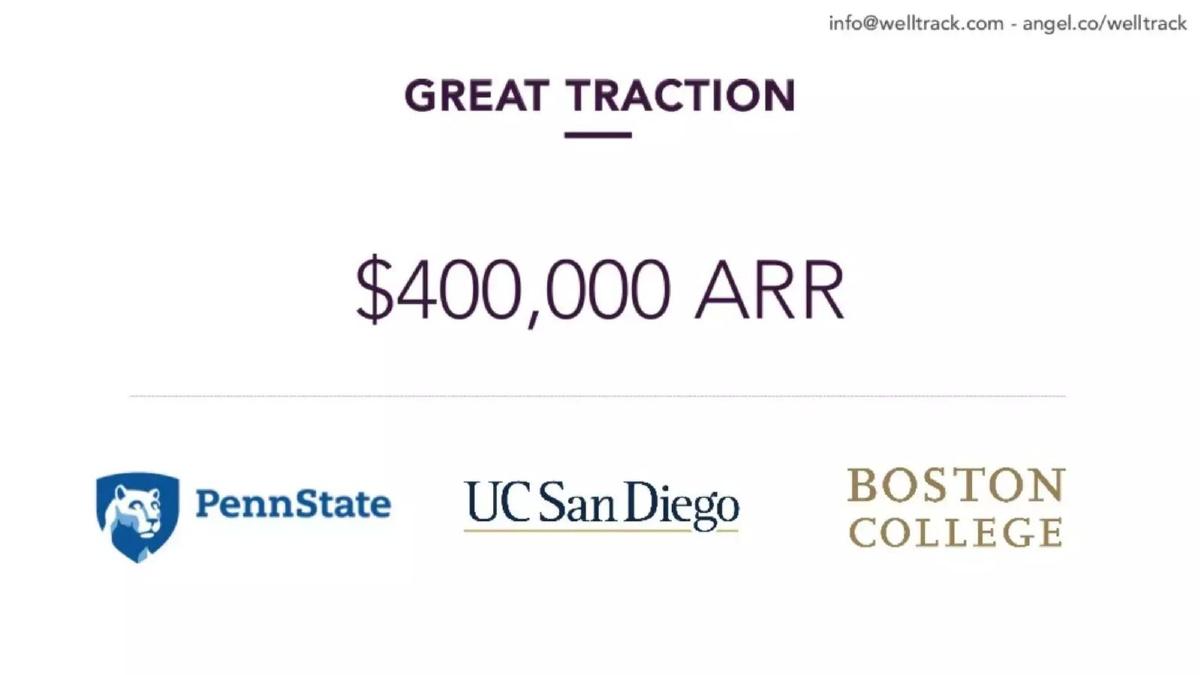
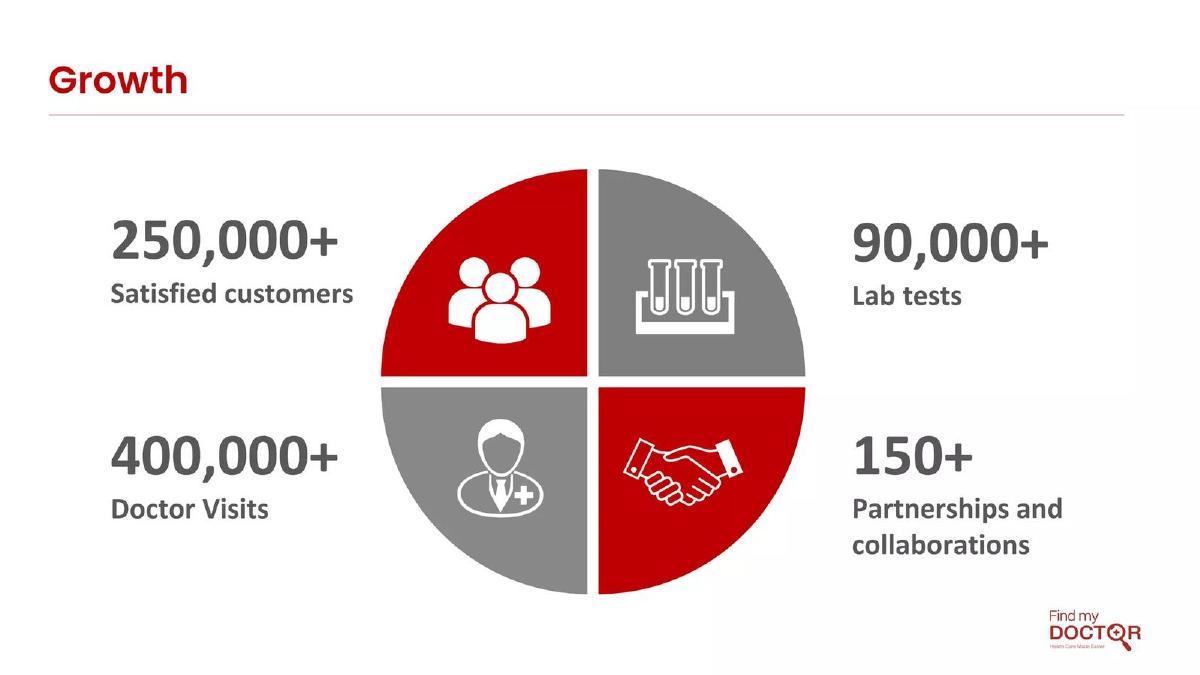
A healthcare traction slide should show who uses it, who pays and how fast that is growing. Sano Genetics pairs revenue doubling every six months with the biobanks and pharma companies using its software. Docola splits 55,000 patients, 1,146 clinicians and 273 content providers into one table. Well Track puts $400,000 ARR above three university customers. Rootine shows a four-year revenue chart beside five short points. Find My Doctor gives four service counts around one graphic. Penda Health lists 52 paying customers, a pending government deal and its first clinic opening. Poctor lists dated patents and certifications, the weaker example here.
Healthcare traction slides
Each example shows the exact stored slide above its analysis and links to the full teardown. Stronger examples first. Claims and figures are as shown on the slides; we have not verified them.
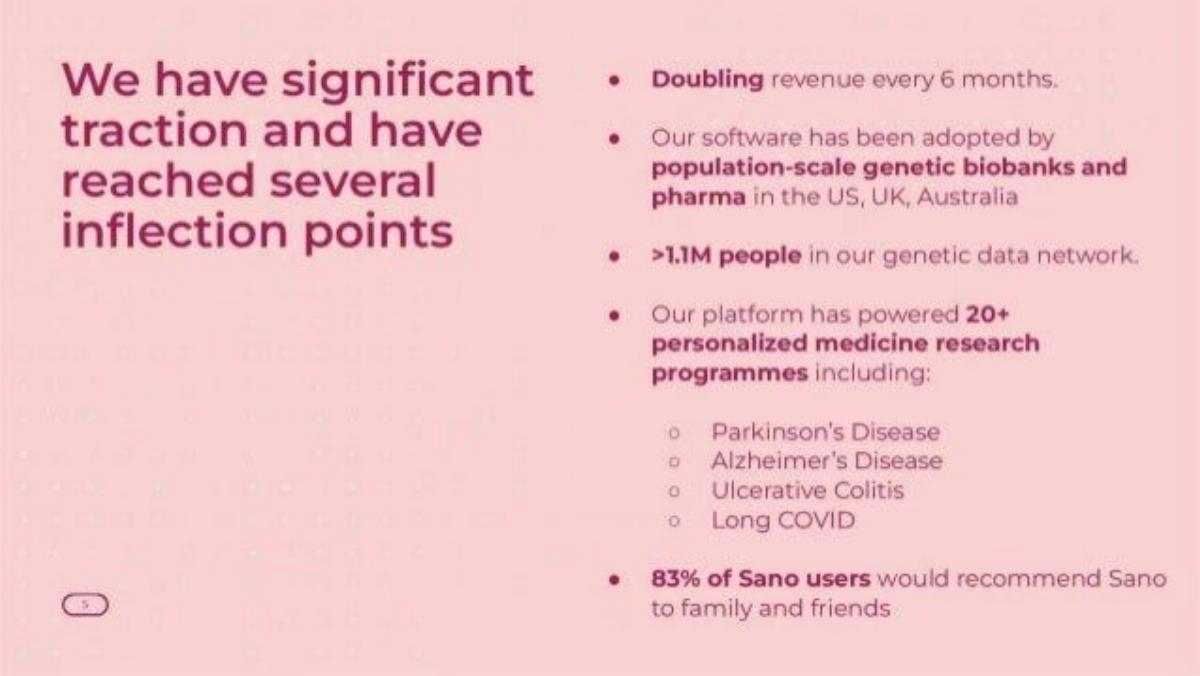
Sano Genetics traction slide — slide 5
Series A (recorded). Software for genetic research studies. Growth, adoption and reach on one slide.
Sano Genetics deck, slide 5. Exact stored slide matched to this analysis.
Our analysis: The clearest example here: it covers growth, who pays, how many people are reached and how users feel, each in one line.
Evidence and limitation: Revenue growth rate, buyer types and countries, network size, programme count and a recommendation score; no revenue amount or named customers.
What a founder can adapt: Put your growth rate first, then the type of buyer and where, then the size of your network.
Supporting analysis
What the deck claims: "We have significant traction and have reached several inflection points." "Doubling revenue every 6 months." "Our software has been adopted by population-scale genetic biobanks and pharma in the US, UK, Australia." ">1.1M people in our genetic data network." "Our platform has powered 20+ personalized medicine research programmes" (Parkinson's, Alzheimer's, ulcerative colitis, long COVID). "83% of Sano users would recommend Sano to family and friends."
Presentation choice: Linking revenue to biobanks and pharma tells an investor the buyers are large institutions, not just individuals.
When it does not fit: A growth rate with no starting amount; add the revenue figure or a range if you can share it.
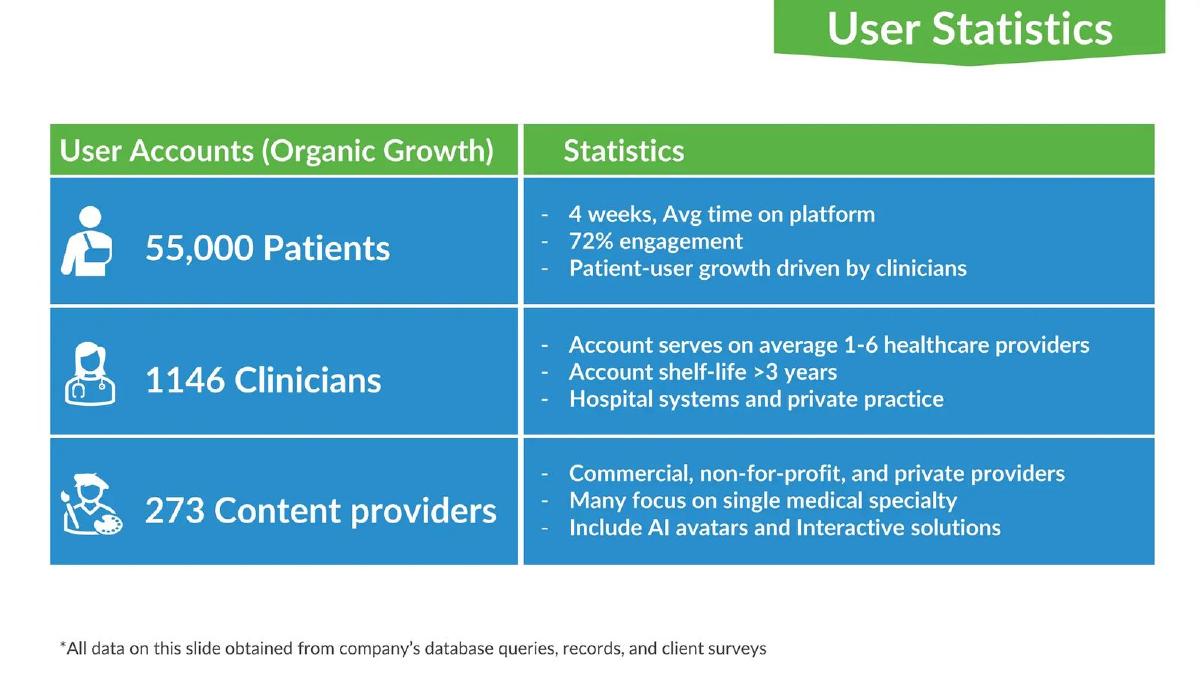
Stage not recorded. Patient education content shared by clinicians. A table of three user groups.
Docola deck, slide 6. Exact stored slide matched to this analysis.
Our analysis: Shows how a three-sided health platform grows: clinicians bring patients, and content providers supply material.
Evidence and limitation: Counts for all three sides, engagement and retention notes, and a stated data source; no revenue.
What a founder can adapt: One row per user group, with a count and two facts that show they stay and use it.
Supporting analysis
What the deck claims: "User Statistics." "User Accounts (Organic Growth)": "55,000 Patients", "1146 Clinicians", "273 Content providers." Beside each: "4 weeks, Avg time on platform", "72% engagement", "Patient-user growth driven by clinicians"; "Account serves on average 1-6 healthcare providers", "Account shelf-life >3 years"; "Commercial, non-for-profit, and private providers." Footnote: "All data on this slide obtained from company's database queries, records, and client surveys."
Presentation choice: The footnote says where the numbers come from, which investors often have to ask for.
When it does not fit: Leaving out revenue entirely; add who pays and how much, even at an early stage.
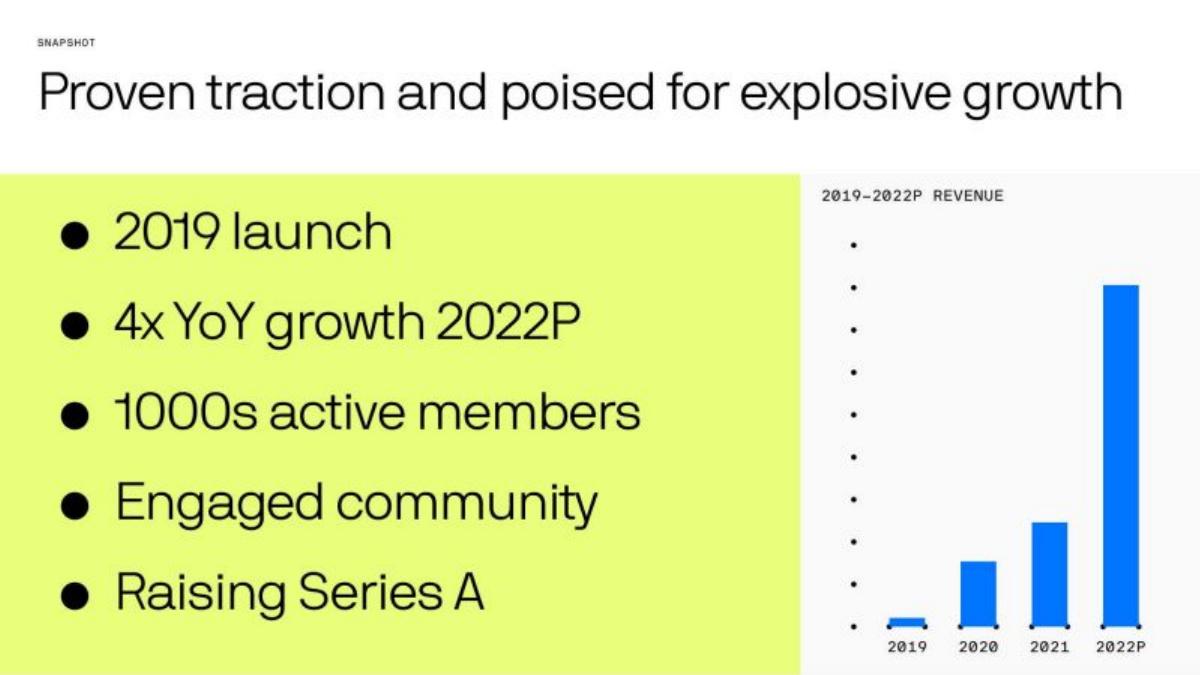
Series A (recorded). Personalized vitamins by subscription. Chart plus five points.
Rootine deck, slide 3. Exact stored slide matched to this analysis.
Our analysis: The rising bars make the trend clear at a glance, but the numbers behind them are missing.
Evidence and limitation: A revenue chart by year with no axis values, a projected growth rate and a vague member count.
What a founder can adapt: Keep the chart, add values to the bars and mark which year is projected.
Supporting analysis
What the deck claims: "Proven traction and poised for explosive growth." "2019 launch." "4x YoY growth 2022P." "1000s active members." "Engaged community." "Raising Series A." Chart: "2019-2022P Revenue", bars for 2019, 2020, 2021 and 2022P.
Presentation choice: A chart by year is the fastest way to show a growth curve.
When it does not fit: Vague counts like "1000s" and a projection (2022P) as the headline number; give the actual members and past growth.
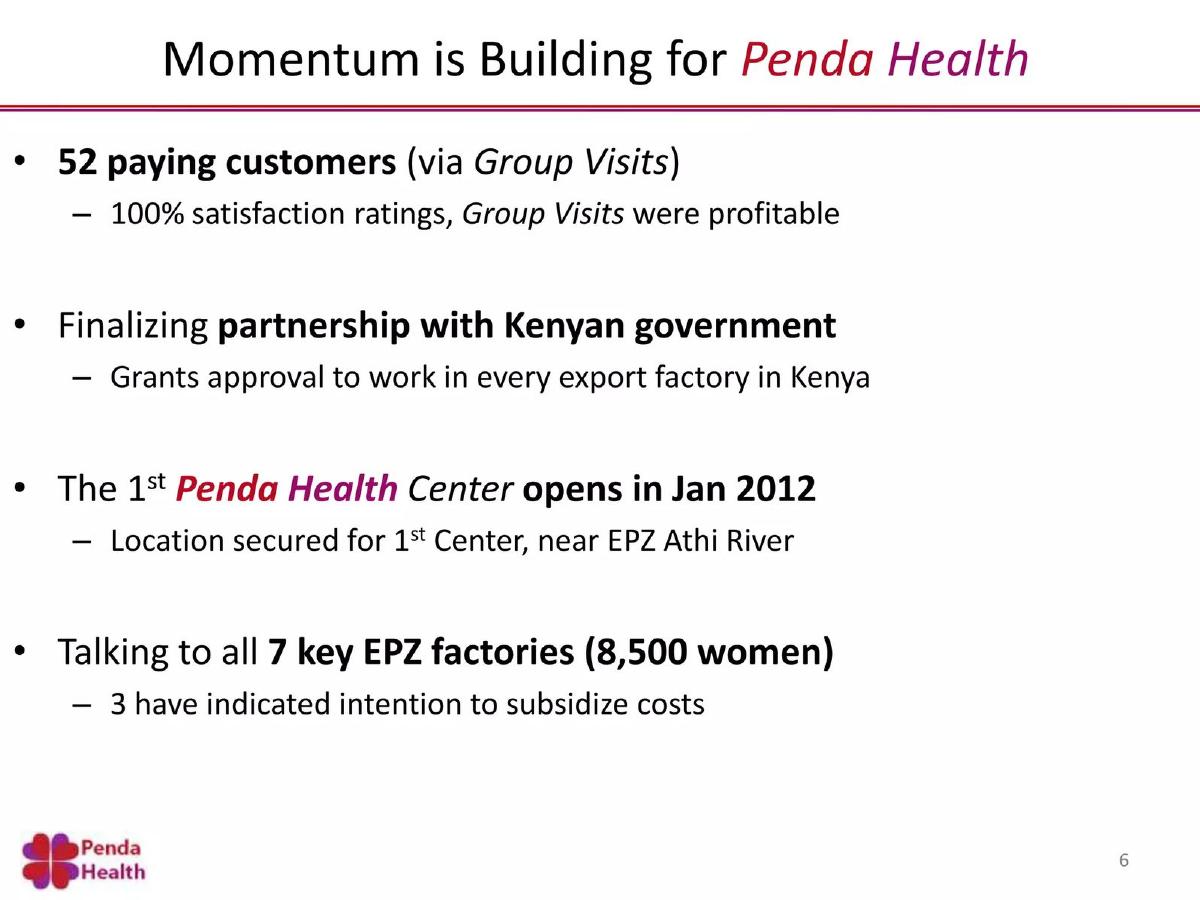
Seed (recorded). Outpatient clinics for women in Kenya. Pre-launch momentum in four bullets.
Penda Health deck, slide 6. Exact stored slide matched to this analysis.
Our analysis: Honest early traction: few customers, but paid and profitable, plus a clear route to many more through employers.
Evidence and limitation: A small paying-customer count, a profitability note, a pending government deal and a pipeline of factories with employee numbers.
What a founder can adapt: Before launch, show paying pilots, deals in progress and the size of the group each deal opens up.
Supporting analysis
What the deck claims: "Momentum is Building for Penda Health." "52 paying customers (via Group Visits)" with "100% satisfaction ratings, Group Visits were profitable." "Finalizing partnership with Kenyan government" that "grants approval to work in every export factory in Kenya." "The 1st Penda Health Center opens in Jan 2012." "Talking to all 7 key EPZ factories (8,500 women)", "3 have indicated intention to subsidize costs."
Presentation choice: Naming the factories and how many women they employ turns a pipeline into a reachable number of patients.
When it does not fit: "Finalizing" and "talking to" are not signed; label pending deals clearly, as this slide does.
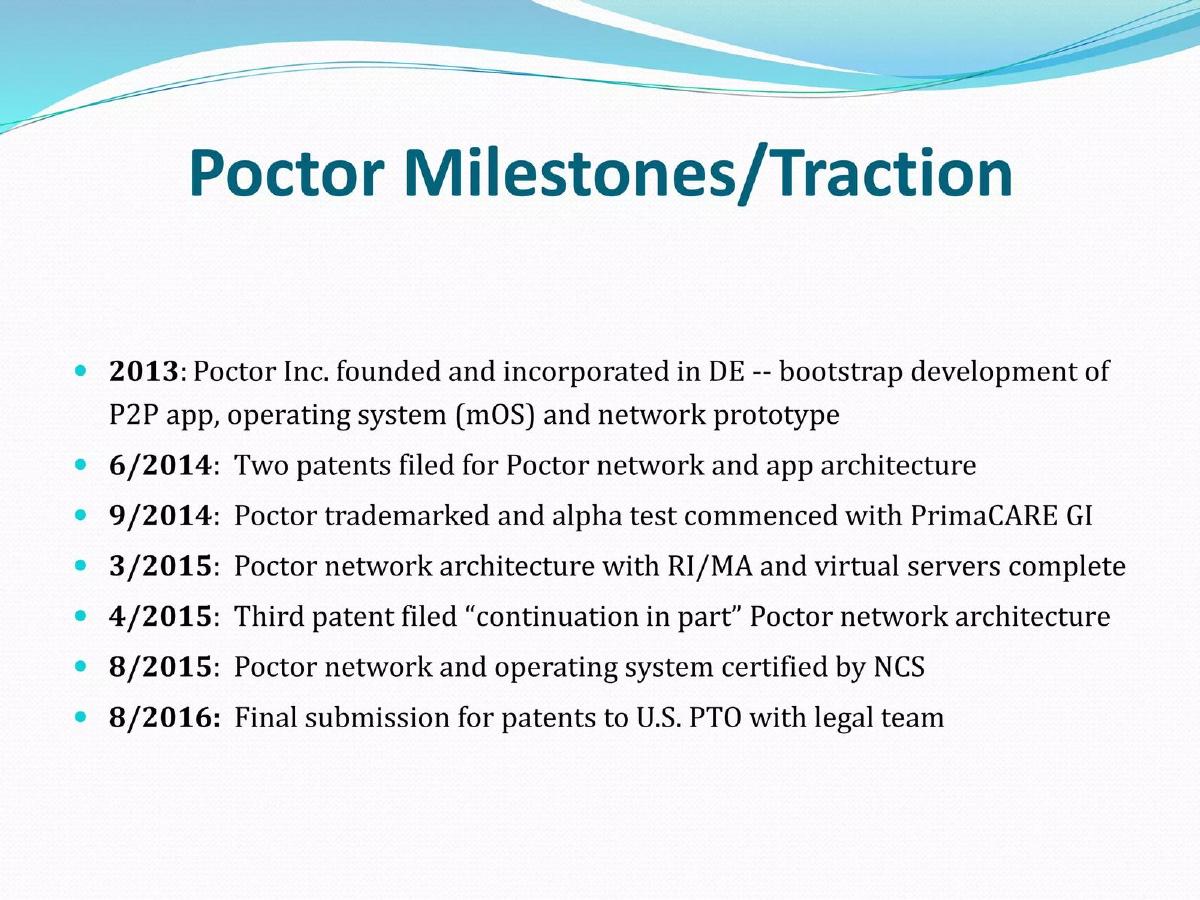
Stage not recorded. A network and app for medical devices. Dated milestones in text.
Poctor deck, slide 4. Exact stored slide matched to this analysis.
Our analysis: The weaker example: it shows work done, not demand. The one customer signal, an alpha test with a clinic, is buried in the middle.
Evidence and limitation: Dates for patents, a trademark, an alpha test and a certification; no users, patients or revenue.
What a founder can adapt: Pull out the clinic test and report what happened: how many patients or devices, and what the clinic said.
Supporting analysis
What the deck claims: "Poctor Milestones/Traction." "2013: Poctor Inc. founded and incorporated in DE -- bootstrap development of P2P app, operating system (mOS) and network prototype." "6/2014: Two patents filed." "9/2014: Poctor trademarked and alpha test commenced with PrimaCARE GI." "3/2015: Poctor network architecture with RI/MA and virtual servers complete." "4/2015: Third patent filed." "8/2015: Poctor network and operating system certified by NCS." "8/2016: Final submission for patents to U.S. PTO."
Presentation choice: Included for contrast; a product timeline is not traction on its own.
When it does not fit: Filling a traction slide with patents and incorporation dates; move them to a roadmap or technology slide.
Which kinds of proof each slide gives: revenue, named buyers, counts by user group, and whether change over time is shown.
Example
Product
Revenue shown
Named buyers
Counts by group
Change over time
Sano Genetics
Genetic research software
Growth rate
Types, not names
Network size
Yes
Docola
Patient education
No
No
Yes, three groups
No
Well Track
Student mental health
ARR
Three universities
No
No
Rootine
Personalized vitamins
Chart, no values
No
Vague
Yes
Find My Doctor
Online visits and tests
No
No
Yes, four services
No
Penda Health
Clinics in Kenya
Profitable pilots
Government (pending)
52 customers
No
Poctor
Medical device network
No
One clinic test
No
Dates only
Key Takeaways
Give a number for each group: patients, clinicians, paying institutions.
Name the institutions that adopted it, not only a count.
Show revenue or paying customers, not just usage.
Say where each number comes from and what period it covers.
Build your healthcare traction slide
Start with who pays, then show each user group and how it is changing.
Paying buyers. Revenue or ARR, and the hospitals, employers, insurers or schools paying it.
User groups. Patients, clinicians and partners, each with a count.
Change. Growth over a stated period, or before and after a date.
Source. Where each number comes from and when it was measured.
Copyable framework: [Revenue or ARR] as of [date], growing [rate] over [period]. Paid by [named buyers]. [n] patients, [n] clinicians. Source: [system or survey].
Illustrative example 1 — written by us
Before: 2014: Poctor trademarked and alpha test commenced with PrimaCARE GI. 2015: Poctor network and operating system certified by NCS.
After: Alpha test with PrimaCARE GI: [n] devices connected, [n] patients over [period]. [Result the clinic reported]. Certified by NCS (August 2015).
What improved: Our illustrative rewrite; not Poctor's wording. Bracketed parts are placeholders to fill with real facts. It leads with the customer test and asks for usage and results instead of dates.
What this guide adds
The library has a general traction guide, a clinical evidence guide for study results, and sector traction guides for SaaS, fintech, AI and marketplaces, but no guide on commercial traction for health companies. This page looks at how health startups show adoption and revenue rather than clinical outcomes.
Sector labels come from the sector recorded for each published teardown (high confidence for all except Docola, which is medium). None of these seven slides appears in another guide. One other slide from the Penda Health deck is used in the healthcare product guide for a different lesson.
Four ways health decks show traction
Adoption by named buyers (Sano Genetics, Well Track): revenue or ARR next to the institutions using it.
Counts by user group (Docola, Find My Doctor): patients, clinicians, tests or partners, each with its own number.
Revenue over time (Rootine): a chart by year with a few supporting points.
Early milestones (Penda Health, Poctor): first customers, deals and dates, stronger when they include paying users.
Common mistakes
Usage with no payer. Health investors want to know who pays: patients, employers, insurers or hospitals.
Counts with no period. Say whether a number is per month, per year or to date.
Milestones instead of demand. Patents and certifications belong elsewhere unless paired with users.
Pending deals shown as signed. Label letters of intent and talks clearly.
Diagnostic checklist
Revenue or paying customers.
Named buyers you are allowed to show.
A count for each user group.
A period and a source for every number.
Frequently asked questions
How we chose these examples
Corpus: published pitch deck teardowns on StartupFundraising.com. Founder-uploaded private decks are excluded.
Selection (2026-09-27): we took teardowns whose recorded sector is healthtech, with a stored slide image and a slide title about traction, growth, milestones, momentum or statistics. We read the candidates, left out slides filed under this sector that are not health companies (hotels, pubs, pet cafes, cannabis), market-growth slides, slides already used in other guides (Flo, Jibe Health, Palta), a facility history spanning fifteen years that reads as a history slide (Difi) and a slide about a home-health acquisition plan (Canexxia), and kept seven that show different ways of presenting health traction. Poctor is included as a weaker example for contrast.
Sector is the category recorded for each teardown (high confidence except Docola, medium). Stages as recorded: Sano Genetics and Rootine, Series A; Well Track and Penda Health, seed; Docola, Find My Doctor and Poctor, not recorded.
Review: stored slide images were checked on 2026-09-27 and matched to company, deck and slide number, and quoted text was read from the images (editorial model review). No person has yet completed an editorial review of this page.
Claims and figures are as shown on the slides; we have not verified them. We make no claim that any slide caused a fundraising outcome.