Ad-Supported Business Model Slides: 10 Real Examples
How media, creator and ad-supported startups show audience turning into revenue: views, CPM, slots, revenue share and sponsorship.
Advertising Business Model Slide: From Audience to Revenue
When advertisers or sponsors pay instead of users, revenue depends on how much audience you have and what each unit of it sells for. This guide compares ten real business model slides from media, creator and ad-supported companies on one question: does the slide show the chain from audience to revenue (the unit sold, its price, and your share), and is each price the company's own or a market benchmark?
TL;DR
Show the unit you sell (a thousand views, an ad slot, a sponsored post), its price, your share, and the audience it applies to, and say whether the price is measured or borrowed. Mandalay Digital comes closest: $1.50 per ad slot, four slots per device and a 50% revenue share give $3.00 per device, and the slide shows the multiplication. Bukalapak multiplies 400,000 daily page views by a $1.50 CPM to get $600 a day, which checks out, but the CPM is an assumption. FaZe Clan breaks forecast revenue into streams and gives revenue per fan. Snibble quotes a market-wide video CPM, not its own. Punchup names the fee type for each stream without prices. Pickle lists sponsorship benefits with no price. Blackpepper writes its ad revenue as one multiplication from users to CPM; BrandBoards shows priced inventory in its own product; beehiiv states its 20% share of ad revenue; AudioMob says it takes a share without saying how much.
Advertising business model slides from real pitch decks
Each example shows the slide above its analysis and links to the full teardown. Slides that show the full chain from audience to revenue come first. Claims are as shown on the slides; checks and comments are ours.
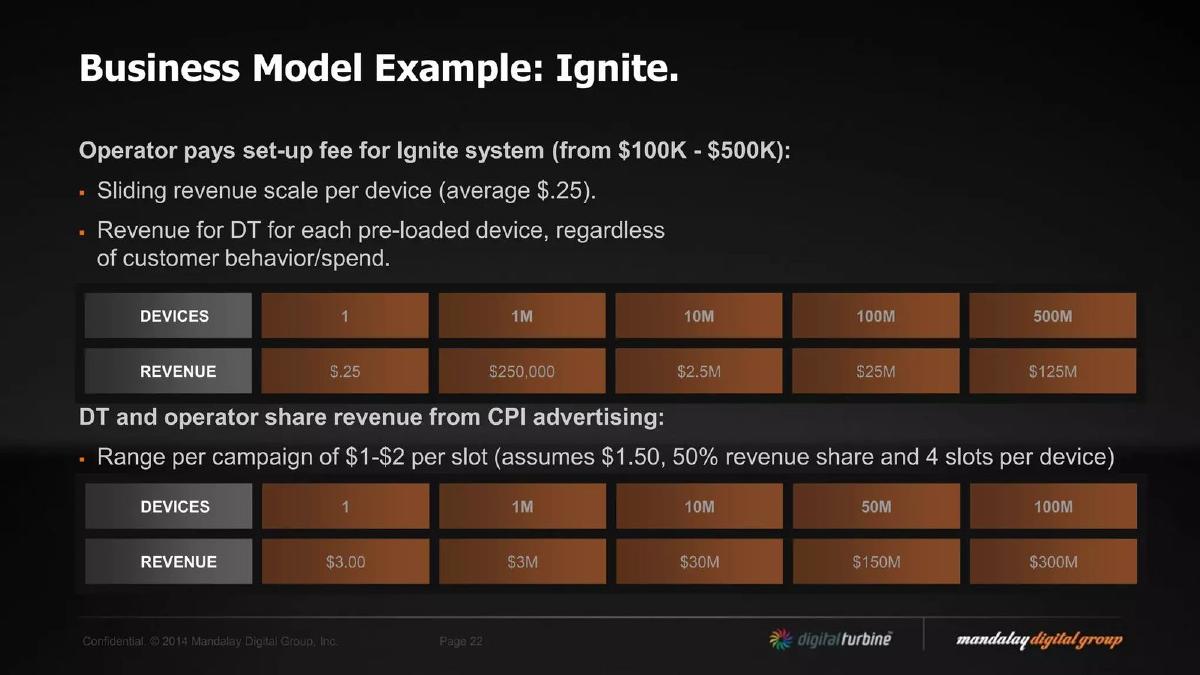
Mandalay Digital (Digital Turbine) business model slide — slide 22
Mandalay Digital deck, slide 22. Exact stored slide matched to this analysis.
Our analysis: Two revenue lines: a fee per device paid by the operator, and a share of pay-per-install advertising. The first doesn't depend on users; the second does.
Evidence and limitation: The arithmetic holds: $1.50 × 4 slots × 50% = $3.00 per device, and $0.25 × 500 million = $125 million. The slide says "per campaign" but doesn't say how often each slot is sold, so $3.00 is per device per campaign cycle, not per year. The device tables are scale illustrations, not forecasts, and the slide doesn't say how many devices are live.
What a founder can adapt: Keep the formula and add the period and the base: "Each slot sells [N] times a year; [X] million devices live today".
Supporting analysis
What the deck claims: "Business Model Example: Ignite." "Operator pays set-up fee for Ignite system (from $100K – $500K): Sliding revenue scale per device (average $.25). Revenue for DT for each pre-loaded device, regardless of customer behavior/spend." A table from 1 device ($.25) to 500M devices ($125M). "DT and operator share revenue from CPI advertising: Range per campaign of $1–$2 per slot (assumes $1.50, 50% revenue share and 4 slots per device)." A table from 1 device ($3.00) to 100M devices ($300M).
Presentation choice: Every factor is stated (price per slot, slots, share), so an investor can change any assumption and redo the sum.
When it does not fit: Tables that run to 500 million devices without the current number next to them.
Indonesian online marketplace, early deck. The advertising line is a side revenue source for a marketplace.
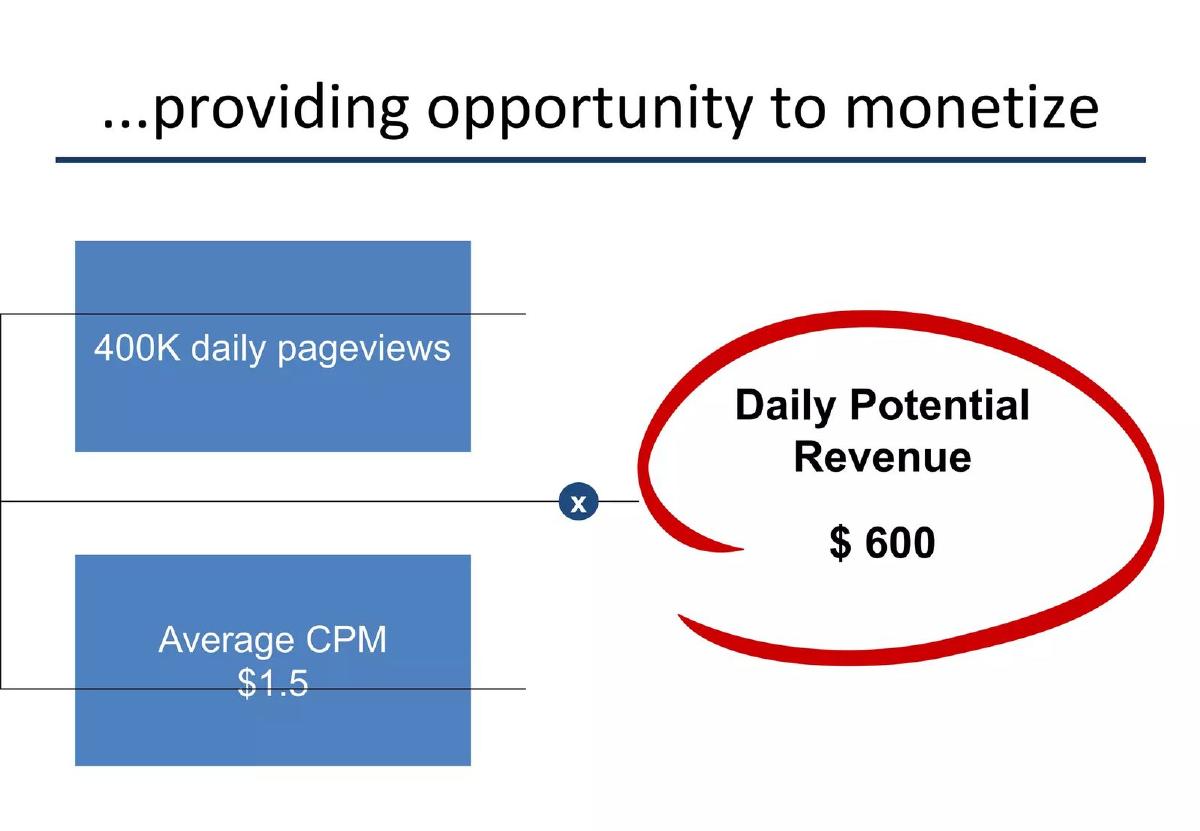
Bukalapak deck, slide 9. Exact stored slide matched to this analysis.
Our analysis: The simplest version of the chain: audience times price. What's missing is the share of page views that carry a sold ad.
Evidence and limitation: The arithmetic holds: 400,000 ÷ 1,000 × $1.50 = $600. "Potential" is the right word: the sum assumes every page view is sold at the average CPM, and the slide doesn't say where $1.50 comes from.
What a founder can adapt: "400,000 daily page views × [X]% sold × $[CPM] (source: [ad network quote or current rate]) = $[Y] a day".
Supporting analysis
What the deck claims: "...providing opportunity to monetize." "400K daily pageviews" × "Average CPM $1.5" = "Daily Potential Revenue $600".
Presentation choice: One multiplication shows an investor what the audience is worth as advertising inventory.
When it does not fit: Treating all page views as sold inventory.
Gaming and creator media company; deck for a merger with a special-purpose acquisition company (SPAC).
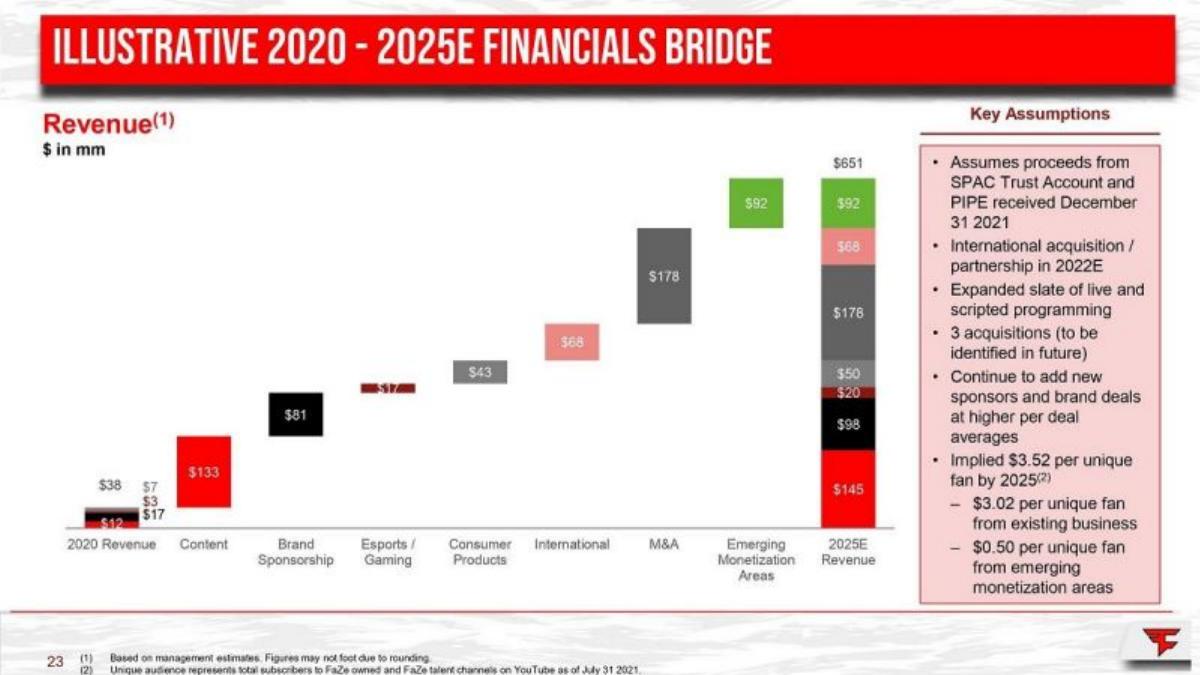
FaZe Clan deck, slide 23. Exact stored slide matched to this analysis.
Our analysis: A forecast that separates organic growth by stream from acquisitions and new areas, which lets an investor discount each part differently.
Evidence and limitation: The 2025E stack adds to $651 million; the steps from $38 million add to $650 million, which the rounding footnote covers. $178 million of the increase is acquisitions not yet identified ("3 acquisitions (to be identified in future)"). Revenue per fan is a helpful unit, but subscriber counts across channels can include the same person more than once, so "unique" may overstate the audience.
What a founder can adapt: Show today's revenue per fan next to the 2025 figure, and the sponsorship deal count and average today: "[N] deals, average $[X] ([year])".
Supporting analysis
What the deck claims: "Illustrative 2020 – 2025E financials bridge." Revenue in $ millions: 2020 revenue $38; additions for content $133, brand sponsorship $81, esports/gaming $17, consumer products $43, international $68, M&A $178, emerging monetization areas $92; 2025E revenue $651. Key assumptions include "Continue to add new sponsors and brand deals at higher per deal averages" and "Implied $3.52 per unique fan by 2025: $3.02 per unique fan from existing business, $0.50 per unique fan from emerging monetization areas." Footnotes: "Based on management estimates. Figures may not foot due to rounding"; unique audience is "total subscribers to FaZe owned and FaZe talent channels on YouTube as of July 31 2021".
Presentation choice: It gives revenue per fan, which converts an audience into money in one figure.
When it does not fit: Counting unidentified acquisitions in the headline revenue figure without separating them.
Short-video app. The footer reads "Snibble Investor Deck, November 2018".
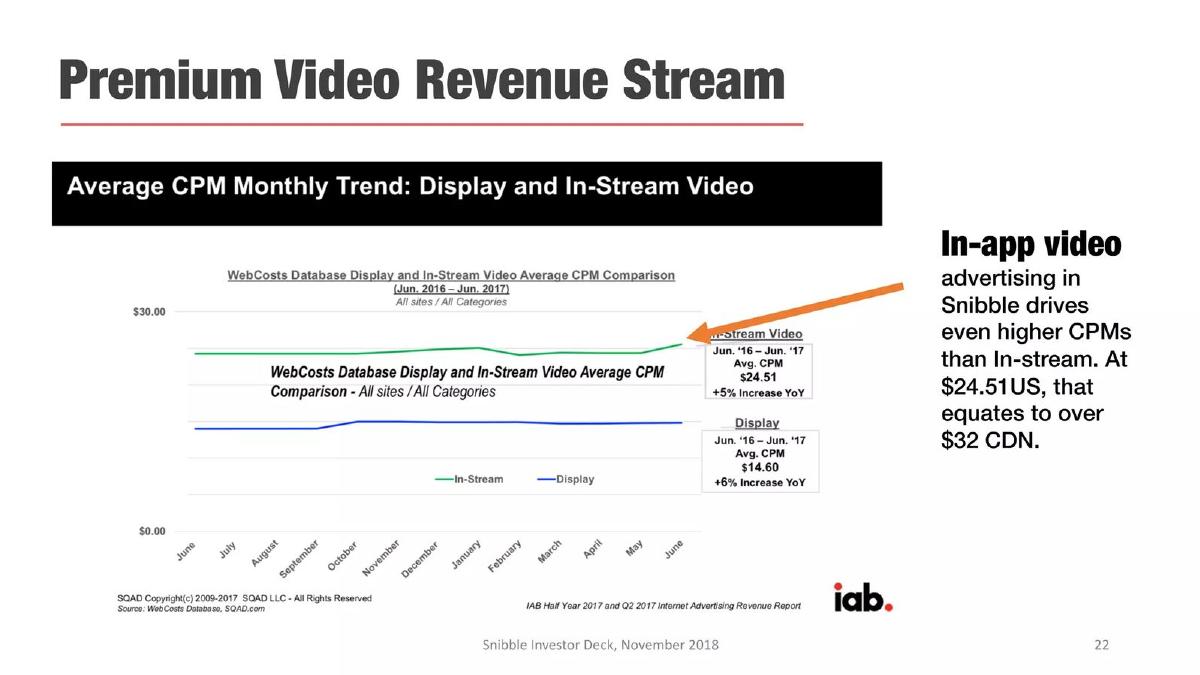
Snibble deck, slide 22. Exact stored slide matched to this analysis.
Our analysis: A benchmark used as the price in the chain. That can be reasonable before a company has sold ads, as long as it is labelled; here the source is labelled but the claim to beat it is not supported.
Evidence and limitation: The $24.51 is a market-wide average for all sites, not Snibble's rate, and the claim that Snibble "drives even higher CPMs" has no number of its own. The chart's data ends in June 2017, 17 months before the deck date. The Canadian-dollar conversion implies a rate of about 1.31, which the slide doesn't state.
What a founder can adapt: "Market in-stream CPM $24.51 (SQAD, June 2017). Our assumption: $[X], because [reason]. Our first campaigns: $[Y] ([date])".
Supporting analysis
What the deck claims: "Premium Video Revenue Stream." "Average CPM Monthly Trend: Display and In-Stream Video" (WebCosts database, June 2016 – June 2017, all sites and categories): in-stream video average CPM $24.51, +5% year on year; display $14.60, +6%. "In-app video advertising in Snibble drives even higher CPMs than in-stream. At $24.51 US, that equates to over $32 CDN." Sources: SQAD WebCosts; "IAB Half Year 2017 and Q2 2017 Internet Advertising Revenue Report".
Presentation choice: It cites where its CPM comes from, which most early decks don't.
When it does not fit: Implying a benchmark is your own rate.
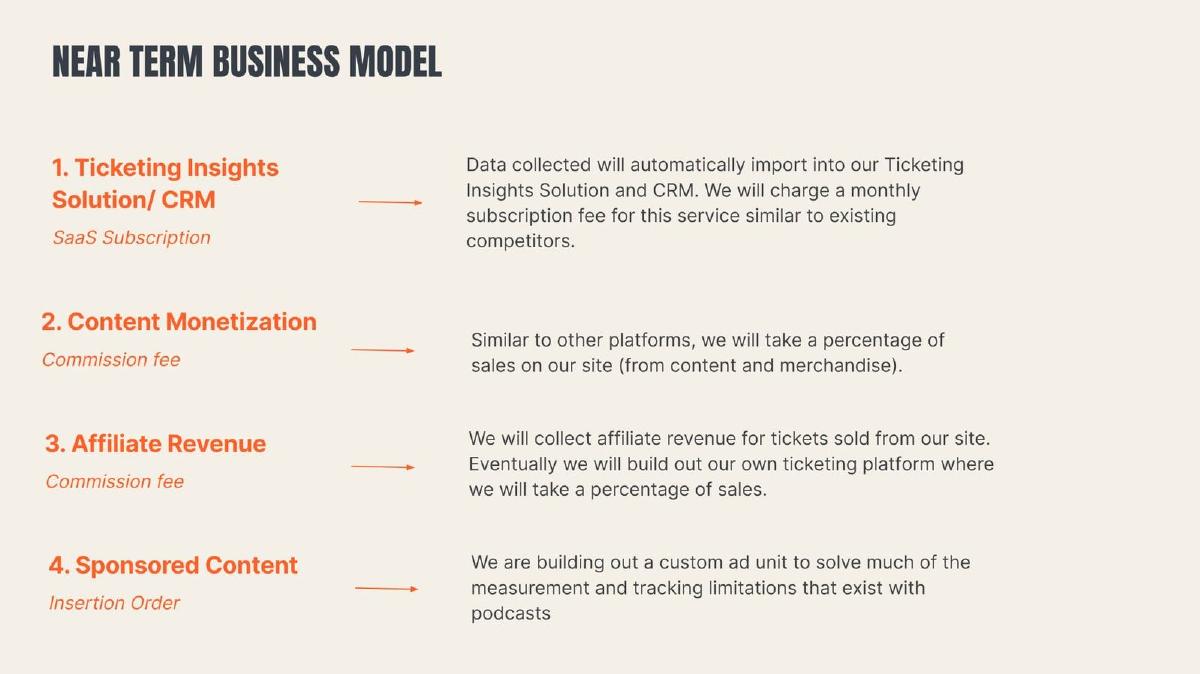
Comedy content and ticketing platform. Included as a weaker example.
Punchup Live deck, slide 16. Exact stored slide matched to this analysis.
Our analysis: Advertising is one of four planned streams, with a product reason (podcast measurement) for why it could earn more.
Evidence and limitation: Each stream is labelled with how it is charged, and sponsorship is sold by insertion order (a direct contract with the advertiser). No prices, commission rates or audience figures.
What a founder can adapt: Add one number per stream: "Sponsored content: $[X] per episode at [N] downloads".
Supporting analysis
What the deck claims: "Near term business model." "1. Ticketing Insights Solution/CRM – SaaS subscription"; "2. Content Monetization – commission fee"; "3. Affiliate Revenue – commission fee"; "4. Sponsored Content – insertion order": "We are building out a custom ad unit to solve much of the measurement and tracking limitations that exist with podcasts."
Presentation choice: Naming the charging method for each stream is a step many slides skip.
When it does not fit: Four near-term streams with no order of priority.
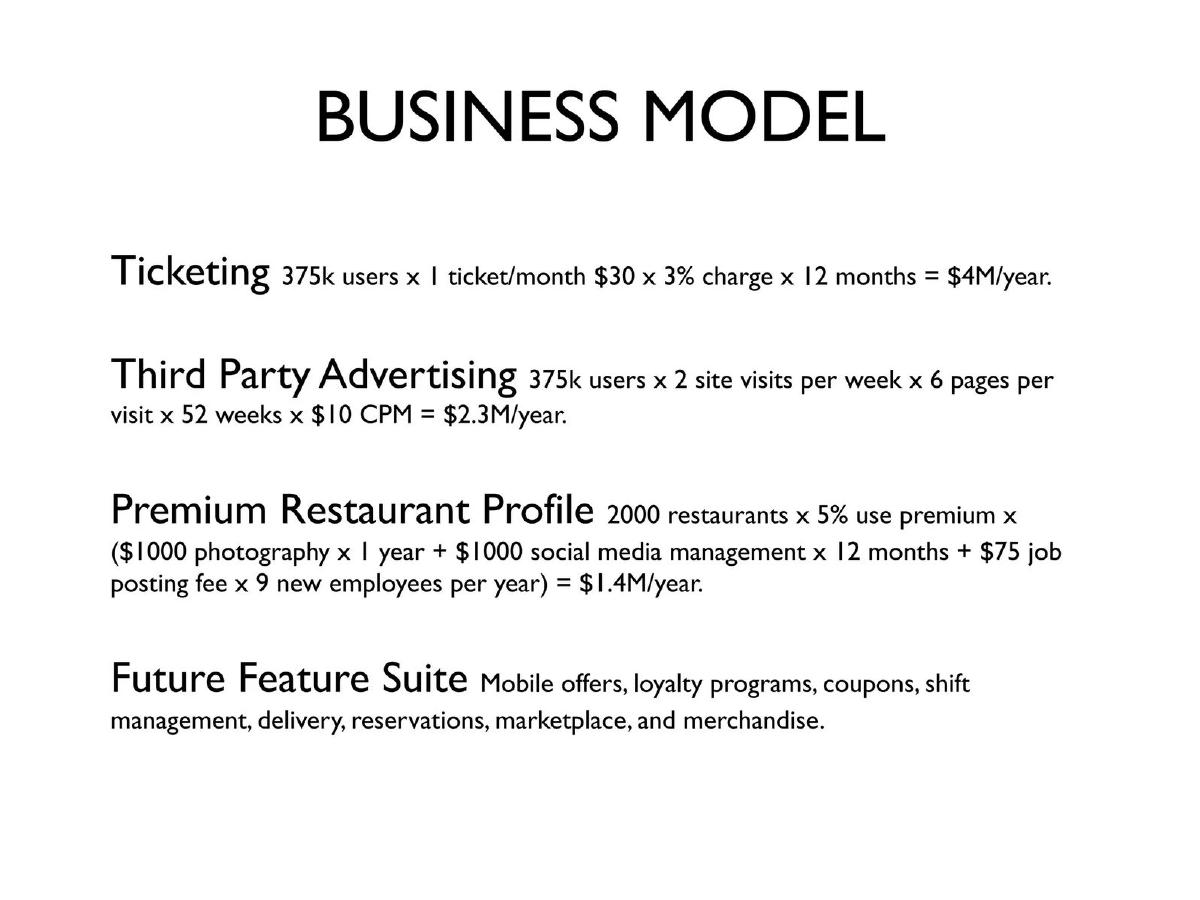
Restaurant discovery and ticketing site. Stage is not stated; advertising is one of three revenue streams. A different page of this deck (p4) was read for the first version of this guide and not used.
Blackpepper deck, slide 7. Exact stored slide matched to this analysis.
Our analysis: Advertising is sized from the same user base as ticketing, so investors can compare the streams on one assumption.
Evidence and limitation: Our calculation: 375,000 × 2 × 6 × 52 = 234 million page views a year; at $10 per thousand that is $2.34 million, so the slide's $2.3M holds. All inputs are planned; the slide does not say whether 375,000 users exist today.
What a founder can adapt: Write your ad stream as one multiplication and say which inputs are measured today.
Supporting analysis
What the deck claims: "Business Model." "Ticketing 375k users x 1 ticket/month $30 x 3% charge x 12 months = $4M/year." "Third Party Advertising 375k users x 2 site visits per week x 6 pages per visit x 52 weeks x $10 CPM = $2.3M/year." "Premium Restaurant Profile 2000 restaurants x 5% use premium x ($1000 photography x 1 year + $1000 social media management x 12 months + $75 job posting fee x 9 new employees per year) = $1.4M/year." "Future Feature Suite": mobile offers, loyalty, coupons and others.
Presentation choice: Every step from audience to revenue is on one line, so an investor can change any input and recompute.
When it does not fit: It assumes every page view carries one sold ad at $10. Add a sell-through rate and say where the $10 comes from.
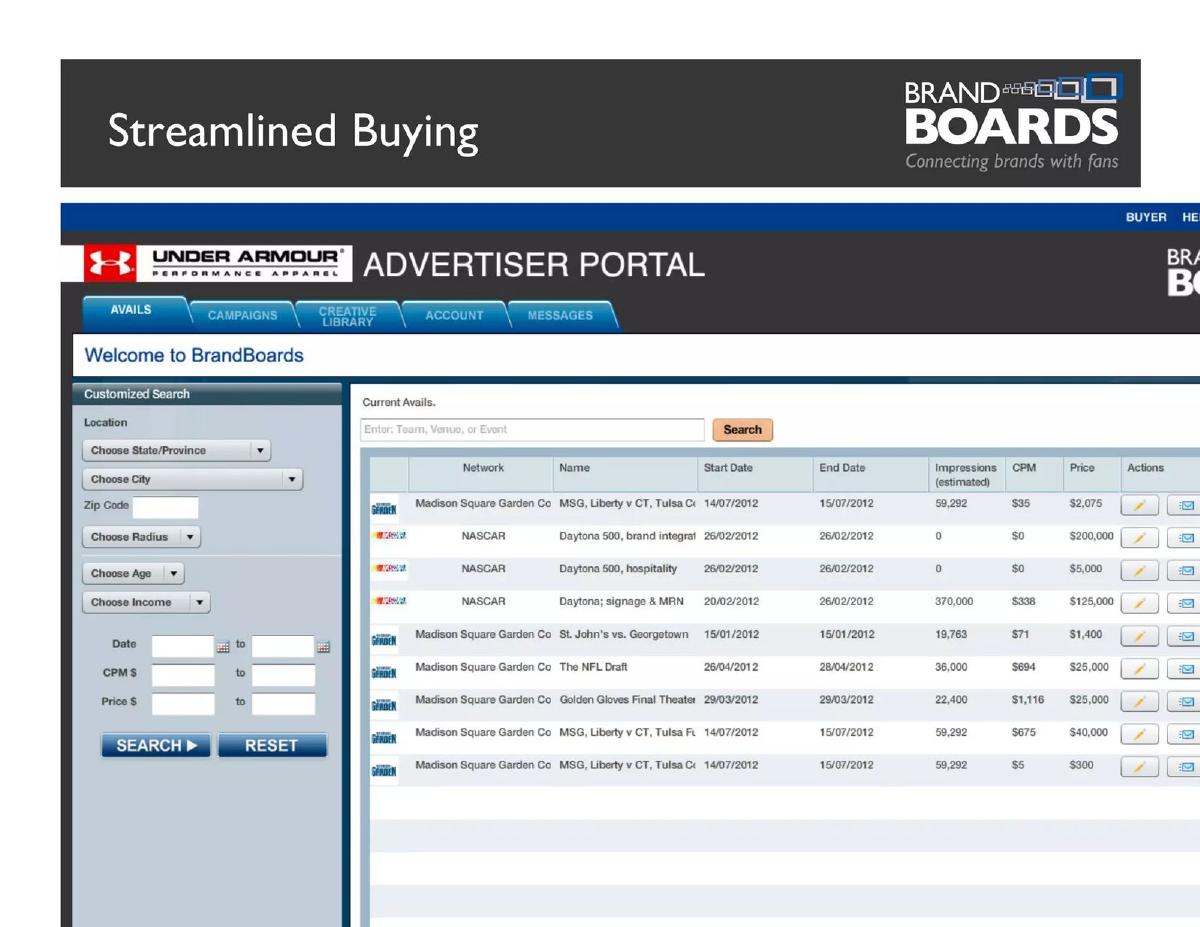
Marketplace for buying sports and venue sponsorship inventory. The listings are dated 2012.
BrandBoards deck, slide 6. Exact stored slide matched to this analysis.
Our analysis: It shows the unit sold (a dated placement with an impression estimate) and its price, at the point of purchase.
Evidence and limitation: Prices and CPMs for real-looking venue inventory, inside the product. The slide doesn't say whether any listing sold, what BrandBoards keeps, or whether the advertiser logo is a customer. CPMs run from $5 to $1,116, and some rows show 0 impressions.
What a founder can adapt: If your product lists ad inventory, show it with prices, then add one line on what you keep per sale.
Supporting analysis
What the deck claims: "Streamlined Buying." A screenshot of an "Advertiser Portal" (shown with an Under Armour logo) listing current inventory: Madison Square Garden and NASCAR items with start and end dates, estimated impressions, CPM and price. Examples: "MSG, Liberty v CT" 59,292 impressions, $35 CPM, $2,075; "Daytona 500, brand integration" 0 impressions, $0 CPM, $200,000; "The NFL Draft" 36,000 impressions, $694 CPM, $25,000.
Presentation choice: Showing priced inventory in the product makes the unit and price concrete in a way a revenue table can't.
When it does not fit: A screenshot isn't revenue. State what has sold and your take rate, and explain rows with zero impressions.
Newsletter platform. Stage and year are not stated on the slide.
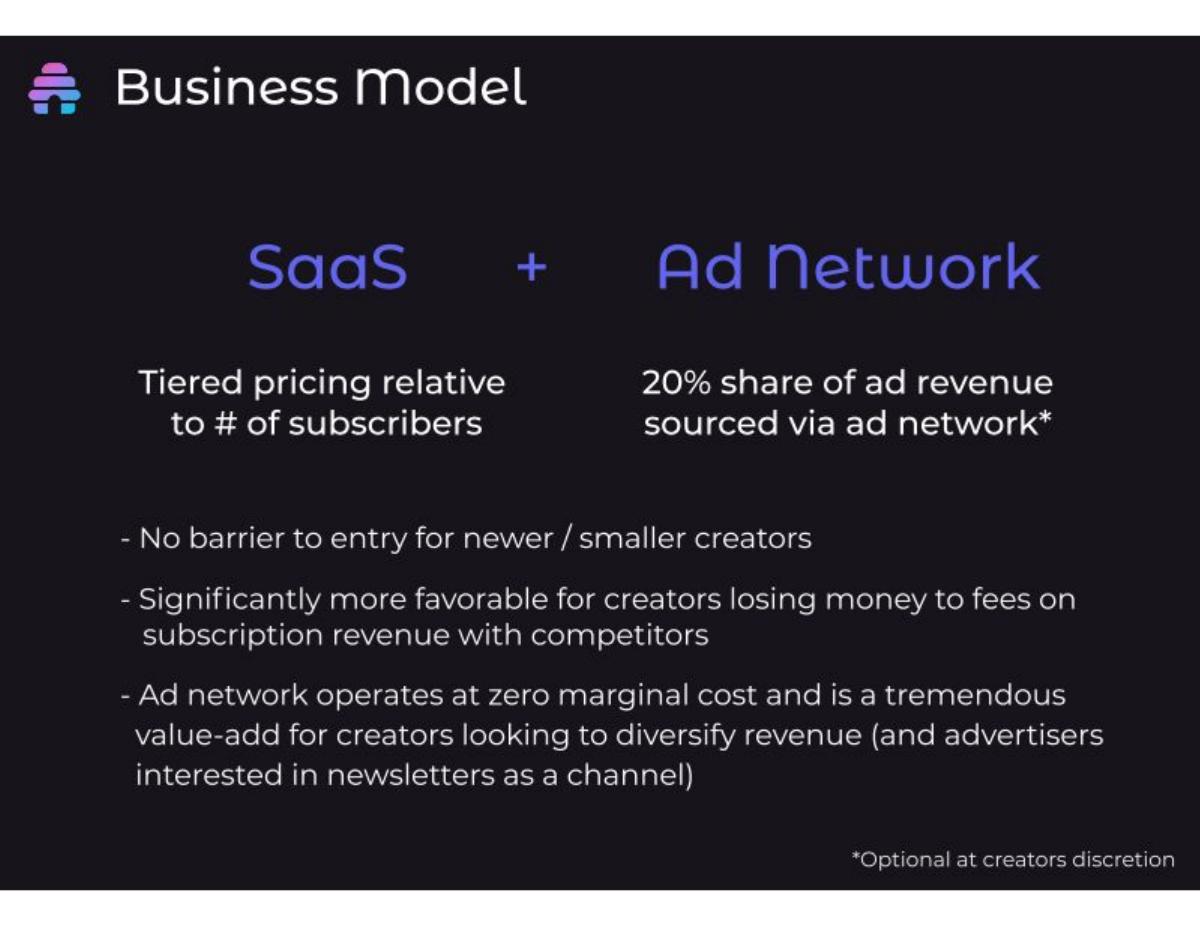
beehiiv deck, slide 12. Exact stored slide matched to this analysis.
Our analysis: Advertising is a second stream on top of subscriptions, earned as a share of what creators sell.
Evidence and limitation: The take rate (20%) is stated and the ad network is optional for creators. No ad volumes, CPMs or creator counts.
What a founder can adapt: Give your revenue share as a number and say whether partners can opt out.
Supporting analysis
What the deck claims: "Business Model. SaaS + Ad Network." "Tiered pricing relative to # of subscribers"; "20% share of ad revenue sourced via ad network*" ("*Optional at creators discretion"). Bullets: no barrier to entry for newer or smaller creators; more favourable for creators losing money to fees on subscription revenue with competitors; "Ad network operates at zero marginal cost".
Presentation choice: It states exactly what the company keeps, which many ad-network slides leave out.
When it does not fit: "Zero marginal cost" is a claim; ad sales and fraud checks cost money. Add how many creators have opted in.
Audio advertising inside mobile games. Stage and year are not stated on the slide. Included as a weaker example.
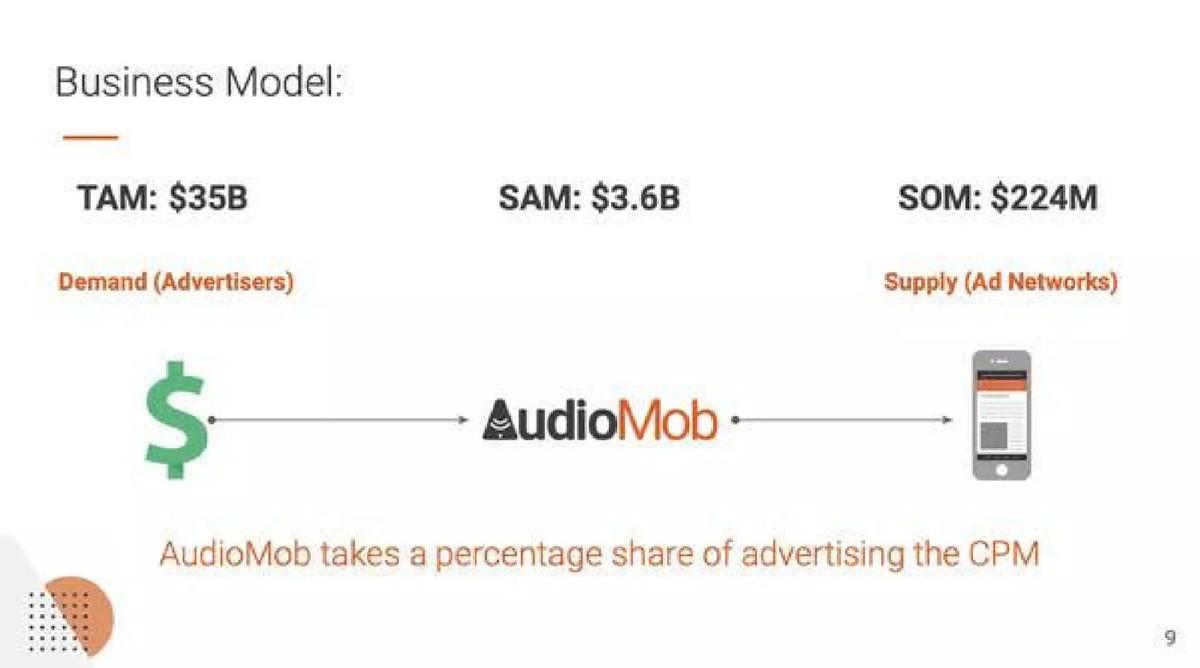
AudioMob deck, slide 9. Exact stored slide matched to this analysis.
Our analysis: A marketplace model between advertisers and supply, described in words only.
Evidence and limitation: Market sizes without sources, and a revenue share with no percentage, CPM or volume.
What a founder can adapt: "We keep [X]% of a $[CPM] audio CPM across [N] million monthly impressions."
Supporting analysis
What the deck claims: "Business Model:" "TAM: $35B", "SAM: $3.6B", "SOM: $224M". A diagram: "Demand (Advertisers)" → AudioMob → "Supply (Ad Networks)". "AudioMob takes a percentage share of advertising the CPM".
Presentation choice: Included to show that naming a revenue share isn't enough; compare beehiiv's stated 20%.
When it does not fit: Market sizes on the business model slide in place of the company's own unit economics.
Whether each slide names the unit sold, gives its price and source, and multiplies it by an audience.
Example
Unit sold
Price
Own rate or benchmark
Multiplied out
Mandalay Digital
Ad slot per device; fee per device
$1.50 per slot; $0.25 per device
Assumption from a stated range
Yes
Bukalapak
Thousand page views
$1.50 CPM
Not stated
Yes ($600 a day, all views sold)
FaZe Clan
Revenue per fan; sponsorship deals
$3.52 per fan (2025E)
Management estimate
Yes, as a forecast
Snibble
Thousand video impressions
$24.51 CPM
Market benchmark
No
Punchup Live
Insertion orders and commissions
None
Not applicable
No
Pickle
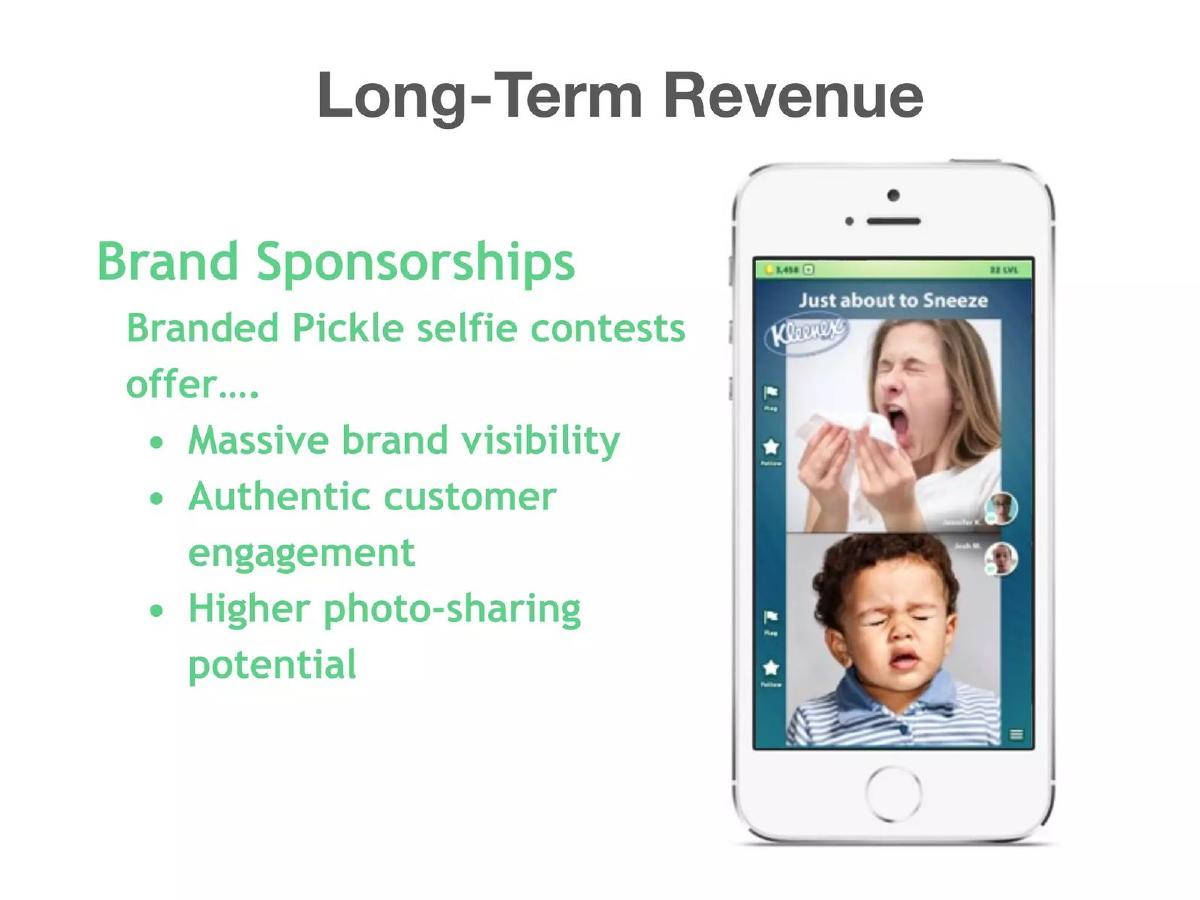
Sponsored contest
None
Not applicable
No
Blackpepper
Thousand page views
$10 CPM
Not stated
Yes ($2.3M a year, all views sold)
BrandBoards
Dated venue placement
$300 to $200,000 per listing
Listed prices in product
No
beehiiv
Share of ad revenue
20% take rate
Own terms
No
AudioMob
Share of CPM
None
Not applicable
No
Key Takeaways
Name the unit you sell: a thousand impressions (CPM), a slot, an install, a sponsored post.
Give its price and your share if you split revenue with a partner.
Multiply it out against your audience, as Bukalapak and Mandalay do.
Mark whether the price is your own measured rate or a market benchmark.
Not every view carries an ad. State how many are sold (fill), or say you assume all.
For sponsorships, give a deal count or an average deal size.
Build your advertising business model slide
Start from the audience and work to revenue.
Audience. Views, users or devices per day or month, measured when?
Unit. What do you sell: thousand impressions, slots, installs, sponsored posts?
Sold share. What share of the audience carries a paid ad today, or what do you assume?
Price and share. Rate per unit, whether it is your own or a benchmark (with source), and the share you keep.
Result. Multiply it out for a stated period and label it measured or forecast.
Copyable framework: [Audience] per [period] × [X]% sold × $[price] per [unit] ([own rate or benchmark, source]) × [share kept]% = $[Y] per [period] ([measured or forecast]).
Illustrative example 1 — written by us
Before: Revenue: advertising and sponsorships.
After: [N] monthly video views × [X]% with a paid ad × $[CPM] per thousand (our rate, [month]) = $[Y] a month. Sponsorships: [K] deals, average $[Z].
What improved: Our illustrative rewrite; all bracketed figures are placeholders, not company facts. It turns two labels into a sum an investor can check.
What this guide adds
The consumer app business model guide covers users paying through freemium plans, with advertising as a side line. The marketplace guide covers commissions. This guide covers companies where advertisers or sponsors are the main payer: publishers, content platforms, creator businesses and ad networks.
Two terms recur. CPM is the price per thousand ad impressions. A revenue share is the percentage of ad revenue kept when a partner (a phone operator, a platform) delivers the audience.
The audience-to-revenue chain
Audience: views, devices or fans, with a period.
Sold share: how much of that audience carries a paid ad or sponsorship. None of these slides states it, and Bukalapak's $600 a day assumes every page view is sold at the average CPM.
Price and share: the rate per unit and the share kept. A benchmark rate is fine for a new company if the slide labels it and gives the source, as Snibble does.
How we read each slide
We quote the text on the slide images and describe charts from what is drawn. We have not checked company claims. None of these pages was in our stored image set, so we rendered each from the original deck file in our library; the pages shown are the ones quoted. Where a slide multiplies figures, we redid the multiplication.
Common mistakes
All views sold. State the share of the audience that carries a paid ad.
Benchmark as own rate. Label market CPMs as benchmarks and give the source.
No period. Per day, per month or per campaign: say which.
Scale tables without today's base. Put the current audience next to the illustration.
Sponsorship without volume. Give a deal count or average deal size.
Acquisitions in the headline. Show organic revenue separately from revenue you plan to buy.
Diagnostic checklist
Names the unit sold and its price.
Says whether the price is measured or a labelled benchmark.
States the share of the audience sold and any revenue share.
Multiplies it out for a stated period.
Separates measured revenue from forecasts.
Frequently asked questions
How do I show an advertising business model on a pitch deck slide?
Show the audience, the unit you sell, its price, the share you keep and the result for a stated period. Mandalay Digital's slide multiplies price per slot, slots per device and a 50% revenue share to get $3.00 per device.
Can I use an industry CPM if I haven't sold ads yet?
Yes, if you label it as a benchmark and give the source and date. Snibble cites a market-wide video CPM with its source, but its claim to beat that rate has no number behind it.
How we chose these examples
Corpus: published pitch deck teardowns on StartupFundraising.com. Founder-uploaded private decks are excluded.
Selection (2026-09-26): we searched teardown text for CPM, sponsorship, advertising revenue, ad revenue, brand deals and branded content on business model or revenue slides. We rendered 16 candidate pages from 14 decks and read each.
Kept six. Excluded: Twitter p57 (ad revenue per 1,000 timeline views, Q3 2012 to Q3 2013, a strong example) because our slide-image workflow stores pages 1 to 24 only and we don't publish examples without the exact slide image; BagSpeak p3 (sponsorship as funding for a non-profit project, a different question); Flowtab p6 (advertising shown as a market size, not its own revenue); OnStump p6, Bandwagon p6, Blackpepper p4, TurtleWise p4 and FaZe Clan p21 (the page read was not a revenue model or gave no advertising figures).
Update (2026-10-01): a second search of the full corpus for CPM, ad revenue and revenue share added Blackpepper p7, BrandBoards p6, beehiiv p12 and AudioMob p9, each checked against the original deck page image (AI editorial model review, not human). Boomeon was not used because its deck file is not in the library; listed-company and SPAC decks were excluded.
None of the chosen pages was in our stored image set; we rendered them from the original deck PDFs in our library and stored them with the existing slide-image workflow.
Review: slide images were checked on 2026-09-26 and matched to company, deck and page (editorial model review). No person has yet completed an editorial review of this page. We make no claim that any slide caused a fundraising outcome.