Media Startup Problem Slide: Real Pitch Deck Examples
How media, music, streaming and creator startups present the problem in a pitch deck: pick the audience, creator or business that pays.
Media Startup Problem Slide: Real Pitch Deck Examples
Eight problem slides from media, music, streaming and creator startups, shown in full, compare whose problem each slide describes (audience, creator or the business that pays), how it measures the loss, and what those people use today.
TL;DR
A media startup problem slide should answer three questions: whose problem is it (the audience, the creator, or the studio, label or advertiser that pays), how big is the loss in attention or money, and what do they use today? The Hustle shows that millennials make up only 28% of Wall Street Journal readers and cites Nielsen for CNBC's smallest audience since 1995. Audoo walks through how one song's royalties get lost and totals it at "over $2.7bn" a year. Lollipop Audio says game studios' current tools "only accomplish roughly 20% of the job". Circulate mocks Facebook, Twitter and Reddit but never measures anything, which is the weaker pattern.
Media startup problem slides from real pitch decks
Each example shows the exact stored slide above its analysis and links to the full teardown. Claims are as shown on the slides; we have not verified them.
The Hustle problem slide — slide 3
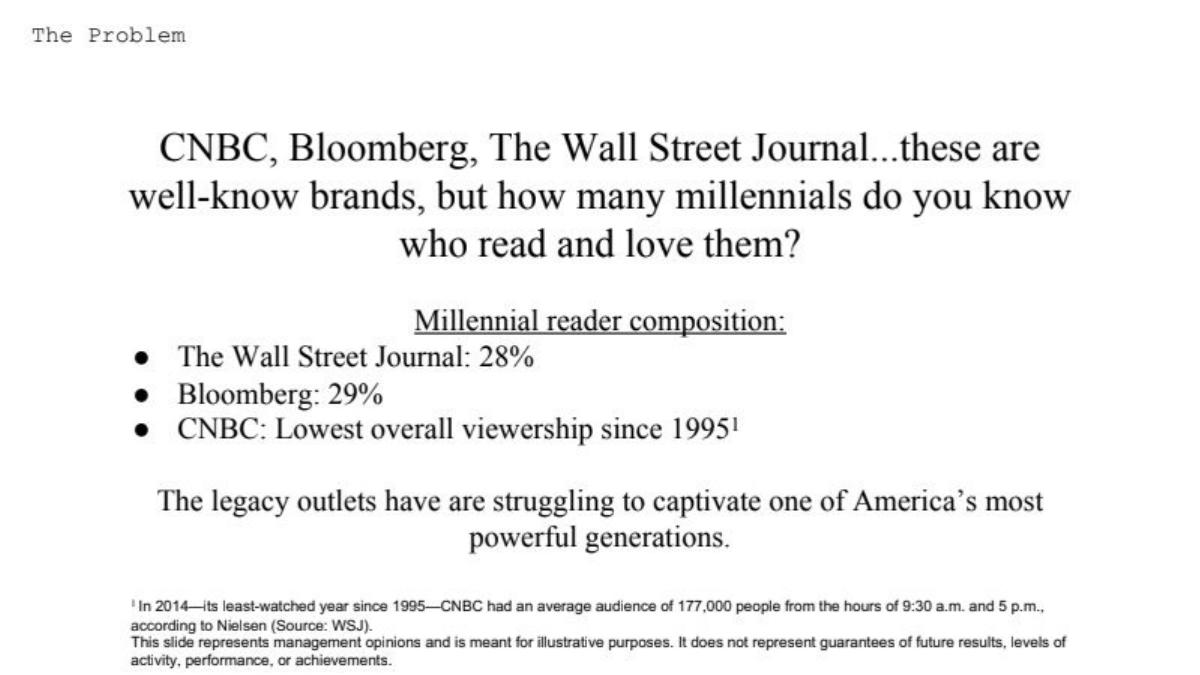
A business news newsletter for younger readers. Names the legacy outlets and gives their millennial share, with a cited footnote.
The Hustle deck, slide 3. Exact stored slide matched to this analysis.
Our analysis: It names the audience, the outlets they are expected to read, and a measure of how poorly those outlets reach them.
Evidence and limitation: The CNBC figure is sourced to Nielsen via the WSJ; the reader shares are not sourced on the slide.
What a founder can adapt: Name the outlets or platforms your audience is supposed to use and show one number for how poorly they reach them.
Supporting analysis
What the deck claims: "CNBC, Bloomberg, The Wall Street Journal...these are well-know brands, but how many millennials do you know who read and love them?" "Millennial reader composition: The Wall Street Journal: 28%, Bloomberg: 29%, CNBC: Lowest overall viewership since 1995." Footnote: "In 2014—its least-watched year since 1995—CNBC had an average audience of 177,000 people from the hours of 9:30 a.m. and 5 p.m., according to Nielsen (Source: WSJ)."
Presentation choice: Naming the incumbents and measuring their weakness answers "what do these readers use today?" before investors ask.
When it does not fit: Add sources for the reader shares, and say why advertisers (who pay) want this audience.
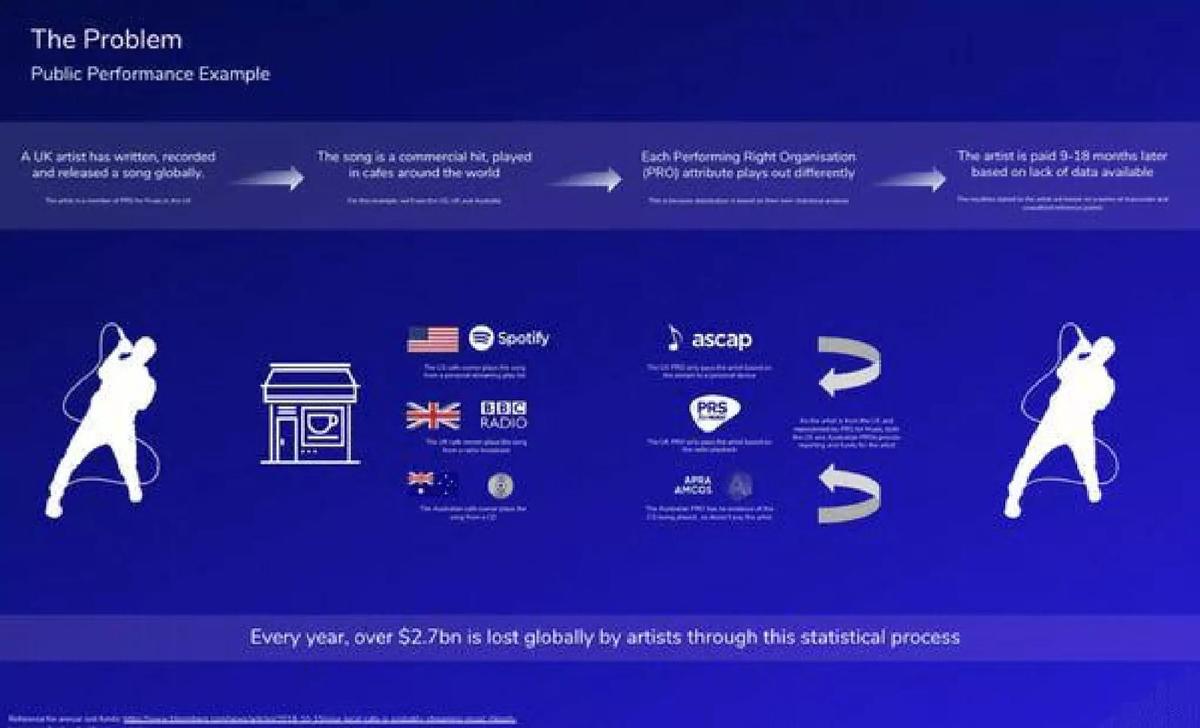
Music recognition for public performance royalties. Follows one song from release to the artist's payment, then totals the loss.
Audoo deck, slide 3. Exact stored slide matched to this analysis.
Our analysis: One worked example makes an abstract royalty problem easy to follow; the total then shows its scale.
Evidence and limitation: A source link for the $2.7bn figure is printed at the bottom of the slide.
What a founder can adapt: Walk through one real case step by step, mark where the money or attention is lost, then give the total.
Supporting analysis
What the deck claims: "Public Performance Example." Four steps: an artist releases a song; it is played in cafes around the world; each performing right organisation (PRO) attributes plays differently "based on lack of data available"; the artist is paid 9–18 months later. "Every year, over $2.7bn is lost globally by artists through this statistical process."
Presentation choice: It shows the current process (PROs estimating plays) and exactly where it fails (no data), so the solution has an obvious place to fit.
When it does not fit: Say who pays for the fix: artists, PROs or venues. The slide describes the artist's loss but the buyer may be the PRO.
Dialogue production tools for video game studios. Three statements about today's tools and their cost.
Lollipop Audio deck, slide 5. Exact stored slide matched to this analysis.
Our analysis: It names the buyer (game studios), the tools they use today and the hidden cost (specialist engineers).
Evidence and limitation: "Roughly 20%" is not sourced.
What a founder can adapt: If you sell to studios, labels or publishers, name their current tools and the staff cost those tools create.
Supporting analysis
What the deck claims: "Traditional linear recording, DJ, and delivery tools are used to produce video game dialog." "These tools require significant investment and only accomplish roughly 20% of the job." "Studios must therefore employ extremely specialized, experienced, expensive engineers to handle the process."
Presentation choice: This is a business-to-business media problem: the studio pays, and the cost is staff, which studios budget for.
When it does not fit: Put a figure on "expensive engineers": cost per hour of dialogue or per title.
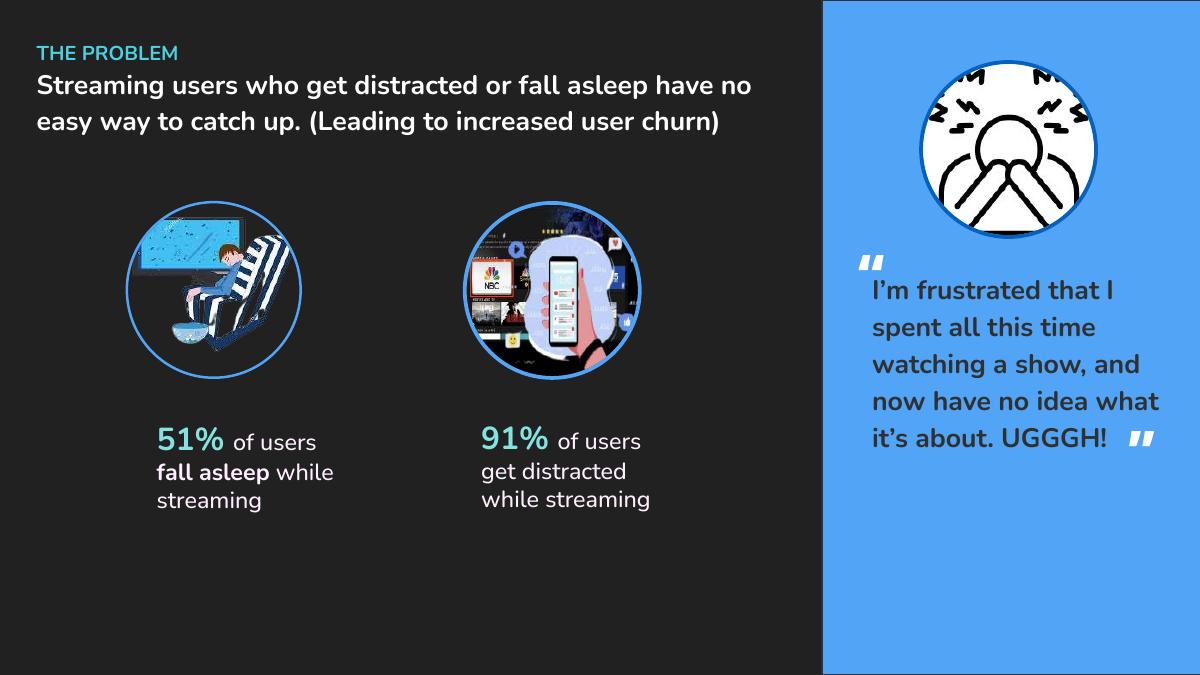
Catch-up summaries for streaming viewers. Two statistics and a viewer quote, linked to churn.
ZewindTV deck, slide 2. Exact stored slide matched to this analysis.
Our analysis: It connects a viewer frustration to churn, which is the cost the streaming service (the likely buyer) cares about.
Evidence and limitation: Percentages shown without sources; the quote is unattributed.
What a founder can adapt: Tie the audience's frustration to a number the paying business tracks: churn, watch time or ad views.
Supporting analysis
What the deck claims: "Streaming users who get distracted or fall asleep have no easy way to catch up. (Leading to increased user churn)." "51% of users fall asleep while streaming." "91% of users get distracted while streaming." Quote: "I'm frustrated that I spent all this time watching a show, and now have no idea what it's about. UGGGH!"
Presentation choice: Linking the audience's pain to the payer's metric is exactly the step most media problem slides skip.
When it does not fit: Source the percentages and attribute the quote; both read as invented without it.
Music discovery. One named listener persona with a quote.
Next deck, slide 3. Exact stored slide matched to this analysis.
Our analysis: In one sentence the listener names what he uses today (Pandora, YouTube, local shows) and why each falls short.
Evidence and limitation: One quote; no figures.
What a founder can adapt: Use one real listener or viewer quote that names what they use today and what annoys them.
Supporting analysis
What the deck claims: "The problem - a listener's perspective." "Robert G., music lover, Seattle, WA." "I love finding new music. I regularly use services like Pandora and YouTube, but I hate ads and it's hard to find the stuff I like. I go to local shows but unless it's someone I've heard of, it's hit or miss."
Presentation choice: A real-sounding voice makes the problem easy to picture and names the current alternatives without a competition table.
When it does not fit: Add how many listeners feel this way; one persona shows the problem exists, not that it is common.
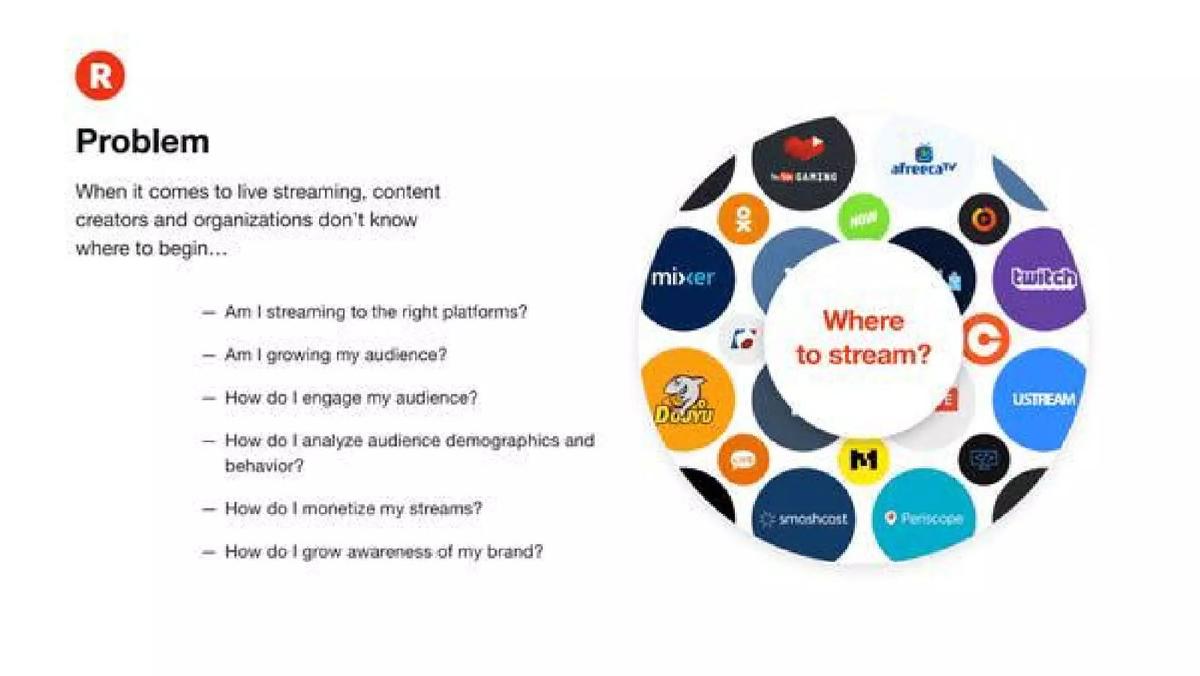
Multi-platform live streaming for creators. Six questions creators ask, beside a ring of streaming platform logos.
Restream deck, slide 3. Exact stored slide matched to this analysis.
Our analysis: The ring of logos shows the fragmentation well: creators have too many places to stream.
Evidence and limitation: No figures.
What a founder can adapt: If the problem is too many choices, show them all in one picture.
Supporting analysis
What the deck claims: "When it comes to live streaming, content creators and organizations don't know where to begin..." "Am I streaming to the right platforms?" "Am I growing my audience?" "How do I engage my audience?" "How do I analyze audience demographics and behavior?" "How do I monetize my streams?" "How do I grow awareness of my brand?" Centre of the ring: "Where to stream?"
Presentation choice: The visual makes the problem obvious at a glance, and the buyer (creators and organisations) is named.
When it does not fit: Six questions dilute the point. Lead with the one Restream solves (streaming to many platforms at once) and measure it.
Music industry data. A partial example: the right buyer, but four statements and no numbers.
Music Coco deck, slide 2. Exact stored slide matched to this analysis.
Our analysis: "Instinct … used to make … decisions like signings" is a sharp point: it names a decision a label pays for.
Evidence and limitation: No figures or sources.
What a founder can adapt: Keep the specific decision (signings) and add what a bad signing costs a label.
Supporting analysis
What the deck claims: "No definite place for music industry data." "Currently no way to measure efforts and gain insight for musicians, record labels and stakeholders." "Huge waste of money and time recorded in the industry." "Instinct currently used to make important make or break decisions like signings."
Presentation choice: It shows how close a slide can get and still fall short: the buyer and decision are there, the cost is not.
When it does not fit: Cut "huge waste of money and time" unless you can say how much.
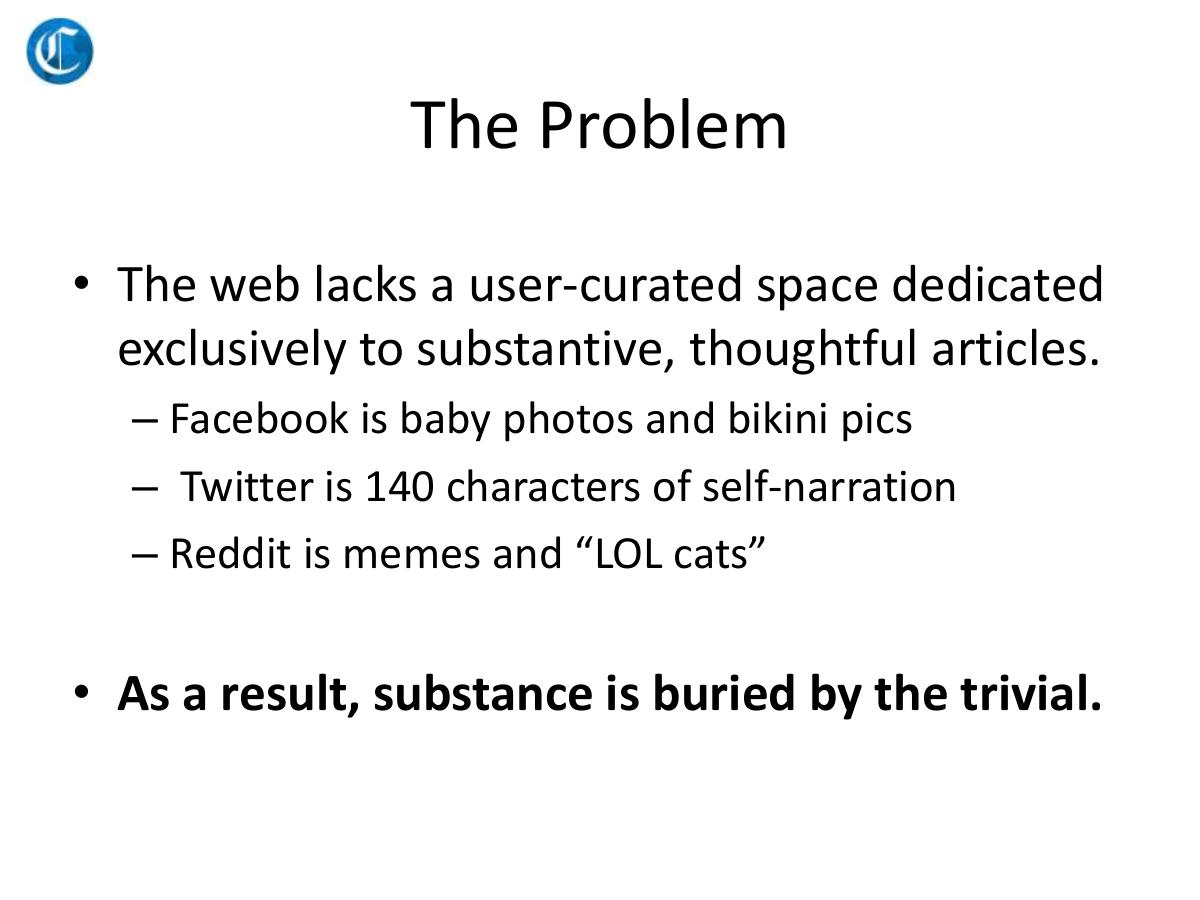
A curated space for long-form articles. A weaker example, included on purpose: jokes about other platforms instead of a problem.
Circulate deck, slide 3. Exact stored slide matched to this analysis.
Our analysis: It is a statement of taste. It never says who wants substantive articles, how many of them there are, or what they use today.
Evidence and limitation: No figures or sources.
What a founder can adapt: Replace the jokes with who reads long-form today, where they find it, and what they miss.
Supporting analysis
What the deck claims: "The web lacks a user-curated space dedicated exclusively to substantive, thoughtful articles." "Facebook is baby photos and bikini pics." "Twitter is 140 characters of self-narration." "Reddit is memes and 'LOL cats'." "As a result, substance is buried by the trivial."
Presentation choice: It shows the minimum a media problem slide needs: a named audience, a measure and today's alternative.
When it does not fit: Don't mock large platforms; investors use them, and it names no customer.
Whose problem each slide describes, whether it measures the loss, and whether it names what those people use today.
Example
Whose problem
Measured
Today's alternative
The Hustle
Readers (millennials)
Yes (28%, 29%, Nielsen)
Yes (WSJ, Bloomberg, CNBC)
Audoo
Artists
Yes ($2.7bn a year)
Yes (PRO estimates)
Lollipop Audio
Game studios
Partly (20% of the job)
Yes (linear recording tools)
ZewindTV
Viewers, linked to churn
Yes (51%, 91%)
No
Next
Listeners
No
Yes (Pandora, YouTube, shows)
Restream
Creators
No
Yes (platform logos)
Music Coco
Labels and musicians
No
Partly (instinct)
Circulate
Unclear
No
No
Key Takeaways
Choose one side. Media businesses serve audiences, creators and payers (advertisers, studios, labels); say which one's problem this is.
Measure attention or money: share of an audience, minutes lost, royalties missed, cost per production.
Name what they use today: the legacy outlet, the tool, the platform or the manual process.
Complaining about big platforms is not a problem statement; say what a specific group cannot do there.
One quote from a real listener, viewer or creator beats a list of rhetorical questions.
Build your media startup problem slide
One side, one measure, one current alternative.
Whose problem. Is this the audience's, the creator's, or the payer's (advertiser, studio, label, platform) problem? Who pays for the fix?
Measure. How much attention or money is lost: share of audience, minutes, churn, royalties, cost per production? What is your source?
Today's alternative. What do they use today (outlet, platform, tool, manual process) and where exactly does it fail?
Link to the payer. If the pain is the audience's, which number does it hurt for the business that pays?
Copyable framework: [Group] lose [measure, source] because [current alternative] [specific failure], which costs [payer] [metric].
Illustrative example 1 — written by us
Before: Online content is shallow and people want something better.
After: Readers aged 25–34 who subscribe to long-form newsletters open about 40% of issues and say they cannot find more, because feeds rank by engagement, which costs publishers paying subscribers.
What improved: Our illustrative rewrite; the figures are invented for the example. It names an audience, a measure, today's alternative and the payer's cost.
What this guide adds
The general problem slide guide covers any business, and the consumer problem guide covers consumer apps. Media differs in one way investors look for: the people who consume the content, the people who make it and the people who pay for it are often three different groups. A problem slide that describes viewers' frustration while the business earns from advertisers leaves investors to guess who pays for the fix.
Media decks also lean on taste arguments ("content today is trivial"). This guide contrasts those with slides that measure lost attention or money.
Three things a media problem slide proves
Whose problem: readers (The Hustle), listeners (Next), viewers (ZewindTV), creators (Restream), artists (Audoo) or studios and labels (Lollipop Audio, Music Coco).
How big: an audience share, a share of users, or money lost (The Hustle, ZewindTV, Audoo, Lollipop Audio).
What they use today: legacy outlets, Pandora and YouTube, linear recording tools, performing right organisations (The Hustle, Next, Lollipop Audio, Audoo).
Common mistakes
Taste instead of a problem. "Content is trivial" is an opinion; show who is underserved and by how much.
Audience pain, payer silent. If advertisers or platforms pay, connect the viewer's frustration to their metric.
Mocking big platforms. Jokes about Facebook or YouTube name no customer.
Too many questions. A list of creator questions dilutes the one you solve.
Unsourced audience statistics. Audience figures are easy to check; cite Nielsen, Edison or your own data.
Diagnostic checklist
It is clear whose problem this is and who pays.
The loss is measured in attention or money.
Today's alternative is named.
Audience pain is linked to the payer's metric.
Every figure has a source.
Frequently asked questions
How we chose these examples
Corpus: published pitch deck teardowns on StartupFundraising.com. Founder-uploaded private decks are excluded.
Selection (2026-09-25): we searched extracted text of slides 2–6 for problem and challenge slides in decks whose recorded sector is media, publishing, news, content, entertainment, music, video, podcasting, film or streaming. About forty candidates were listed and twelve stored images inspected. Avataros's problem slide was set aside because the image is marked "Confidential". YouTube's problem slide was set aside because it already appears in the general problem guide. Echome, Podvertise.fm, The Untz and Story Plant Media were set aside as weaker than those chosen. Circulate is kept as a weaker contrast.
Overlap check: none of these eight slides appears in another guide.
Review: all eight stored slide images were inspected on 2026-09-25 and matched to company, deck and slide number (editorial model review). No person has yet completed an editorial review of this page.
Claims are as shown on the slides; we have not verified them. We make no claim that any slide caused a fundraising outcome.