How education startups describe the problem in a pitch deck: name who has it (learner, parent, teacher or school), show a sourced outcome gap.
Edtech Problem Slide: Real Pitch Deck Examples
Eight problem slides from education startups, shown in full, compare how each names who has the problem, backs it with a learning or career outcome, and makes clear who would pay to fix it.
TL;DR
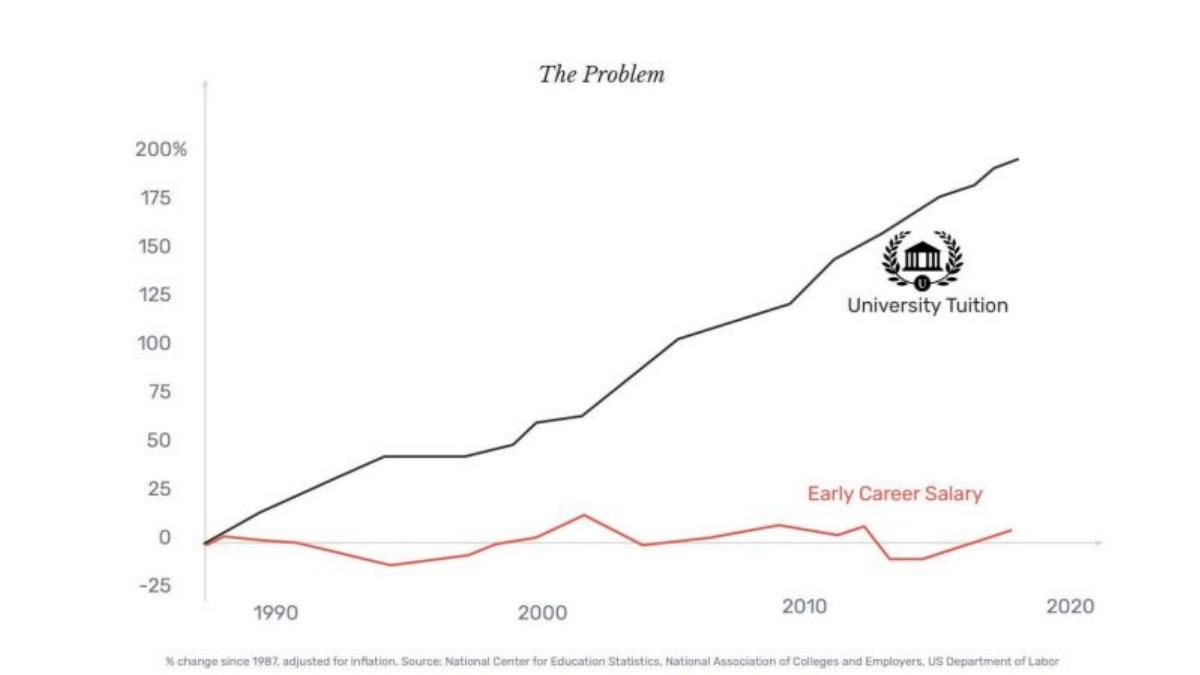
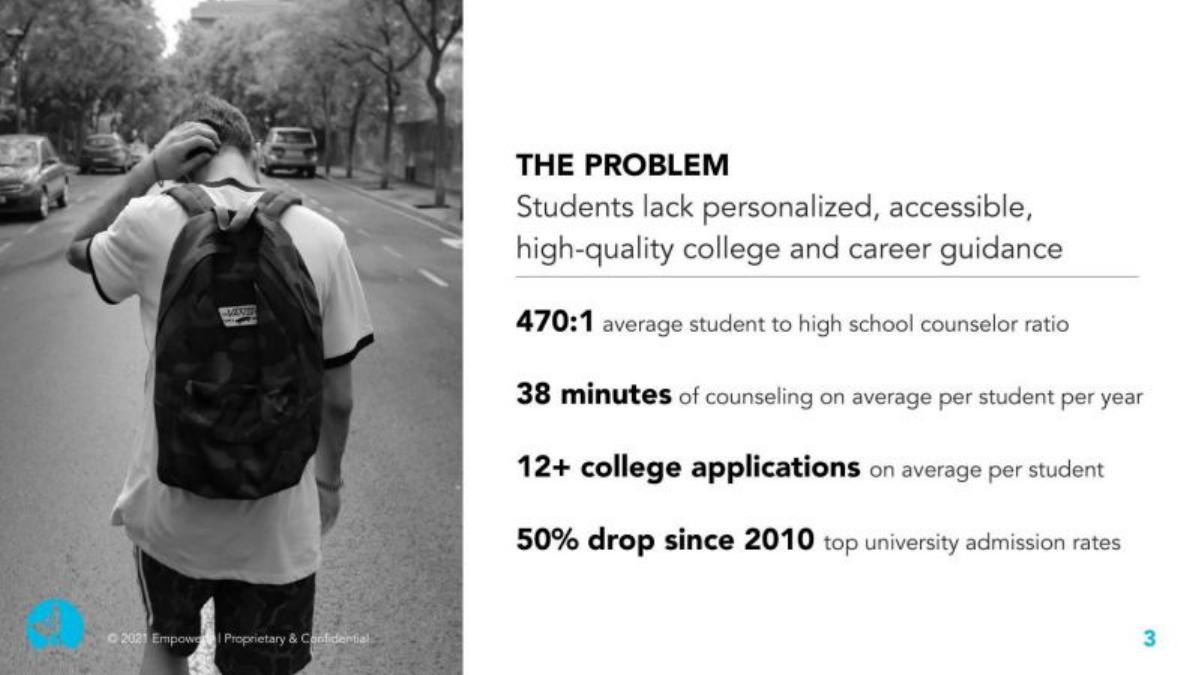
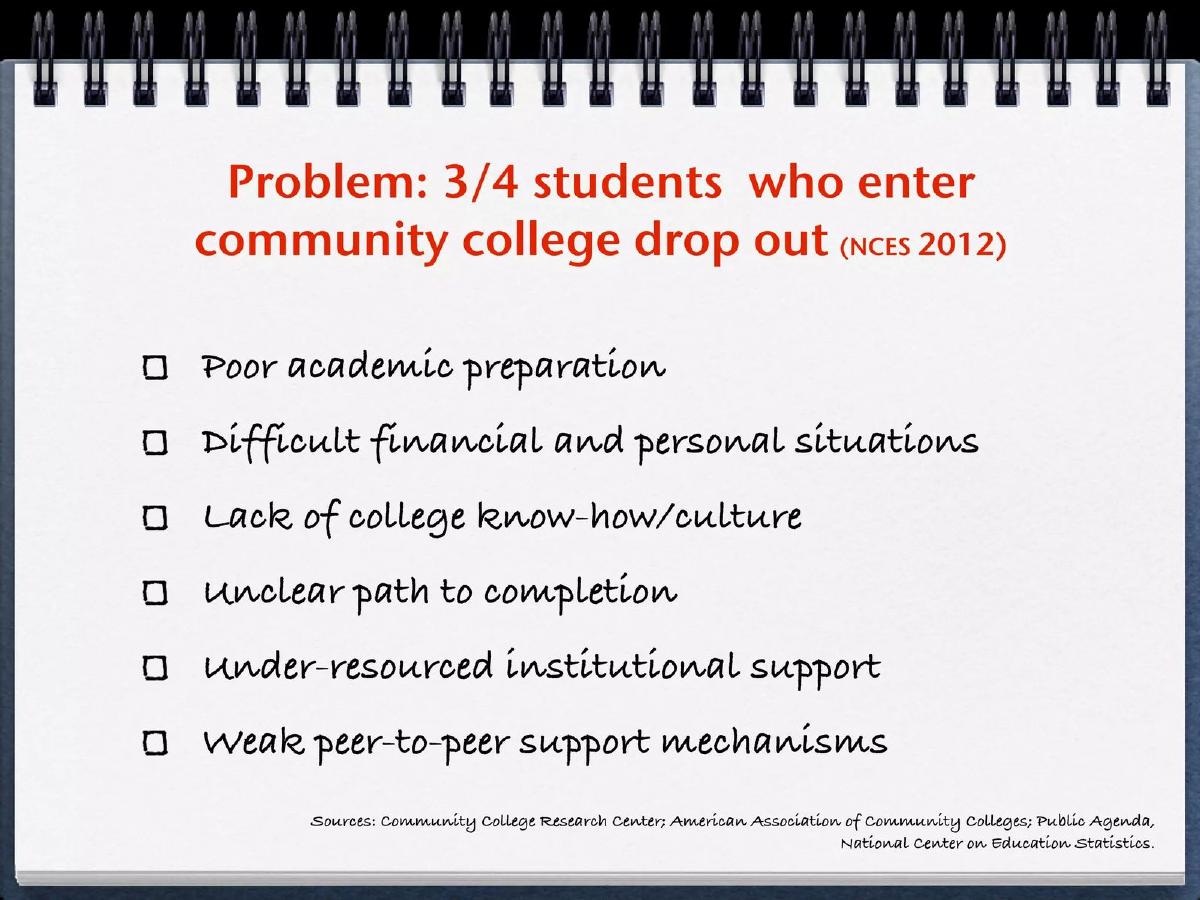
An edtech problem slide should name who has the problem, show a sourced gap in outcomes, and make clear who pays, because in education the learner, the parent, the teacher and the school are often different people. Lambda School charts university tuition against early-career salary since 1987 and names its sources under the chart. Empowerly gives the scale of the gap in four numbers, starting with a "470:1 average student to high school counselor ratio." GradGears cites its headline: "3/4 students who enter community college drop out (NCES 2012)." Grandomastery lists complaints about textbooks, such as "characterless stock photographs", without saying who suffers or what it costs.
Edtech problem slides from real pitch decks
Each example shows the exact stored slide above its analysis and links to the full teardown. Figures are as shown on the slides; we have not verified them.
Lambda School problem slide — slide 6
Online coding school paid from graduates' future income. One line chart, no bullets.
Lambda School deck, slide 6. Exact stored slide matched to this analysis.
Our analysis: The problem is the gap between what education costs and what it pays, shown in one picture.
Evidence and limitation: Inflation-adjusted change over three decades, with three named sources.
What a founder can adapt: If your problem is an outcome that has worsened over time, draw it as one chart with sources underneath.
Supporting analysis
What the deck claims: "The Problem." Two lines from 1987 to about 2019: "University Tuition" rising to nearly 200%, "Early Career Salary" staying close to 0. Footnote: "% change since 1987, adjusted for inflation. Source: National Center for Education Statistics, National Association of Colleges and Employers, US Department of Labor."
Presentation choice: The widening gap is read in a second, and the sources answer the first question before it is asked.
When it does not fit: Say who feels the gap (a student deciding whether to enrol), and make the source line large enough to read.
College and career counselling. A student photo and four large numbers.
Empowerly deck, slide 3. Exact stored slide matched to this analysis.
Our analysis: Two numbers show the supply of help (470:1, 38 minutes) and two show rising demand (12 applications, halved admission rates).
Evidence and limitation: Four figures on scale and trend; no sources on the slide.
What a founder can adapt: Pair a supply number with a demand number so the gap is obvious.
Supporting analysis
What the deck claims: "Students lack personalized, accessible, high-quality college and career guidance." "470:1 average student to high school counselor ratio." "38 minutes of counseling on average per student per year." "12+ college applications on average per student." "50% drop since 2010 top university admission rates."
Presentation choice: "38 minutes per year" makes the shortage personal: that is all the help one student gets.
When it does not fit: Cite the four figures, and say whether families or schools pay.
Support for community college students. One cited headline and six causes.
GradGears deck, slide 2. Exact stored slide matched to this analysis.
Our analysis: The headline is an outcome with a source; the list explains why it happens.
Evidence and limitation: A sourced completion figure and named sources for the causes.
What a founder can adapt: Lead with one sourced outcome, then list causes, marking the ones you address.
Supporting analysis
What the deck claims: "Problem: 3/4 students who enter community college drop out (NCES 2012)." Causes: "Poor academic preparation; Difficult financial and personal situations; Lack of college know-how/culture; Unclear path to completion; Under-resourced institutional support; Weak peer-to-peer support mechanisms." Sources: "Community College Research Center; American Association of Community Colleges; Public Agenda; National Center on Education Statistics."
Presentation choice: A dropout rate is the outcome both students and colleges care about, so it works for either buyer.
When it does not fit: Six causes is too many; highlight the two your product fixes, and update a 2012 figure if newer data exists.
Laoshi deck, slide 2. Exact stored slide matched to this analysis.
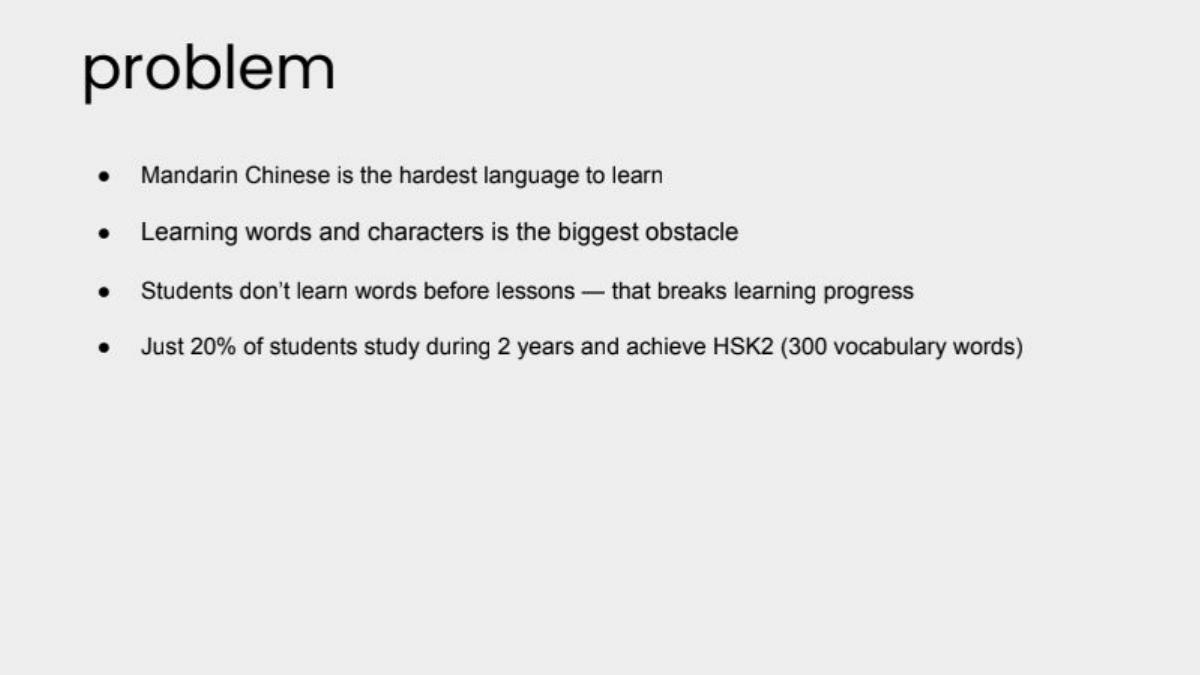
Our analysis: It narrows from the subject to one obstacle (vocabulary) to one behaviour (not preparing before lessons).
Evidence and limitation: One progress figure tied to a recognised test level (HSK2); no source.
What a founder can adapt: Express the outcome against a benchmark your audience knows: a test level, grade or certification.
Supporting analysis
What the deck claims: "Mandarin Chinese is the hardest language to learn." "Learning words and characters is the biggest obstacle." "Students don't learn words before lessons — that breaks learning progress." "Just 20% of students study during 2 years and achieve HSK2 (300 vocabulary words)."
Presentation choice: Tying the outcome to a standard level (HSK2, 300 words) makes "slow progress" measurable.
When it does not fit: Source the 20% figure, and replace "hardest language" with the time it takes to reach a level.
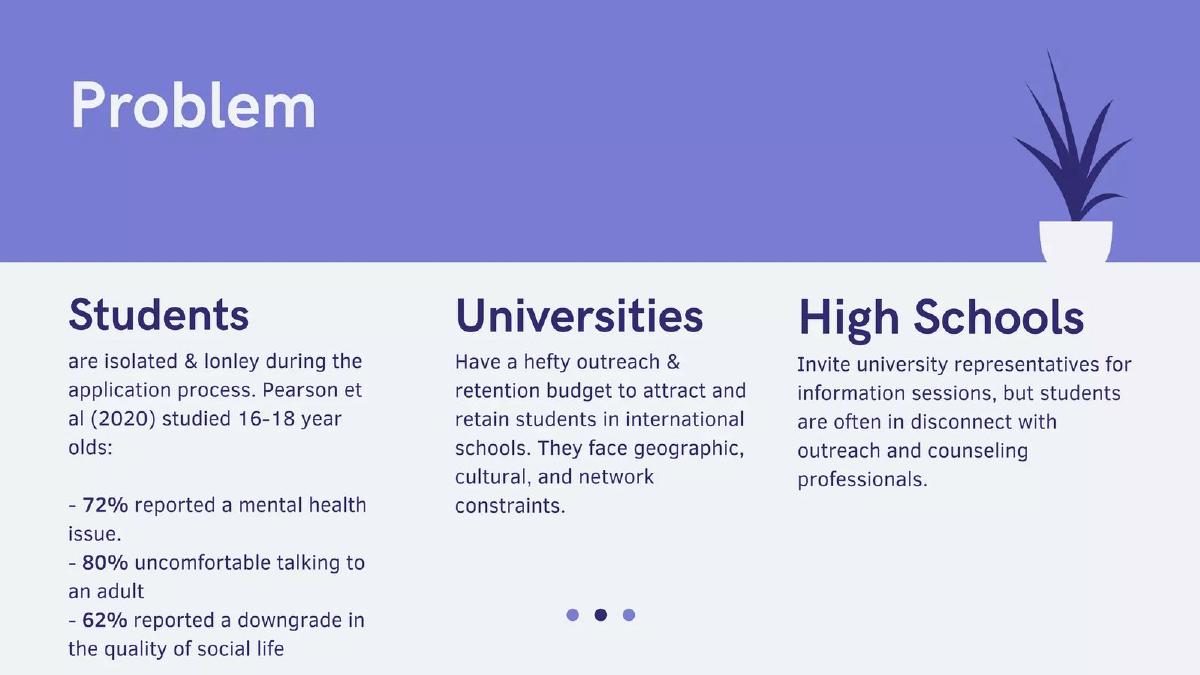
Connecting students with universities during applications. Three columns, one per party.
Fireside deck, slide 3. Exact stored slide matched to this analysis.
Our analysis: It separates the person who suffers (students) from the one with a budget (universities).
Evidence and limitation: A cited study for the student column; no figures for universities or schools.
What a founder can adapt: If the user and payer differ, give each a column and say what each loses.
Supporting analysis
What the deck claims: "Students are isolated & lonley during the application process. Pearson et al (2020) studied 16-18 year olds: 72% reported a mental health issue; 80% uncomfortable talking to an adult; 62% reported a downgrade in the quality of social life." "Universities have a hefty outreach & retention budget to attract and retain students in international schools. They face geographic, cultural, and network constraints." "High Schools invite university representatives for information sessions, but students are often in disconnect with outreach and counseling professionals."
Presentation choice: Naming the payer's existing budget tells the investor who writes the cheque.
When it does not fit: Put a number on the universities' outreach budget, and fix the typo in "lonley".
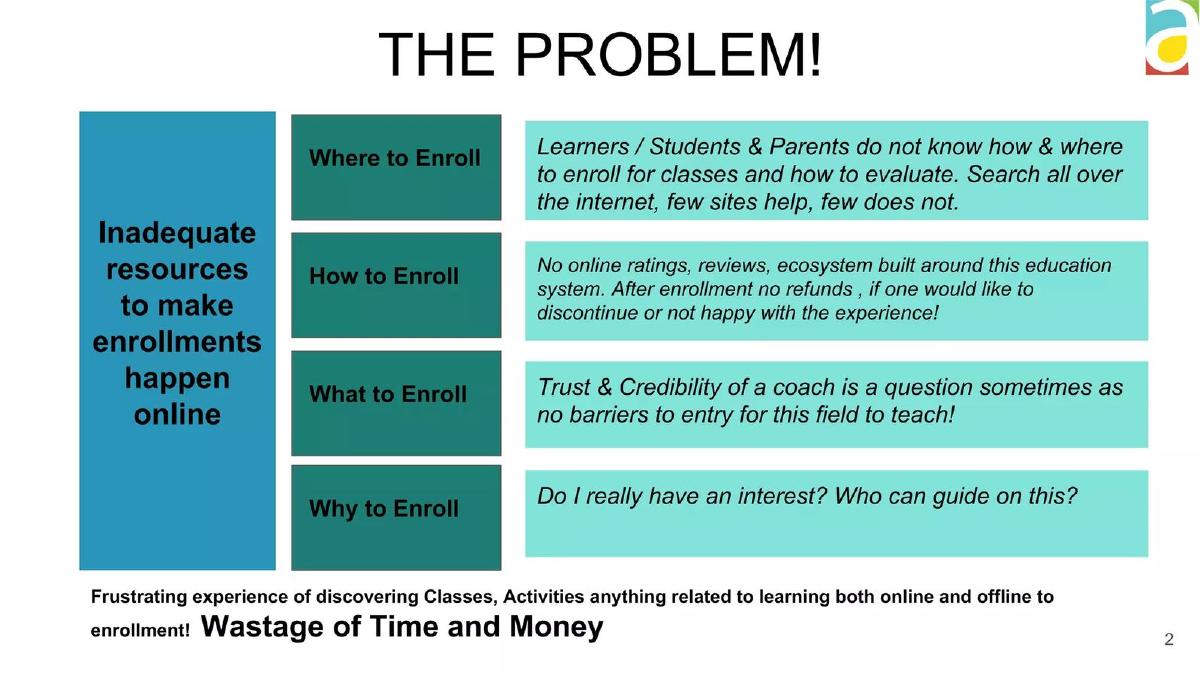
Finding and booking classes. Four questions a parent or learner asks.
Book My Activity deck, slide 2. Exact stored slide matched to this analysis.
Our analysis: The four questions follow a parent's decision in order, from finding a class to judging whether it's worth it.
Evidence and limitation: No figures.
What a founder can adapt: Frame the problem as the questions your user asks, in the order they ask them.
Supporting analysis
What the deck claims: "Inadequate resources to make enrollments happen online." "Where to Enroll: Learners / Students & Parents do not know how & where to enroll for classes and how to evaluate. Search all over the internet, few sites help, few does not." "How to Enroll: No online ratings, reviews… After enrollment no refunds." "What to Enroll: Trust & Credibility of a coach is a question sometimes as no barriers to entry for this field to teach!" "Why to Enroll: Do I really have an interest? Who can guide on this?" "Frustrating experience of discovering Classes… Wastage of Time and Money."
Presentation choice: "No refunds" and "no barriers to entry to teach" are specific worries a parent recognises.
When it does not fit: Put a number on "wastage of time and money", and cut the text in each box to one line.
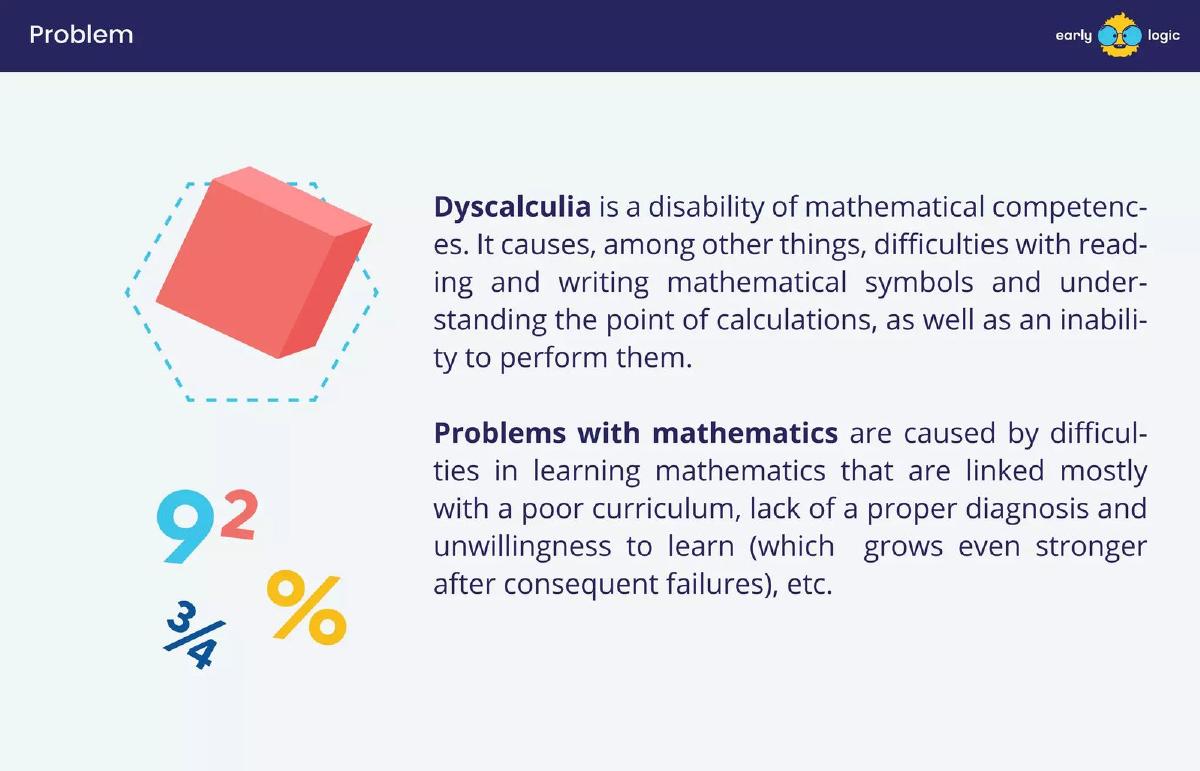
Maths support for children with dyscalculia. Two paragraphs of definition.
Early Logic deck, slide 5. Exact stored slide matched to this analysis.
Our analysis: It names a specific condition and a cycle (failure makes children less willing to learn).
Evidence and limitation: A definition and causes; no prevalence or outcome figures.
What a founder can adapt: If your learners share a specific condition or level, name it.
Supporting analysis
What the deck claims: "Dyscalculia is a disability of mathematical competences. It causes, among other things, difficulties with reading and writing mathematical symbols and understanding the point of calculations, as well as an inability to perform them." "Problems with mathematics are caused by difficulties in learning mathematics that are linked mostly with a poor curriculum, lack of a proper diagnosis and unwillingness to learn (which grows even stronger after consequent failures), etc."
Presentation choice: A named, diagnosable condition gives a clearer customer than "students who struggle with maths".
When it does not fit: Add how many children are affected and what goes undiagnosed; a definition alone doesn't size the problem.
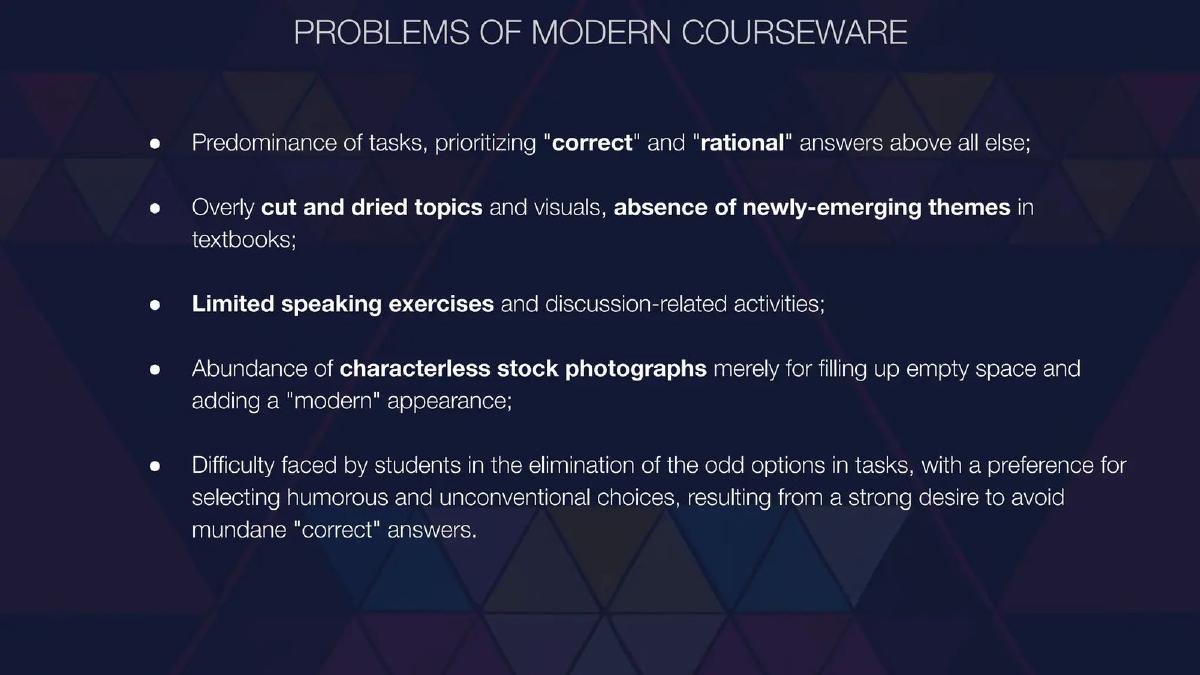
Language-learning courseware. A weaker example, included on purpose: the first of four slides of complaints about textbooks.
Grandomastery deck, slide 2. Exact stored slide matched to this analysis.
Our analysis: These are a designer's criticisms of textbooks, not a learner's or teacher's measurable loss.
Evidence and limitation: No figures, sources or named users. The deck spends slides 2 to 5 on similar lists.
What a founder can adapt: Pick the one criticism that affects results (limited speaking practice) and show its effect on speaking scores.
Supporting analysis
What the deck claims: "Problems of modern courseware." "Predominance of tasks, prioritizing 'correct' and 'rational' answers above all else; Overly cut and dried topics and visuals, absence of newly-emerging themes in textbooks; Limited speaking exercises and discussion-related activities; Abundance of characterless stock photographs merely for filling up empty space and adding a 'modern' appearance; Difficulty faced by students in the elimination of the odd options in tasks…"
Presentation choice: It shows how content complaints read as taste unless they are tied to who suffers and what outcome slips.
When it does not fit: Collapse four slides of lists into one slide with one user and one outcome.
Whether each slide names who has the problem, shows a sourced outcome gap, and makes the payer clear.
Example
Who has it
Sourced outcome gap
Payer clear
Lambda School
Implied (students)
Yes (tuition vs salary, three sources)
No
Empowerly
Yes (students)
Figures, unsourced
No
GradGears
Yes (community college students)
Yes (dropout, NCES 2012)
No
Laoshi
Yes (Mandarin students)
Figure, unsourced (HSK2)
No
Fireside
Yes (students, universities, schools)
Partly (student study cited)
Yes (university budgets)
Book My Activity
Yes (learners and parents)
No
Implied (parents)
Early Logic
Yes (children with dyscalculia)
No
No
Grandomastery
No
No
No
Key Takeaways
Name one person with the problem: learner, parent, teacher or school administrator.
Show an outcome gap (completion, grades, salary, time to fluency), and source it.
Make clear who pays; if it isn't the learner, say so on the slide.
One chart that shows the gap growing beats a list of symptoms.
Complaints about content quality are opinions until you tie them to an outcome.
Build your edtech problem slide
One line per part, with a source for every number.
Learner. Who is learning, at what level or stage?
Outcome. Which measured result is going wrong (completion, grades, test level, earnings)? Source?
Cause. Which one cause does your product address?
Payer. Who pays to fix it: the learner, a parent, a school, an employer?
Copyable framework: [Learners] [outcome gap, with source]. The main cause is [cause]. [Payer] already spends [budget] trying to fix it.
Illustrative example 1 — written by us
Before: Education is broken and students everywhere are struggling.
After: Only 4 in 10 first-year nursing students pass anatomy on the first attempt (state board data, 2025). Most fail on memorisation of terms. Nursing schools already spend about $120 per student a year on tutoring that students rarely use.
What improved: Our illustrative rewrite; figures are invented for the example. It names a learner, a sourced outcome, one cause and a payer with a budget.
What this guide adds
The general problem slide guide covers describing customer pain in any business. Education adds a twist: the person who learns is often not the person who pays, and the result shows up months or years later in grades, completion or earnings. This guide compares how edtech decks handle both.
None of these eight slides appears in another guide. Empowerly's technology slide (slide 5) is in the technology slide guide; its problem slide here is a different slide.
Three parts of an edtech problem
Who: the learner, parent, teacher or institution (Fireside, Book My Activity).
Outcome gap: a measured result that is going wrong, with a source (Lambda School, GradGears, Empowerly).
Payer: who would fund the fix, stated or clearly implied (Fireside, Empowerly).
Strong slides cover all three. Most real slides cover one or two.
Common mistakes
"Education is broken". Name one learner and one outcome instead.
Unsourced statistics. Every rate or ratio needs a source on the slide.
Payer left out. If schools or employers pay, say so.
Content criticism without outcomes. Tie complaints about materials to a measured result.
Many slides of problems. One slide, one learner, one gap.
Diagnostic checklist
The slide names one learner or user group.
It shows a measured outcome gap.
Every number has a source.
It says who pays to fix the problem.
Your product does not appear until the next slide.
Frequently asked questions
How we chose these examples
Corpus: published pitch deck teardowns on StartupFundraising.com. Founder-uploaded private decks are excluded.
Selection (2026-09-25): we searched extracted text of slides 2–6 for slides beginning with "problem" or "pain" in decks whose recorded sector is edtech, education or learning, or whose slide text mentions students, teachers, schools, learning or tutors. About forty candidates were read; hiring, marketplace, student-loan and non-education slides were set aside, as were slides with near-identical duplicates. Grandomastery is kept as a weaker contrast.
Overlap check: none of these eight slides appears in another guide. Empowerly's slide 5 appears in the technology slide guide; its slide 3 is used here.
Review: all eight stored slide images were inspected on 2026-09-25 and matched to company, deck and slide number (editorial model review). No person has yet completed an editorial review of this page.
Figures are as shown on the slides; we have not verified them. We make no claim that any slide caused a fundraising outcome.