mWater's 9-slide deck, built in PowerPoint 2013 and dated 11 February 2015, pitches mobile data infrastructure for safe drinking water — 'Yelp for water' — with an unusually strong evidence base: USAID funding, the technical back-end for three of the world's biggest water NGOs, eleven institutional logos, $380,000 of 2014 revenue and six hyperlinked press placements. None of it is converted into an investment case. There is no ask: no amount, no instrument, no valuation, no use of funds and no close date, and the closing slide gates the financials behind 'For financials, please contact:'. The…
Key takeaways
- mWater's 9-slide February 2015 deck contains no ask of any kind — no amount, no instrument, no valuation, no use of funds and no close date — and instead ends slide 2 with the sentence 'Please invest in our dream.'
- The financials are deliberately withheld: the closing slide reads 'For financials, please contact:', gating the numbers behind an email from a reader the deck has not yet convinced.
- The traction slide contradicts itself — the chart tops out at '2000+ users' while the timeline bar beneath it claims '3000 organization users' for the same period.
- Revenue is projected to grow from $380k in 2014 to $1.5M in 2015 — 295%, or $1.12M of net new revenue — with no pricing, no pipeline, no named prospect and no commercial hire on the team slide.
- The '100k local users' 2015 target describes the free public side of the platform, not the NGOs and government agencies that actually pay, yet it sits on the same slide and the same growth arrow as the revenue projection.
- The $21bn market figure is properly sourced to UN Water GLAAS 2014 but measures aid spending on water supply construction, not the monitoring software mWater sells; the deck never deflates it to a serviceable market.
- Slide 5 uses 'Profitable' as a header over a list of customer types, with no margin, cost base or net figure anywhere in the deck — and describes the World Bank as an investment bank.
- The strongest fact in the file — that mWater's data changed Mwanza City policy to mandate safer water sources — is written as a photo caption on slide 4, while a celebrity parenthetical, '(Matt Damon's water org)', is given equal weight.
What this deck actually is
Nine slides, 720 x 540 points — the old 4:3 aspect ratio, not widescreen — built in Microsoft PowerPoint 2013 and printed to PDF on 11 February 2015 . The file is 499 KB. It is an investor deck for mWater , a New York-based social enterprise building mobile data infrastructure for safe drinking water in low-income countries, led by CEO Dr. Annie Feighery .
Almost everything hard about this company is real and verifiable. USAID funds the Tanzania deployment. mWater runs the technical back-end for three of the world's largest water NGOs, Water.org among them. Eleven institutional logos appear on the traction slide — WaterAid, the World Bank, CARE, USAID, WSUP, EarthEcho. 2014 revenue was $380,000. Six named press placements are hyperlinked on the closing slide, including NASA Spinoffs and Bloomberg Business Week. The three founders hold a Columbia doctorate in health and behavioural science, a Columbia PhD in environmental engineering with NASA and UNICEF experience, and a computer science degree with twenty years of database and computer-vision work.
That is a stronger evidence base than most seed decks ever assemble. And the deck spends nine slides declining to convert it into an investment case. There is no ask. No amount, no instrument, no valuation, no use of funds, no close date. There is no competition slide, no pricing, no unit economics, no cost base, no cap table and no runway figure. The financials are not weak — they are deliberately withheld , behind a line on the last slide that reads "For financials, please contact:".
And in place of the ask, slide 2 ends with the sentence: " Please invest in our dream. "
Slide 2 asks for money without naming a number
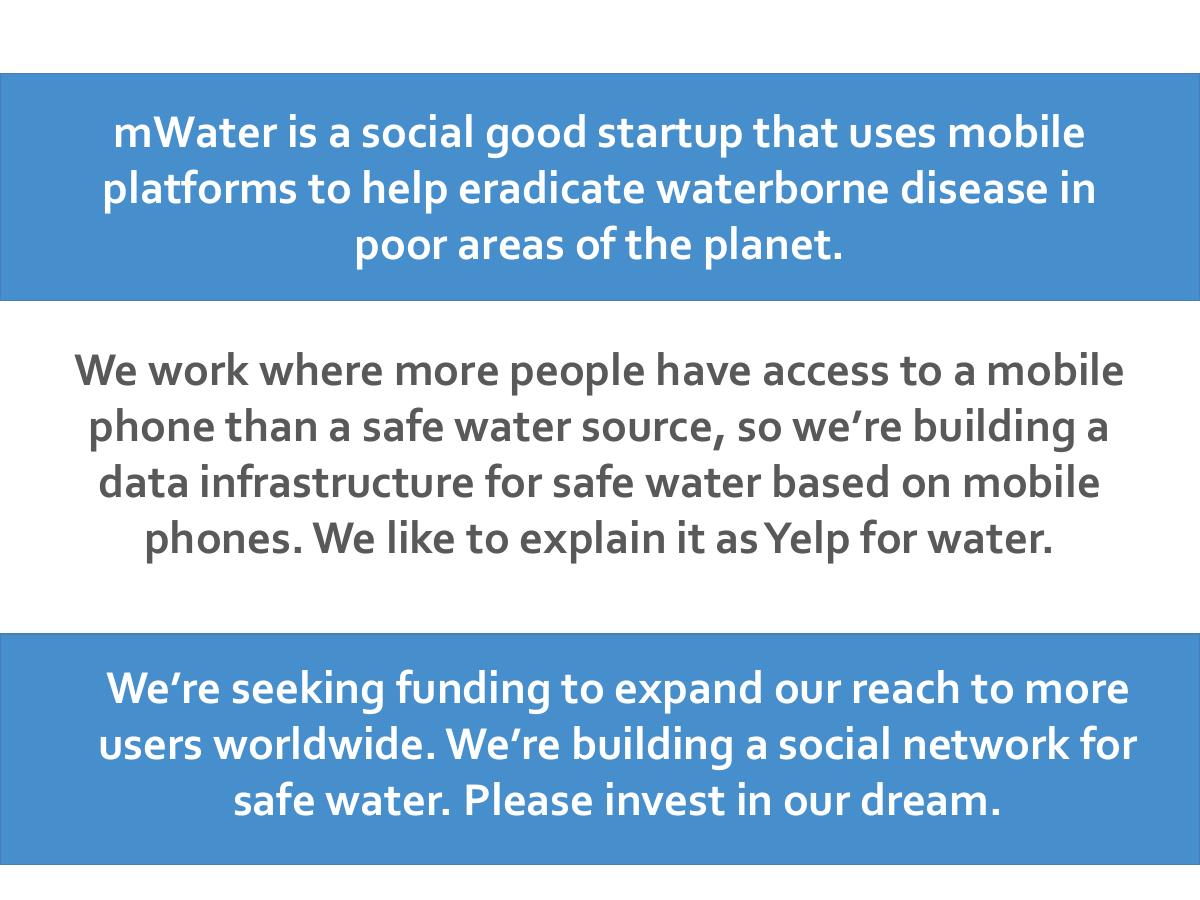
The second slide is three stacked text blocks and no image. The top block defines the company, the middle block explains the insight, the bottom block — reversed out in blue, the deck's emphasis treatment — makes the request:
"We're seeking funding to expand our reach to more users worldwide. We're building a social network for safe water. Please invest in our dream."
Three things are wrong with that paragraph, and they compound.
First, "funding" is not an ask. An ask has four parts: how much, on what terms, what it buys, and by when. This has none of them, and no later slide supplies them. A reader who wants to act on this deck cannot act, because there is nothing to say yes or no to. The deck's own closing slide confirms the omission is a policy rather than an oversight — financials are available on request, which means the founders decided the number belongs in a conversation rather than in the document. That decision costs them every reader who was never going to book the conversation, which is most readers.
Second, "expand our reach to more users worldwide" is not a use of funds. It is a direction, not a plan. Which users, in which countries, acquired how, at what cost per user, producing what revenue? mWater already has revenue and a named 2015 target; the money should be attached to the gap between them. It is not attached to anything.
Third, " Please invest in our dream " transfers the deck from a commercial register into a charitable one, on the one slide where the commercial register matters most. mWater's own middle block on the same slide describes a data infrastructure business with paying institutional customers. Its traction slide reports $380,000 of revenue. This is a company with a P&L asking to be evaluated as a cause. Impact investors do not need to be asked for their sympathy — they already have it, or they would not have opened the file. What they need is the number.
The Yelp analogy fights the business model
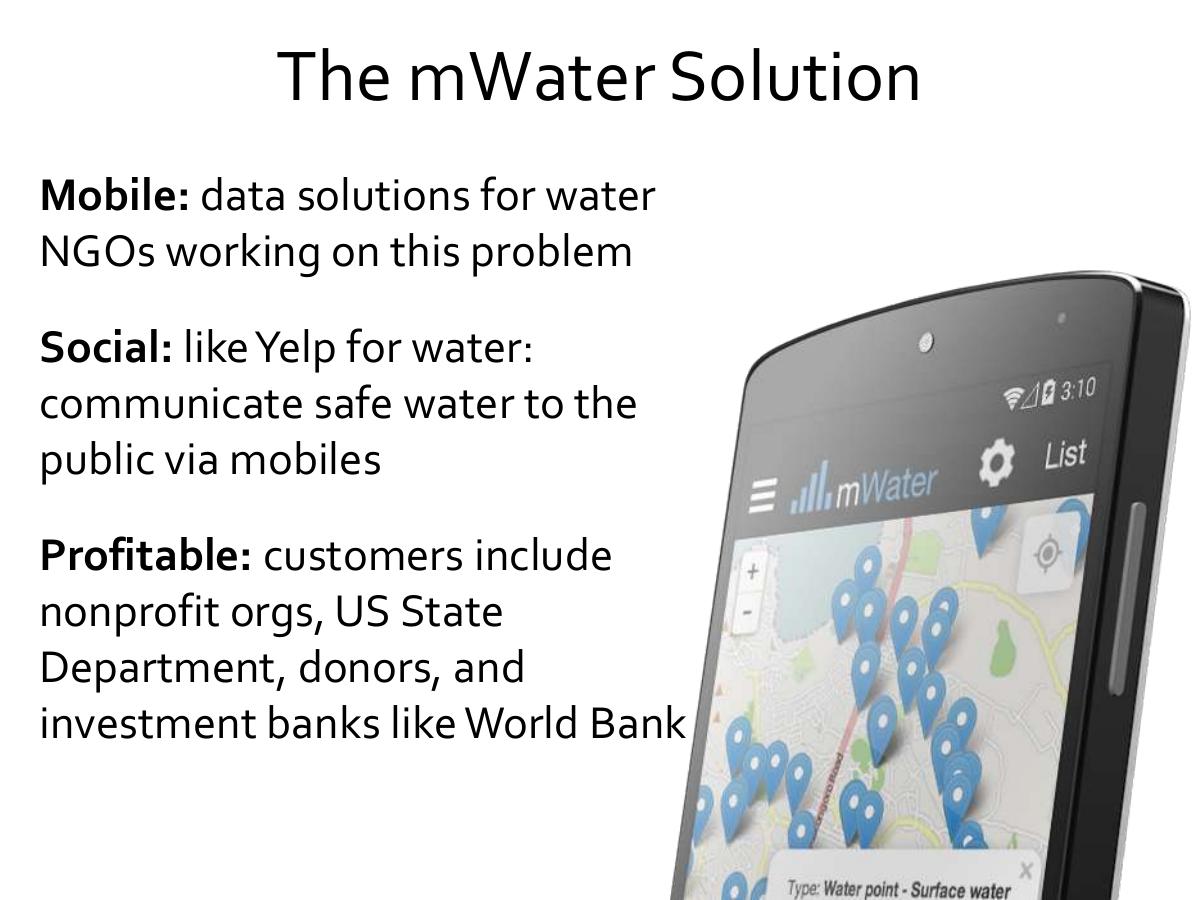
The deck's central framing device appears twice: " We like to explain it as Yelp for water " on slide 2, and " Social: like Yelp for water " on slide 5. It is a good analogy for the product — a public, crowd-contributed map of which water points are safe — and a bad one for the business, because the deck never reconciles the two.
Yelp is a consumer business monetised through advertising sold to the merchants being reviewed. mWater is an institutional business monetised, per slide 5, through " nonprofit orgs, US State Department, donors, and investment banks like World Bank ". Those two models have nothing in common. Yelp's users are its inventory; mWater's public users are a cost centre subsidised by NGO data contracts. Invoking Yelp invites the reader to imagine network effects and advertising revenue that this company neither has nor wants — and then the deck moves on without correcting the impression.
There is also a factual slip in the same sentence. The World Bank is not an investment bank. It is a multilateral development institution. Listing it as one, in a deck aimed at finance professionals, is the kind of small error that makes a reader wonder what else was written from memory.
The word doing the most unearned work on slide 5, though, is the third header: " Profitable: ". What follows it is not a profitability claim — it is a list of customer types. There is no margin, no cost line and no net figure anywhere in the deck to support the word. On $380,000 of 2014 revenue across 8 employees globally , revenue per head is roughly $47,500 , which is below a fully loaded cost per head in almost any market that includes New York. The likeliest reading is that mWater meant "revenue-generating, unlike most social ventures" — a genuinely differentiating claim — and reached for a stronger word than the evidence supports. If an investor tests "profitable" and it does not hold, every other adjective in the deck is retested too.
Two growth numbers on one slide, describing different customers
Slide 8 is the traction slide and it carries five separate quantitative claims. Read individually, each is encouraging. Read together, they do not describe the same company.
2014 revenue: $380k · 2015 projection: $1.5M · A chart labelled "2000+ users" and "20000+ water points" , running July 2013 to late 2014 · A timeline bar reading "3000 organization users (.edu & NGOs)" across 2013–2014 · An arrow into 2015 reading "100k local users"
Start with the contradiction. The chart tops out just above 2,000 users; the bar directly beneath it says 3,000 organization users. Both cover the same period. One of them is wrong, or they count different things — and the deck never says which. An investor cannot tell whether mWater has two thousand users or three thousand, on the slide whose only job is to say.
Then the projection. Revenue is forecast to go from $380,000 to $1.5 million — 295% growth, $1.12 million of net new revenue — and no slide explains where it comes from. There is no pricing model, so the reader cannot compute how many contracts that is. There is no sales hire named on the team slide, so the reader cannot see who closes them. There is no pipeline, no named prospect, no signed-but-unbilled contract, no renewal rate on the eleven existing logos. Working backwards from the deck's own figures, $380,000 spread over 3,000 organisation users is about $127 of annual revenue per organisation ; at that rate, $1.5 million requires roughly 11,800 organisation users — a four-fold increase in a single year. The deck asserts the destination and omits the vehicle.
And the "100k local users" arrow makes the gap worse rather than better, because local users are the side of the marketplace that does not pay. The revenue comes from NGOs, USAID and the State Department. The 100,000 figure describes the free public layer. Placing the paying-customer projection and the free-user projection on the same slide, in the same growth direction, invites the reader to believe one causes the other — and nothing in the deck argues that it does. If public adoption is what makes the institutional data valuable, that is the most important argument in the business, and it is missing entirely.
The chart makes two numbers look like one trend
The traction chart is a dual-axis stacked area graph. The left axis is Users, 0 to 2,500 . The right axis is Water points, 0 to 25,000 . The two axes are scaled at exactly 10:1 , and both series are plotted as filled areas sitting on top of one another in the same frame.
The visual consequence is that the two bands look like components of a single accumulating volume, when they are unrelated quantities on incompatible scales. A reader skimming at speed sees one big rising mass. What is actually being shown is that water points and users grew at a fixed ratio of roughly ten to one — which is the genuinely interesting fact on the slide, and the chart is designed in a way that hides it. Ten mapped water points per registered user is a real productivity statistic about a surveying platform, and it is nowhere in the text.
The axis choice is not deceptive in the way a truncated y-axis is deceptive; nothing is exaggerated. But it is the wrong chart. Two lines on one axis with a ratio callout would have told the truth faster, and the truth here is better than the impression.
The timeline underneath has a subtler problem: achieved milestones and future ones are drawn identically. "Incorporated" (2013), "USAID investment, launch in Tanzania" (2013) and "Survey platform launch" (2014) all happened. "Social platform launch" (2015) has not. Same dot, same weight, same typeface. So does the 100k user arrow, which is a projection rendered in the visual language of a fact. It takes a careful reader to separate what mWater has done from what it intends to do, and careful readers are rarer than the deck assumes.
The market slide sizes an industry mWater does not sell to
Slide 7 makes three claims. The first is the best-sourced statement in the entire deck: "$21 billion spent annually on aid industry for drinking water supply in developing countries" , footnoted to UN Water, Global Analysis and Assessment of Sanitation and Drinking Water (2014) — a named publication, a named body, a current year, and a hyperlink. Every other statistic in the deck, including the two mortality claims on the problem slide, carries no source at all. If one slide proves the founders know how to cite, the absence everywhere else reads as a choice.
The trouble is what the $21 billion measures. It is total aid spending on water supply — pipes, pumps, boreholes, treatment, construction. mWater does not sell water supply. It sells data and monitoring software to the organisations that spend that money. Monitoring and evaluation is a small percentage line inside a development budget, typically single digits, and software is a fraction of that again. The deck presents the outermost TAM and then never draws the two circles inside it. A serviceable market of, say, 3% of $21 billion spent on M&E, of which software is a fifth, is around $126 million — a perfectly fundable number, far more credible than $21 billion, and one the deck's own $380,000 of revenue can be honestly located within. Naming the small number would have made the big number believable. Naming only the big number makes the reader do the deflation themselves, and they always over-deflate.
The second claim — "Most smartphone growth will be in emerging markets" — sits beside a downloaded infographic titled " The smartphone world in 2014 ", in a typeface and palette that match nothing else in the file, carrying no source and no attribution . Its content also undercuts the argument it is placed there to support: the bars are dominated by China, India, the USA and Brazil, which are not the rural low-income regions where mWater's water points are mapped. Tanzania does not appear on the chart at all. Nigeria is last.
The third claim — "Current data solutions are underfunded and poorly conceived" — is the only competitive statement in the deck, and it names nobody. There is no competition slide. In 2015 the water-monitoring data space contained real, funded alternatives, and mWater's answer to all of them is one adjective pair. An investor reading "poorly conceived" with no comparison table concludes either that the founders have not surveyed the field or that they have and would rather not discuss it.
What the deck gets right, and buries
Slide 4 is the most investable page in the file and it is formatted as two captioned photographs.
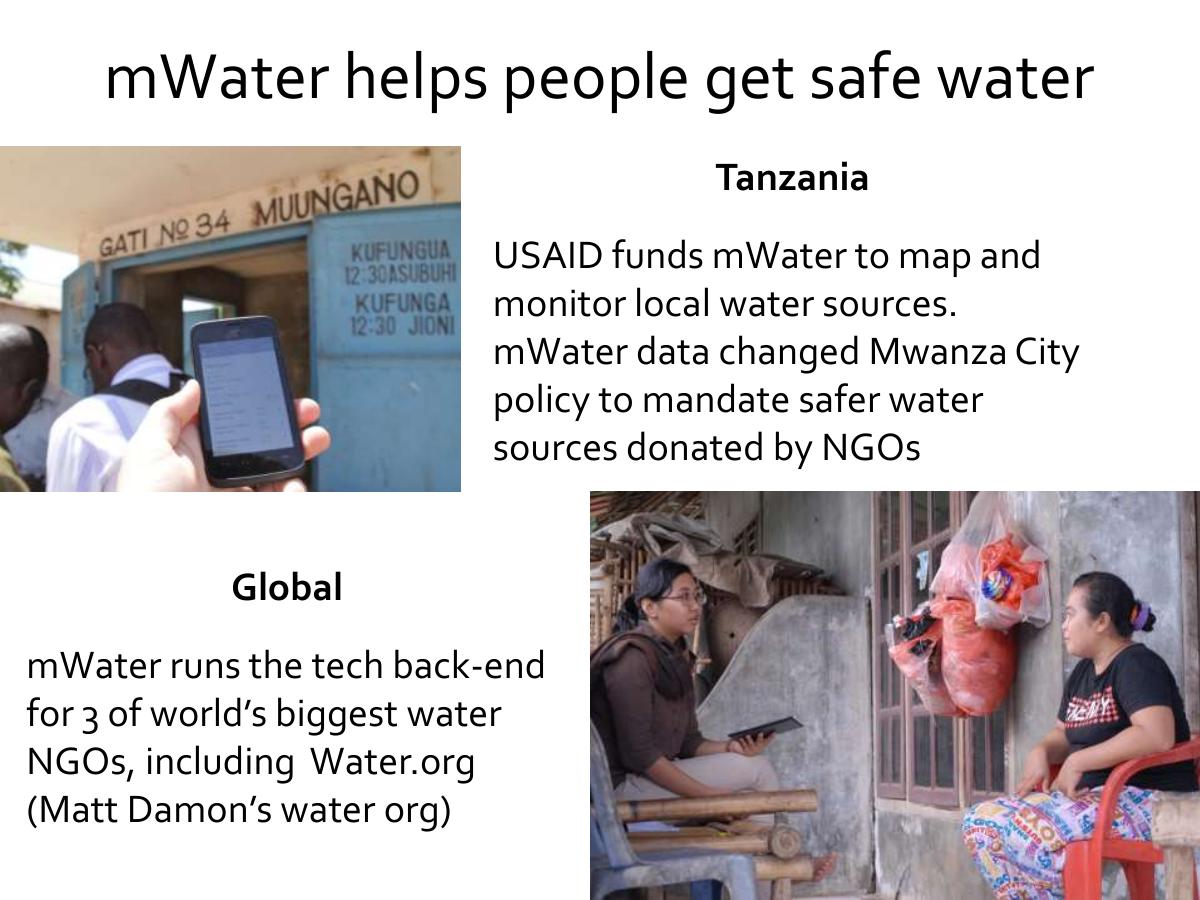
The Tanzania panel states that USAID funds mWater to map and monitor local water sources, and that mWater's data changed Mwanza City policy to mandate safer water sources donated by NGOs. That second clause is extraordinary and it is written as a subordinate sentence in a caption. A four-year-old startup produced evidence that changed municipal regulation in a city of several hundred thousand people. That is the proof that the product creates consequences rather than dashboards — the single hardest thing for a data company to demonstrate — and it is given the same visual weight as a stock photo.
The Global panel states that mWater runs the tech back-end for three of the world's biggest water NGOs, including Water.org . That is enterprise-grade infrastructure adoption by the category's most credible buyers, and the deck immediately dilutes it with the parenthetical " (Matt Damon's water org) ". The celebrity tag is a distraction: it invites the reader to value the relationship for its glamour rather than for the fact that a major NGO chose to run its operational data on a nine-person startup's platform. Borrowed fame is a weaker asset than a signed integration, and here the deck trades down.
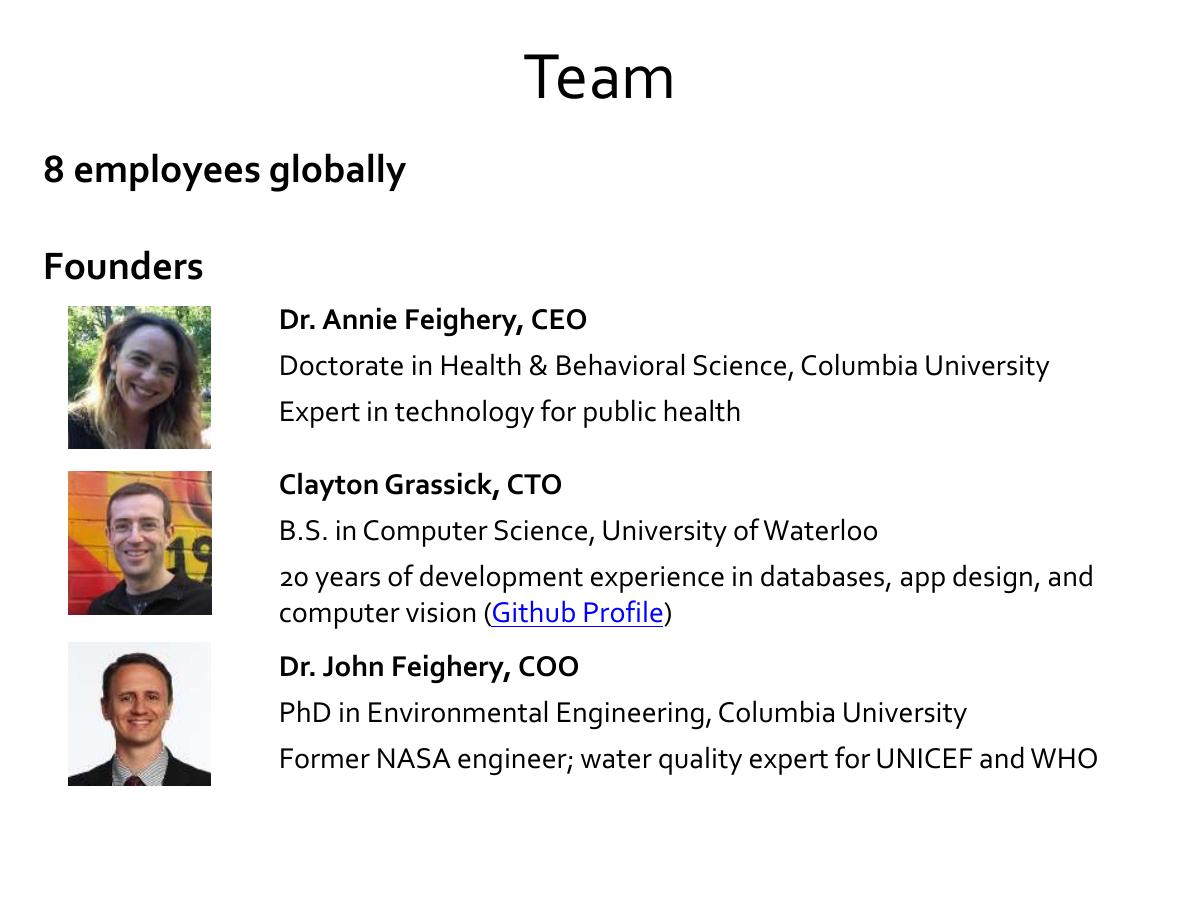
The team slide is genuinely strong and needs almost no repair. Three founders, all named, all with checkable credentials, one with a linked GitHub profile — a rare and quietly effective form of evidence in a 2015 deck. The founders are also domain-matched to a degree that is unusual: a public health doctorate, an environmental engineering PhD with UNICEF and WHO water-quality experience, and a database engineer. What is missing is anyone who sells. On a slide that supports a $1.12 million revenue increase, the absence of a commercial hire is the question the reader is left holding.
The press slide is well built — six outlets, each with the article title hyperlinked rather than a bare logo wall, which lets a reader verify in one click. Two notes. None of the items is dated, so a reader cannot tell whether the coverage is current or three years old. And one of them, the Bloomberg piece on Ebola tracking , is about a use case the deck never mentions; if mWater's platform generalised from water to outbreak surveillance during the 2014 West Africa epidemic, that is a product-expansion story worth a slide, not a stray link on the closing page.
Claim-by-claim
2014 revenue $380k Slide 8 Specific, checkable and unusually strong for a social venture — the deck's best single fact, given no supporting cost line or margin 2015 projection $1.5M Slide 8 295% growth with no pricing, no pipeline, no named prospect and no sales hire on the team slide to deliver it 2000+ users Slide 8 chart Contradicted on the same slide by the timeline bar reading "3000 organization users" for the same period 100k local users Slide 8 timeline A 2015 projection drawn in the same visual language as completed milestones — and it describes the non-paying side of the platform $21bn annual aid spend on drinking water Slide 7 Properly sourced to UN Water GLAAS 2014, but it measures water supply construction, not the monitoring software mWater actually sells "Most smartphone growth will be in emerging markets" Slide 7 Supported by an unsourced downloaded infographic whose top four bars are China, India, the USA and Brazil — not mWater's field markets "Profitable" Slide 5 Used as a header over a list of customer types; no margin, cost base or net figure appears anywhere in the deck "Investment banks like World Bank" Slide 5 The World Bank is a multilateral development institution, not an investment bank mWater data changed Mwanza City policy Slide 4 The strongest impact claim in the deck — real regulatory consequence, written as a photo caption
Tech back-end for 3 of the world's biggest water NGOs Slide 4 Verifiable enterprise adoption, diluted by the "(Matt Damon's water org)" parenthetical beside it 1.8 billion people drink contaminated water Slide 3 Broadly consistent with 2015-era WHO/UNICEF estimates, but carries no citation on a slide where the deck elsewhere proves it can cite 8 employees globally Slide 6 Stated plainly; implies roughly $47.5k of 2014 revenue per head, which the "Profitable" claim does not survive
How you would rebuild this deck
Put the ask on slide 2, in numbers. Replace "Please invest in our dream" with the amount, the instrument, the milestones it funds and the close date. If the round is $1.5 million on a SAFE to reach $3 million of ARR by end-2016, say exactly that. Every other slide exists to make that sentence credible. · Stop withholding the financials. "For financials, please contact" filters out every reader who was interested but not yet committed. Put twelve months of revenue, cost and headcount in the deck and keep the detailed model for diligence. · Bridge $380k to $1.5M explicitly. One slide: existing contracts renewing, contracts signed and not yet billed, pipeline by named account, and the new logos required. Show the average contract value. Right now the reader has to invent it. · Reconcile 2,000 and 3,000 users. Define the unit once — organisations, seats, surveyors, registered accounts — and use the same one everywhere. A contradiction inside a single slide costs more credibility than a smaller number would have. · Separate the paying side from the free side. Institutions pay; local users do not. Put them on different slides and, if public adoption makes the institutional data more valuable, argue that link explicitly — it is the most important claim the business can make and the deck never makes it. · Size the market you actually sell to. Keep the $21 billion as context, then deflate it in two steps to monitoring and evaluation, then to software. A credible $100–150 million serviceable market with $380k already captured is a better slide than an uncontested $21 billion. · Promote Mwanza to a full slide. "Our data changed a city's water policy" is a headline, not a caption. Show the before, the intervention, the regulatory outcome and the population affected, and name the customer who paid for it. · Redraw the traction chart. Two lines, one axis or clearly labelled twin axes, plus the ratio the current chart conceals — roughly ten water points mapped per user. Distinguish achieved milestones from planned ones with different weights. · Add a competition slide. Name the alternatives — including spreadsheets and paper, which is what most NGOs actually use — and state what changes when an organisation switches. "Poorly conceived" is not a competitive position. · Retire the Yelp analogy or finish it. If the public layer really is a Yelp-style network, show contribution rates, review density and repeat usage. If it is not, describe mWater as data infrastructure for institutional water programmes and let the eleven logos carry the argument. · Drop "Profitable" unless you can print the margin. "Revenue-generating since 2013, $380k in 2014, 60% gross margin" is stronger, safer and more specific than one adjective. · Name who sells. Add the commercial lead to the team slide, or state plainly that hiring one is the first use of the round.
The transferable lesson
mWater's deck fails at exactly the point where most technically excellent founders fail: it treats the evidence as the argument. USAID funding, three of the biggest water NGOs on the platform, a municipal policy change caused by its own data, $380,000 of real revenue, six press placements, three credentialed founders — laid out across nine slides as facts, in the apparent belief that a sufficiently impressive set of facts assembles itself into an investment case in the reader's head. It does not. The reader's job is to say yes or no to a specific proposition, and this deck never states one.
The second lesson is about register. A social enterprise carries a permanent temptation to be evaluated on its mission, and "Please invest in our dream" is that temptation winning. It is not a small stylistic choice; it is the sentence that occupies the position where the ask belongs, on a slide whose whole purpose is to make the ask. Mission-driven founders often fear that talking about revenue makes them look less committed. The inverse is true — mWater's revenue is the proof that its mission is durable , and the deck buries it on slide 8 while leading with a dream on slide 2.
The third is the cheapest to fix and the most common: do not withhold your financials from your own pitch deck. "For financials, please contact" assumes the reader is already sufficiently interested to write an email. Most are not, and a deck's entire function is to convert the ones who are not. A company with genuine revenue, growing institutional customers and a policy-changing product had every reason to lead with its numbers, and it chose to gate them instead. Nine slides of real achievement, and no number a reader could act on.
Frequently asked questions
- Is the mWater deck a real investor pitch deck?
- Yes in intent — slide 2 states 'We're seeking funding to expand our reach to more users worldwide' — but it is missing the components that make a deck actionable. Across nine slides there is no funding amount, no instrument, no valuation, no use of funds, no close date, no competition slide and no financial statement. The final slide directs readers to email the CEO for financials, which means the deck asks for investment without ever presenting a proposition an investor could accept or decline.
- What is mWater?
- mWater is a social enterprise founded in 2013 that builds mobile data infrastructure for safe drinking water in low-income countries — mapping and monitoring water points via smartphone surveys, and publishing safety data to the public. The deck describes it as 'Yelp for water'. USAID funded its Tanzania deployment, and the deck states that mWater runs the technical back-end for three of the world's largest water NGOs, including Water.org. It reported $380,000 of revenue in 2014 across 8 employees.
- How many slides is the mWater pitch deck?
- Nine slides, 720 x 540 points — 4:3 rather than widescreen — built in Microsoft PowerPoint 2013 and dated 11 February 2015. The file is 499 KB. The sequence runs cover, summary, problem, deployments, solution, team, market, traction, and a closing thank-you page carrying six hyperlinked press placements and the CEO's contact details.
- Which mWater slides should founders copy?
- Slide 6, the team slide, is close to a model: three named founders, checkable credentials tied directly to the problem domain — a Columbia doctorate in health behaviour, a Columbia PhD in environmental engineering with NASA and UNICEF experience, a computer scientist with a linked GitHub profile — and a plain headcount. The press slide is also well built, hyperlinking article titles rather than showing a logo wall, so a reader can verify each claim in one click.
- What is the biggest weakness in the mWater deck?
- The absence of an ask, compounded by the deliberate withholding of financials. The company had genuinely investable facts — $380,000 of revenue, eleven institutional customers, USAID funding and a documented municipal policy change caused by its own data — and presented all of them as achievements rather than as inputs to a proposition. A reader who finishes the deck knows a great deal about mWater and has nothing to say yes or no to.
- What is wrong with the mWater traction chart?
- It plots users (left axis, 0–2,500) and water points (right axis, 0–25,000) as stacked filled areas in a single frame at an exact 10:1 axis ratio, so two unrelated quantities read as one accumulating volume. The design hides the genuinely interesting statistic it contains — roughly ten water points mapped per registered user. The timeline beneath it also renders completed milestones and 2015 projections in identical visual weight, so achieved facts and intentions are hard to separate at a glance.