Mutiny Gold (ASX:MYG) presented a compelling case for its Deflector project in late 2014, emphasizing a 'new management, new approach' philosophy. The deck highlights a strategic pivot toward a high-grade underground mine, which significantly reduced the stripping ratio and improved project economics. With a modest market capitalization of $23.7M and cash reserves of $3.1M as of June 2014, the company positioned itself as a low-cost producer with an All-In Sustaining Cost (AISC) of A$723/oz. The presentation relies heavily on technical validation, citing JORC reserves of 322,000oz of gold and…
Key takeaways
- The company underwent a total strategy overhaul under new management, shifting focus to an underground mine with a smaller 'entry' open pit to reduce costs (Slide 7).
- Projected economics for the revised strategy include $178M in cash flow after capital expenditure based on the Life of Mine inventory (Slide 7).
- Mutiny Gold reported a market capitalization of $23.7M at a share price of 3.5c, with 71% of shares held by retail investors (Slide 4).
- The processing facility is described as an 'off the shelf' plant with a 380ktpa throughput and a processing cost of $37/t (Slide 10).
- Existing JORC reserves are stated at 322,000oz Au, 16,000t Cu, and 360,000oz Ag (Slide 16).
- The All-In Sustaining Cost (AISC) is forecasted at a highly competitive A$723 per ounce of gold (Slide 16).
- The Gullewa tenement package covers 530km2, with over 80% under shallow cover, suggesting significant exploration potential beyond current reserves (Slide 13).
- Peer benchmarking places the Deflector project in a high-grade, high-reserve-size quadrant compared to competitors like Plutonic and Challenger (Slide 19).
Executive Summary
The Mutiny Gold (ASX:MYG) investor presentation from late 2014 serves as a technical and strategic roadmap for the Deflector Gold-Copper project in Western Australia. The deck is characterized by a shift in corporate narrative, moving from a generic exploration focus to a specific, high-margin production plan under a new management team. The core value proposition is built on high-grade reserves, low operating costs (AISC of A$723/oz), and a rapid 12-month path to production. With a market cap of $23.7M, the company sought to demonstrate that its revised underground mining strategy would deliver superior cash flows compared to its previous open-pit plans.
Slide 1: Title Slide
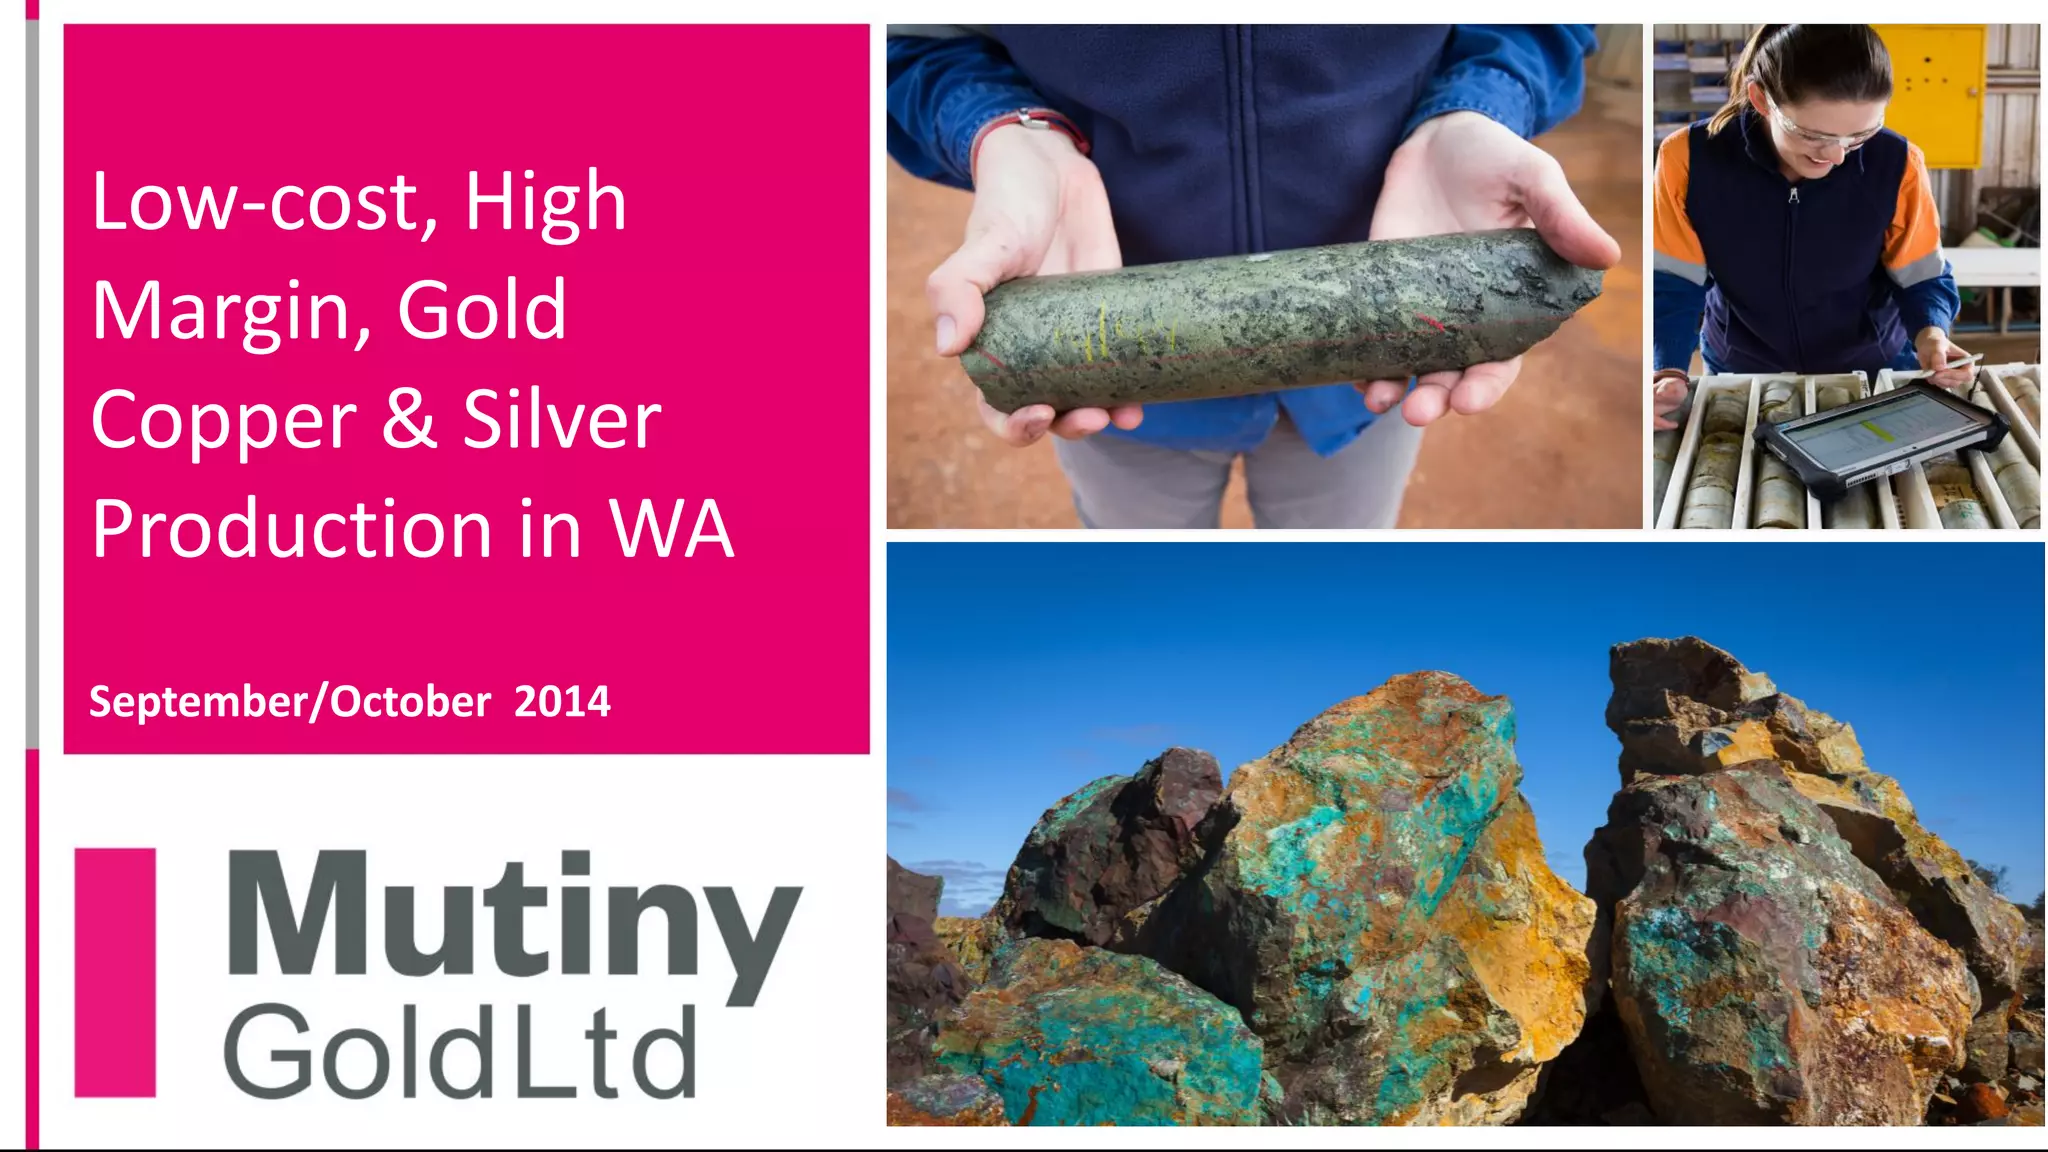
The cover slide establishes the primary value drivers: 'Low-cost, High Margin, Gold Copper & Silver Production in WA.' It dates the presentation to September/October 2014. The imagery focuses on the physical product—high-grade ore samples and geological field work—emphasizing that this is a project moving toward tangible production rather than early-stage speculation.
Slide 4: Corporate Snapshot
This slide provides the hard data on the company's capital structure and leadership. As of June 30, 2014, Mutiny Gold held $3.1M in cash. The market capitalization stood at $23.7M based on a 3.5c share price. A notable takeaway here is the share distribution: 71% retail ownership is high, suggesting a need to attract more institutional backing, which currently sits at 15%. The 'New Board and Management Team' section introduces Tony James (Managing Director) and Rowan Johnston (Executive Director of Operations), both mining engineers, signaling a shift toward operational expertise over pure exploration or finance. The board also includes a metallurgist and a finance professional, covering the essential pillars of mine development.
Slide 7: New Management, New Approach
This is the 'pivot' slide. It explicitly states that the new team completed a full review of the development strategy. The key change is moving to an underground mine with a smaller 'entry' open pit, which reduces the stripping ratio (the amount of waste rock moved per unit of ore). The slide claims this revised strategy delivers $178M in cash flow after capital expenditure. It lists the 'strong economics' as being driven by a shallow orebody, high grades, and an 'off the shelf' plant, which implies lower technical risk and faster deployment.
Slide 10: Proven Processing Facility
Technical feasibility is addressed here. The company plans to use a 380ktpa throughput plant moved to the mine site. The capital cost for the plant is listed at $52.1M with a 12-month engineering and construction timeline. The slide includes a process flow diagram (Crushing -> Grinding -> Gravity/Flotation) and a recovery table. The recovery rates are impressive: 91% total gold recovery and 93% total copper recovery for primary ore. A processing cost of $37/t is cited, which is a critical component of the low-cost production claim.
Slide 13: Extensive Potential to Grow Mine Life
While the focus is on immediate production, Slide 13 addresses the long-term upside. The Gullewa tenement package is large (530km2), and the company highlights that most of it is under shallow cover and under-explored, with an average drill depth of just 34m. Historical data is used to validate the field's quality, showing that between 1897 and 2003, the area produced 70,675 ounces of gold at an average grade of 4.5g/t. This historical context is meant to de-risk the geological potential for future discoveries.
Slide 16: Why Invest in Mutiny?
This serves as the summary pitch. It reiterates the JORC reserves (322,000oz Au, 16,000t Cu, 360,000oz Ag) and the forecast production of 63,000ozpa Au. The most significant figure is the AISC of A$723/oz, which would place the project in the lower quartile of cost curves globally. The slide also mentions a 'strong response' to indicative debt term sheets, suggesting that the project is bankable and that financing for the $52.1M plant is in progress.
Slide 19: Mine Peers, Reserve Grade & Production
This benchmarking slide plots Mutiny's Deflector project against other Australian gold mines. On a chart of Grade (g/t) vs. Reserve Size (koz), Deflector (highlighted in pink) sits in a favorable position—higher grade than peers like Mount Monger (Silver Lake) and Jundee (Northern Star), and comparable in reserve size to projects like Plutonic. This visual aid is designed to show investors that Mutiny is undervalued relative to the quality of its asset.
Slide 22: Au Equivalent & Production Target
The final slide provides the technical definitions and the full resource inventory. It breaks down the Deflector Life of Mine (LOM) production inventory into Measured, Indicated, and Inferred categories. The total resource is 2.248 million tonnes at 5.7g/t gold and 0.8% copper. This slide is essential for regulatory compliance (JORC 2012) and provides the 'fine print' for the gold equivalent calculations used throughout the deck, based on $1,300/oz gold and $6,660/t copper.
What Works Well
Strategic Clarity: The deck clearly articulates the transition from the old plan to the new plan. By highlighting the reduction in stripping ratio and the move to underground mining, management provides a logical reason for improved economics. · Cost Transparency: Explicitly stating the AISC (A$723/oz) and processing costs ($37/t) allows investors to model the potential margins immediately. · Technical Validation: The use of JORC-compliant reserve and resource tables, along with detailed metallurgical recovery data, builds credibility for a junior miner. · Peer Comparison: Slide 19 effectively uses a bubble chart to show that Mutiny owns a high-grade asset that is competitive with much larger, well-known producers.
What Is Missing
Detailed Financial Ask: While the deck mentions a $52.1M plant cost and 'indicative debt term sheets,' it does not explicitly state how much equity capital the company is currently seeking or the specific terms of the proposed financing. · Timeline to Cash Flow: Although a 12-month construction period is mentioned, a detailed Gantt chart or milestone roadmap showing permitting, financing close, and first gold pour dates is absent. · Sensitivity Analysis: The economics are based on $1,300/oz gold. Given the volatility of commodity markets in 2014, a slide showing how the $178M cash flow changes if gold prices drop to $1,100 or $1,200 would have been prudent. · Environmental and Social Governance (ESG): There is no mention of community relations, native title status, or environmental permitting, which are standard requirements for Australian mining projects.
Founder Lessons
Own the Pivot: If your company has changed strategy, don't hide it. Mutiny Gold leaned into their 'New Management, New Approach' (Slide 7), turning a potential weakness (past failures or delays) into a strength (optimized strategy). · Benchmark Aggressively: Investors in specific sectors (like mining or SaaS) have 'mental maps' of the landscape. Using a peer comparison chart (Slide 19) helps you occupy a specific slot in their mind—in this case, 'the high-grade, low-cost junior.' · Lead with the Unit Economics: For a production-heavy business, the cost per unit is the most important metric. By putting the AISC and processing costs front and center, Mutiny made the investment case about margin rather than just 'finding gold.' · Balance 'Now' with 'Next': The deck does a good job of showing the immediate production plan (Deflector) while teasing the long-term exploration upside (Gullewa tenement). This gives investors both a short-term catalyst and a long-term growth story.
Frequently asked questions
- What was the primary change in Mutiny Gold's development strategy?
- As detailed on Slide 7, the new management team moved away from a large-scale open-pit approach. Instead, they implemented a plan centered on a high-grade underground mine accessed via a much smaller 'entry' open pit. This change was designed to vastly reduce the stripping ratio and align plant capacity with underground production rates, ultimately targeting $178M in post-CAPEX cash flow.
- What are the key financial metrics for the Deflector project?
- The deck highlights an All-In Sustaining Cost (AISC) of A$723/oz, which is significantly lower than many global gold producers. Slide 16 also notes a 12-month construction period and a market capitalization of $23.7M. The processing costs are estimated at $37 per tonne, supported by a $52.1M capital expenditure for the processing plant as shown on Slide 10.
- Who owns Mutiny Gold according to the 2014 data?
- Slide 4 provides a breakdown of share distribution. The company is heavily retail-weighted, with 71% of shares held by retail investors. Funds and institutions hold 15%, strategic alliances account for 12%, and the board and management team hold a relatively small 2% stake. There were 678,227,617 shares on issue at the time of the presentation.
- What is the metallurgical recovery expectation for the ore?
- Slide 10 provides a detailed recovery table. For primary ore, which makes up 80% of the processing volume, the total gold recovery is 91% and copper recovery is 93%. The process uses a combination of gravity and flotation circuits to produce gold bars and a copper-gold concentrate for smelting.
- What exploration upside does the company claim?
- Slide 13 emphasizes the 'extensive potential' of the 530km2 Gullewa tenement package. The company notes that 80% of the area is under shallow cover with an average drill hole depth of only 34m. They have identified four priority targets and point to a 7km 'Deflector corridor' that remains largely untested despite historical production in the field averaging 4.5g/t.