From Benchmark to Business Case: How a Deep-Tech Deck Turns
A whole-deck walkthrough of Deep Render's AI compression deck: how one benchmark figure travels into customer savings, a licence and a paid pilot.
From Benchmark to Business Case: Following One Number Through a Deep-Tech Deck
Deep-tech founders usually have one strong asset: a technical result. The hard part of the deck is turning that result into something a buyer pays for and an investor can value. Deep Render, a London company building AI video compression, built its 50-page deck around one claim, roughly 5x better compression, and carried it from a lab chart into customer savings, a licence, a sales process and a long-term plan. We follow that number from slide to slide to show where each step holds and where it needs more evidence.
TL;DR
A benchmark becomes a business case when each later slide restates it in a unit someone pays for, and says which conditions the benchmark depends on. Deep Render does the restating well: a quality-at-bitrate table becomes '5X better compression', then storage and bandwidth savings for an example streaming company, then a licence, then a paid proof of concept.
The weak point is the baseline. The benchmark table gives three savings against three older codecs: about 3x against AV1, about 3.8x against HEVC and about 5.4x against AVC (our conversion of the slide's percentages). The '5X' used in the customer examples matches the AVC comparison, the oldest standard, so the size of the saving for a real buyer depends on which codec that buyer already uses. The deck doesn't say.
The most useful slides are the ones where the deck answers its own hardest question. Page 39 explains why sales start with paid pilots: 'we do not have a general-purpose, all-use case codec yet' and need 'more time to run on all hardware'. Page 45 then lists what must be true before the company can sell without pilots. Together they tell an investor what the money is for, even though the deck has no ask slide.
The number's path through the deck, page by page
Eight pages from Deep Render's deck, chosen because each is one step from lab result to sale. Redactions are in the published copy.
Deep Render executive summary slide — slide 16
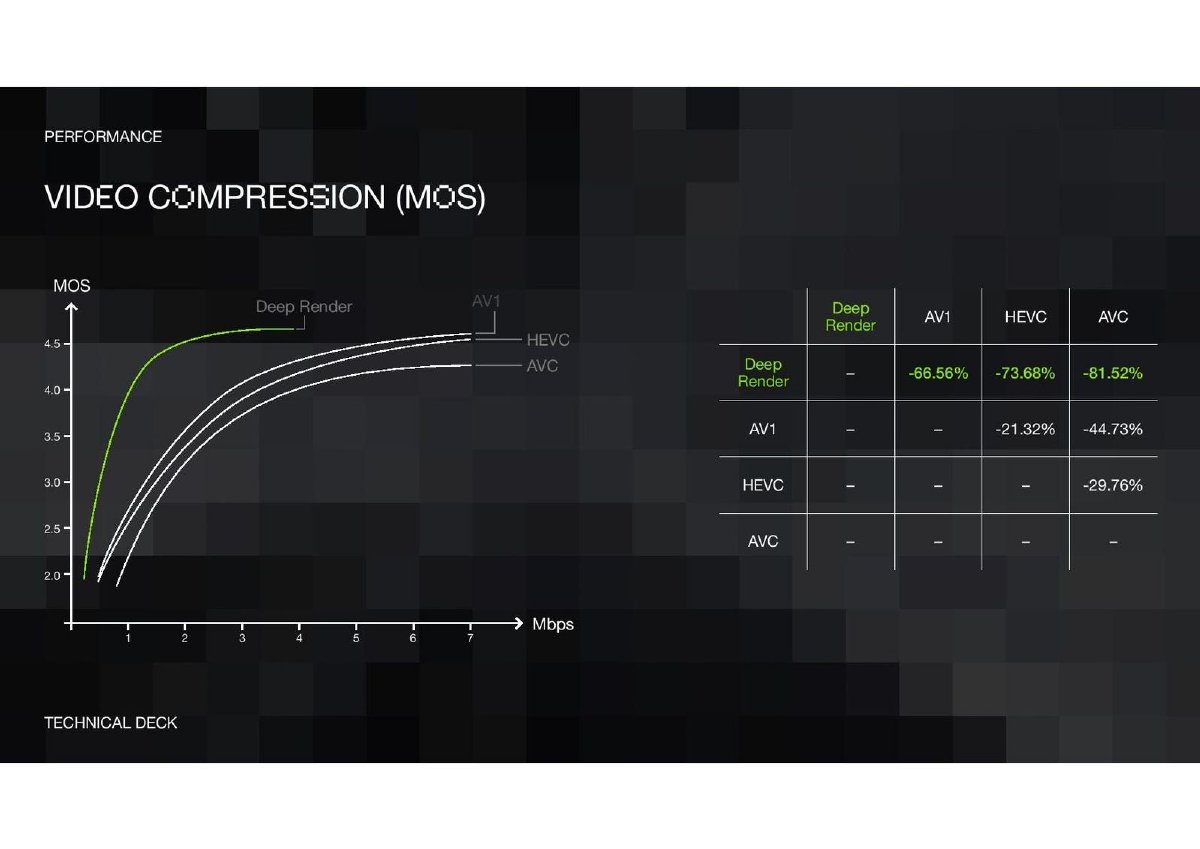
AI video compression. Benchmark page: perceived quality against bitrate.
Deep Render deck, slide 16. Exact stored slide matched to this analysis.
Our analysis: Our reading: a strong benchmark; the savings convert to about 3x, 3.8x and 5.4x smaller files.
Evidence and limitation: Three baselines, a named dataset and human ratings.
What a founder can adapt: Show the saving against each standard your buyers actually use.
Supporting analysis
What the deck claims: Deep Render's savings: '-66.56%' against AV1, '-73.68%' against HEVC, '-81.52%' against AVC; test set on page 15 is '#50 MCL JCV & UVG clips' rated by 'Human Studies'.
Presentation choice: Every later claim in the deck depends on which of these baselines it uses.
When it does not fit: Don't let one headline multiple stand in for a table of three.
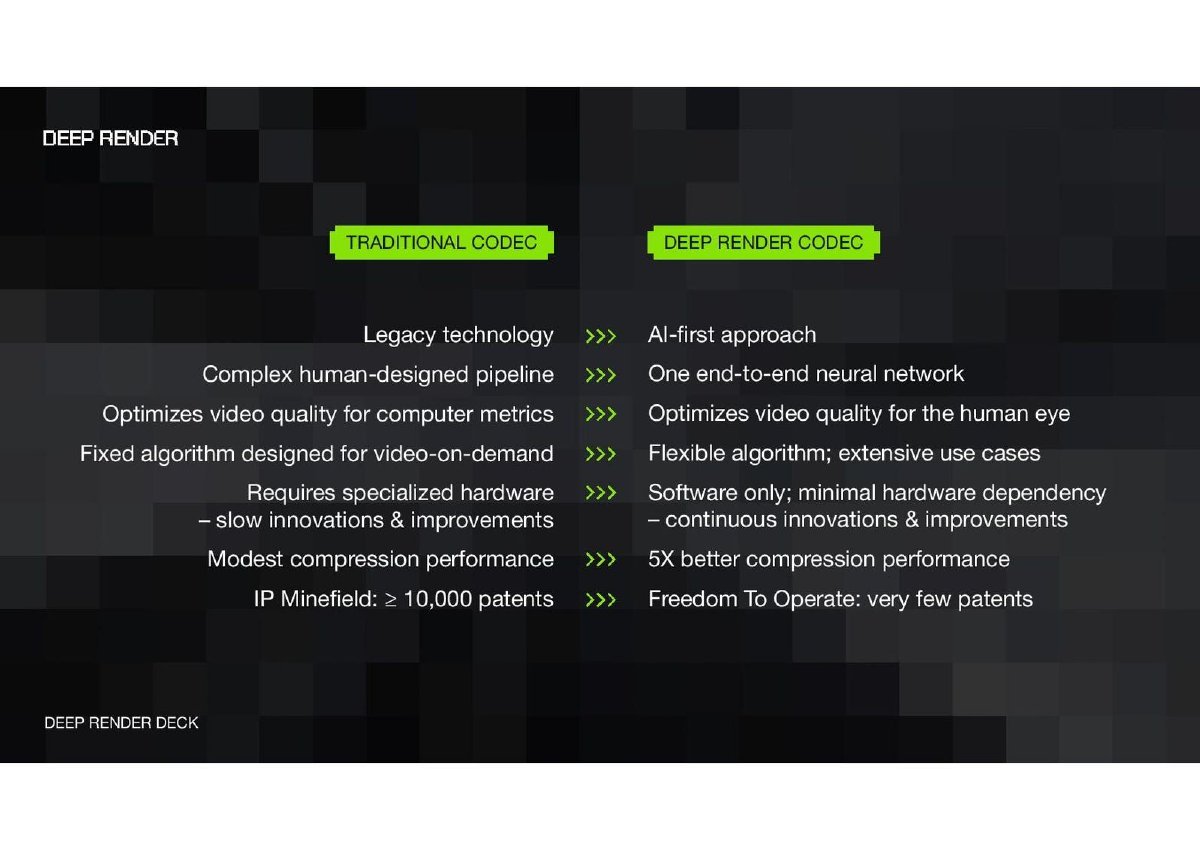
Deep Render deck, slide 17. Exact stored slide matched to this analysis.
Our analysis: Our reading: the point where the baseline drops out of the story.
Evidence and limitation: The '5X' matches the AVC comparison on page 16; no baseline is named here.
What a founder can adapt: Keep the baseline in the headline: '5x smaller than AVC'.
Supporting analysis
What the deck claims: 'Modest compression performance' against '5X better compression performance'; 'IP Minefield: ≥ 10,000 patents' against 'Freedom To Operate: very few patents'.
Presentation choice: Summary slides decide which number investors remember.
When it does not fit: Don't summarise a benchmark without saying what it beats.
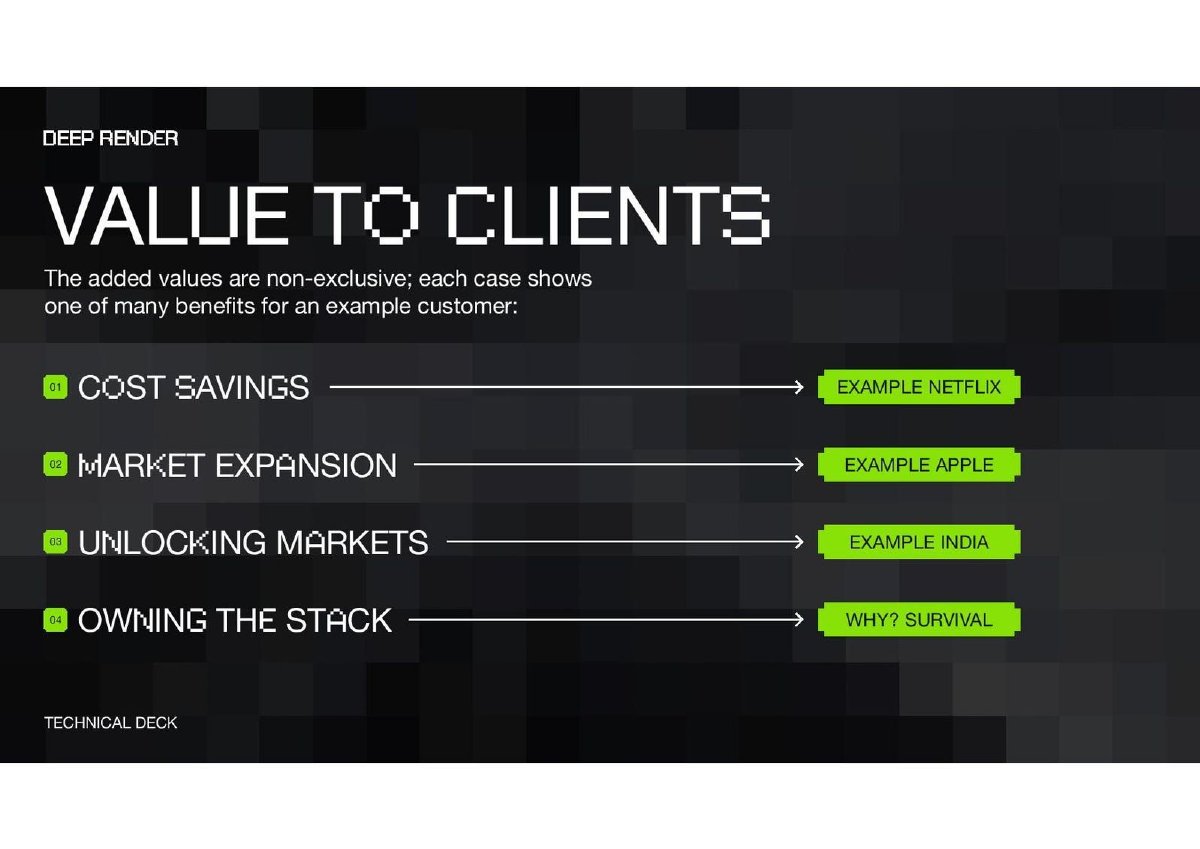
Deep Render deck, slide 23. Exact stored slide matched to this analysis.
Our analysis: Our reading: the right disclosure, placed on one page while the cases sit on later ones.
Evidence and limitation: Labels the following cases as examples.
What a founder can adapt: Repeat 'illustrative example' on each case page.
Supporting analysis
What the deck claims: 'The added values are non-exclusive; each case shows one of many benefits for an example customer': cost savings (Netflix), market expansion (Apple), unlocking markets (India), owning the stack.
Presentation choice: Readers often see the case pages without this framing.
When it does not fit: Don't let a famous company's name read as a customer relationship.
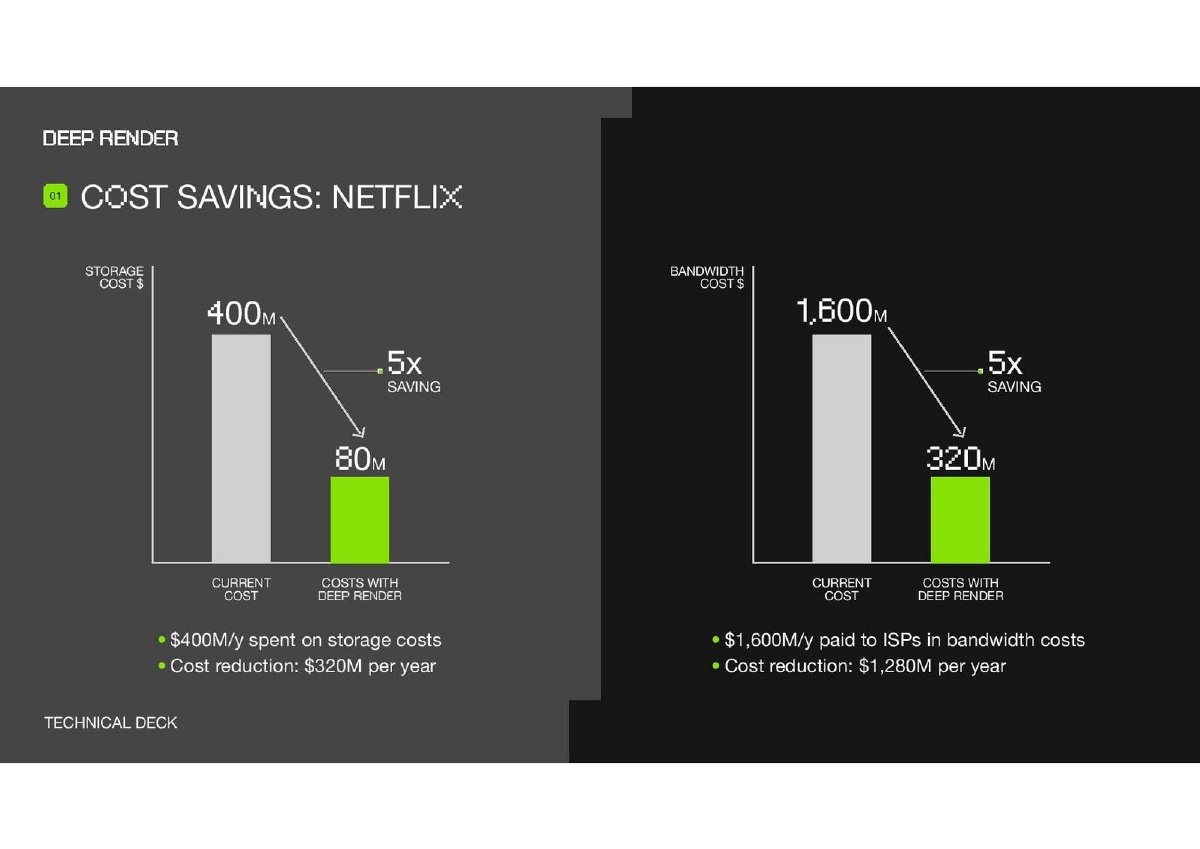
Customer economics for an example streaming company.
Deep Render deck, slide 24. Exact stored slide matched to this analysis.
Our analysis: Our reading: translates the benchmark into the buyer's unit, but carries the AVC multiple without saying so.
Evidence and limitation: Arithmetic holds; no source for the cost base; uses the full 5x.
What a founder can adapt: Source the cost base and show the saving as a range across baselines.
Supporting analysis
What the deck claims: '$400M/y spent on storage costs' with a '5x saving' to $80M, 'Cost reduction: $320M per year'; '$1,600M/y paid to ISPs in bandwidth costs' to $320M, 'Cost reduction: $1,280M per year'.
Presentation choice: This is where a technical result becomes a reason to buy.
When it does not fit: Don't apply your best-case multiple to every buyer.
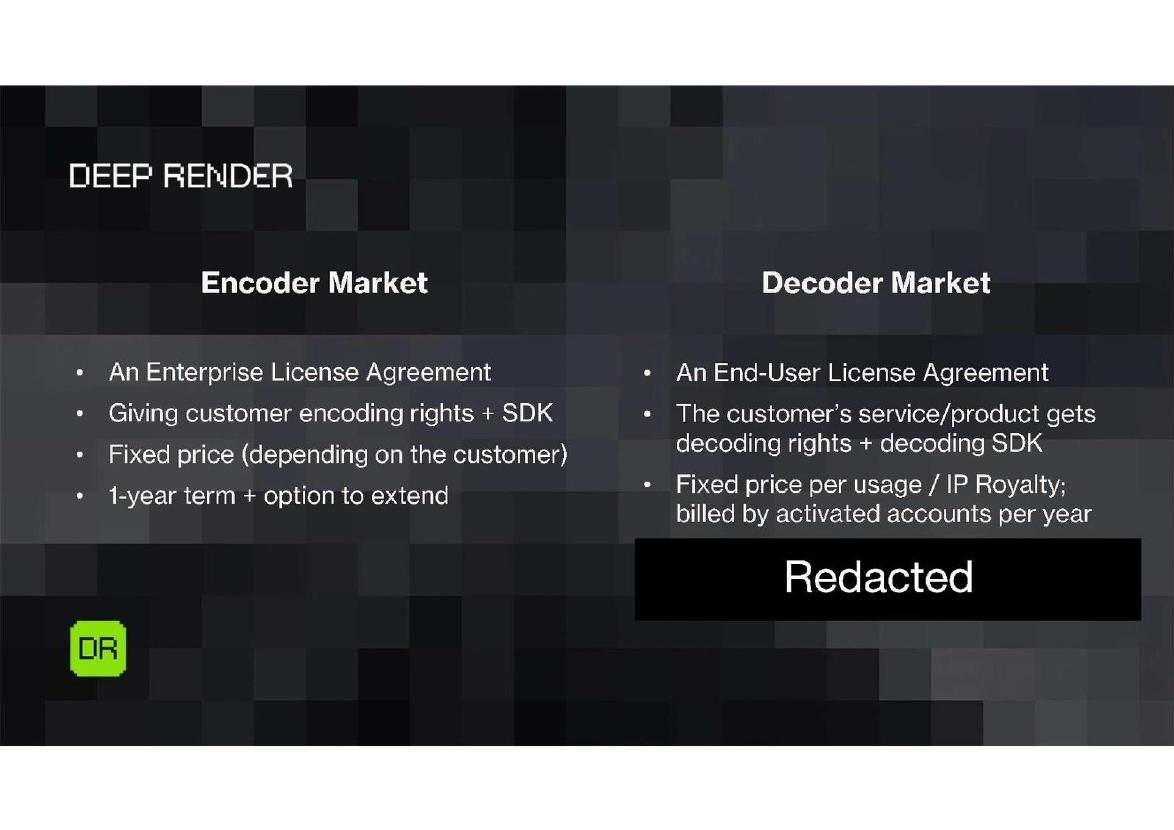
Deep Render deck, slide 31. Exact stored slide matched to this analysis.
Our analysis: Our reading: linked to the value pages in structure, not in numbers.
Evidence and limitation: Licence structure tracks usage; prices hidden; page 33 warns 'We may underprice our service significantly.'
What a founder can adapt: State price as a share of the customer's saving.
Supporting analysis
What the deck claims: Encoder: 'An Enterprise License Agreement', 'Fixed price (depending on the customer)', '1-year term + option to extend'. Decoder: 'An End-User License Agreement', 'Fixed price per usage / IP Royalty; billed by activated accounts per year'. Prices redacted.
Presentation choice: The licence is where the saving should set the price.
When it does not fit: Don't separate pricing from the value case you just made.
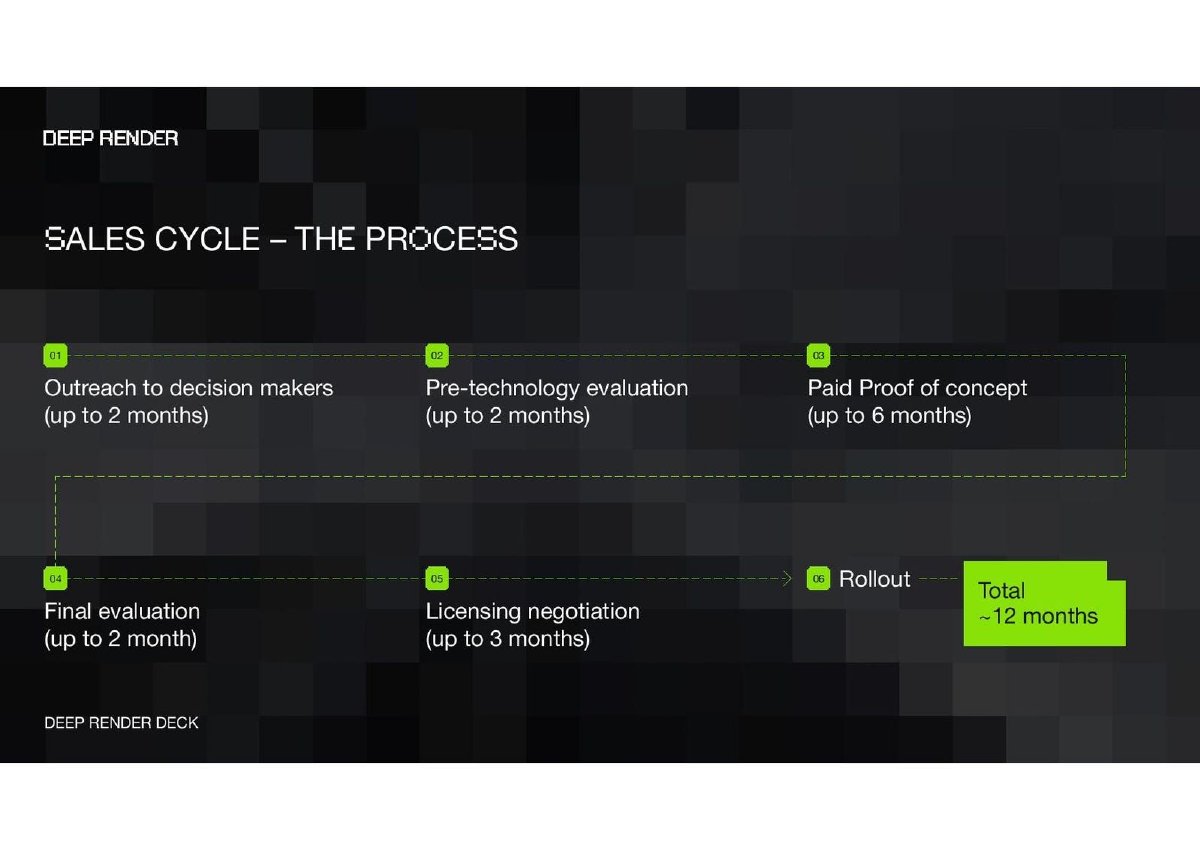
Deep Render deck, slide 35. Exact stored slide matched to this analysis.
Our analysis: Our reading: the paid pilot is the longest stage and the bridge between benchmark and sale.
Evidence and limitation: Stages and durations; the pipeline on page 36 is redacted apart from 'Reference calls are available'.
What a founder can adapt: Show how many deals sit at each stage, even as counts.
Supporting analysis
What the deck claims: Outreach 'up to 2 months', pre-technology evaluation 'up to 2 months', 'Paid Proof of concept (up to 6 months)', final evaluation, licensing negotiation 'up to 3 months', rollout; 'Total ~12 months'.
Presentation choice: Shows how long the benchmark takes to become revenue.
When it does not fit: Don't show a process without saying where deals are in it.
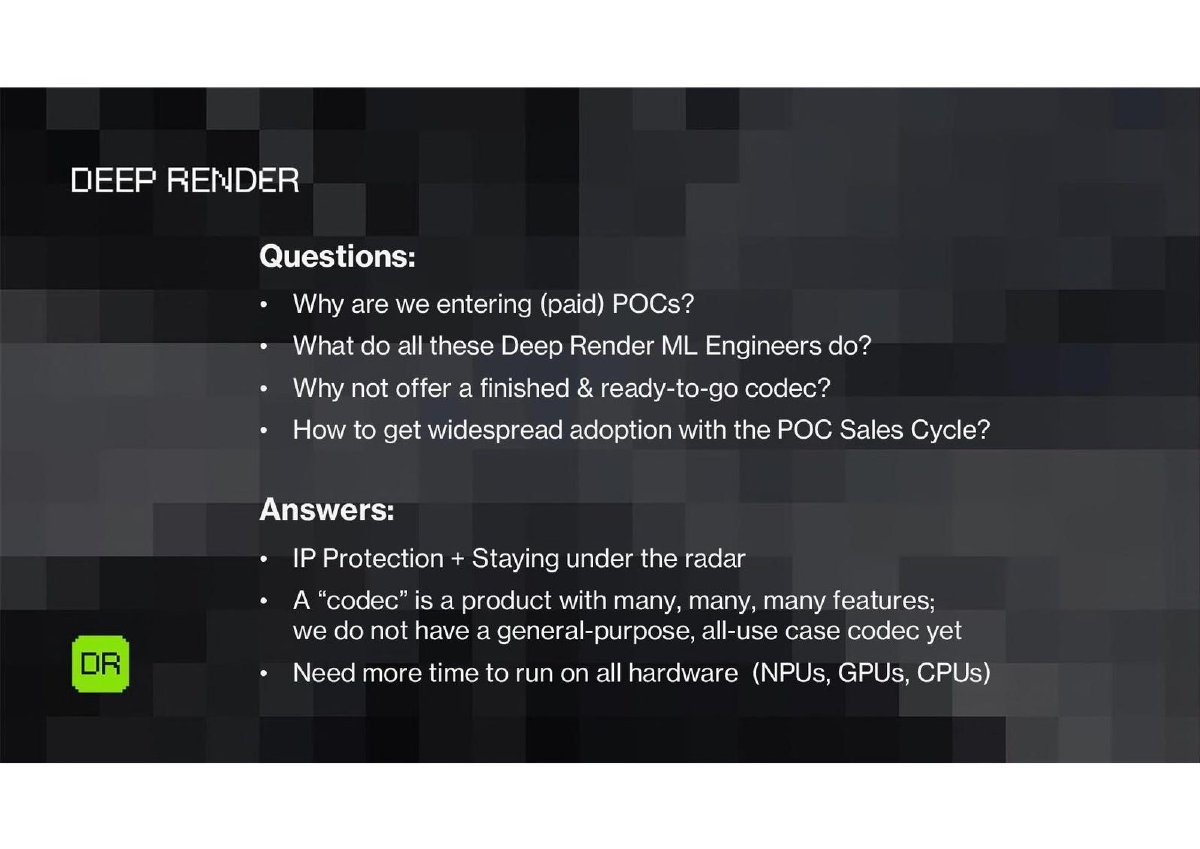
Deep Render deck, slide 39. Exact stored slide matched to this analysis.
Our analysis: Our reading: the hinge of the deck; it explains why the benchmark is sold through pilots.
Evidence and limitation: A direct statement of the product's current limits.
What a founder can adapt: Name what your technology can't do yet and how your sales model handles it.
Supporting analysis
What the deck claims: 'Why are we entering (paid) POCs?' and 'Why not offer a finished & ready-to-go codec?' Answers: 'IP Protection + Staying under the radar'; 'we do not have a general-purpose, all-use case codec yet'; 'Need more time to run on all hardware (NPUs, GPUs, CPUs)'.
Presentation choice: Investors trust a benchmark more when the deck says where it doesn't yet apply.
When it does not fit: Don't leave investors to discover the limits in diligence.
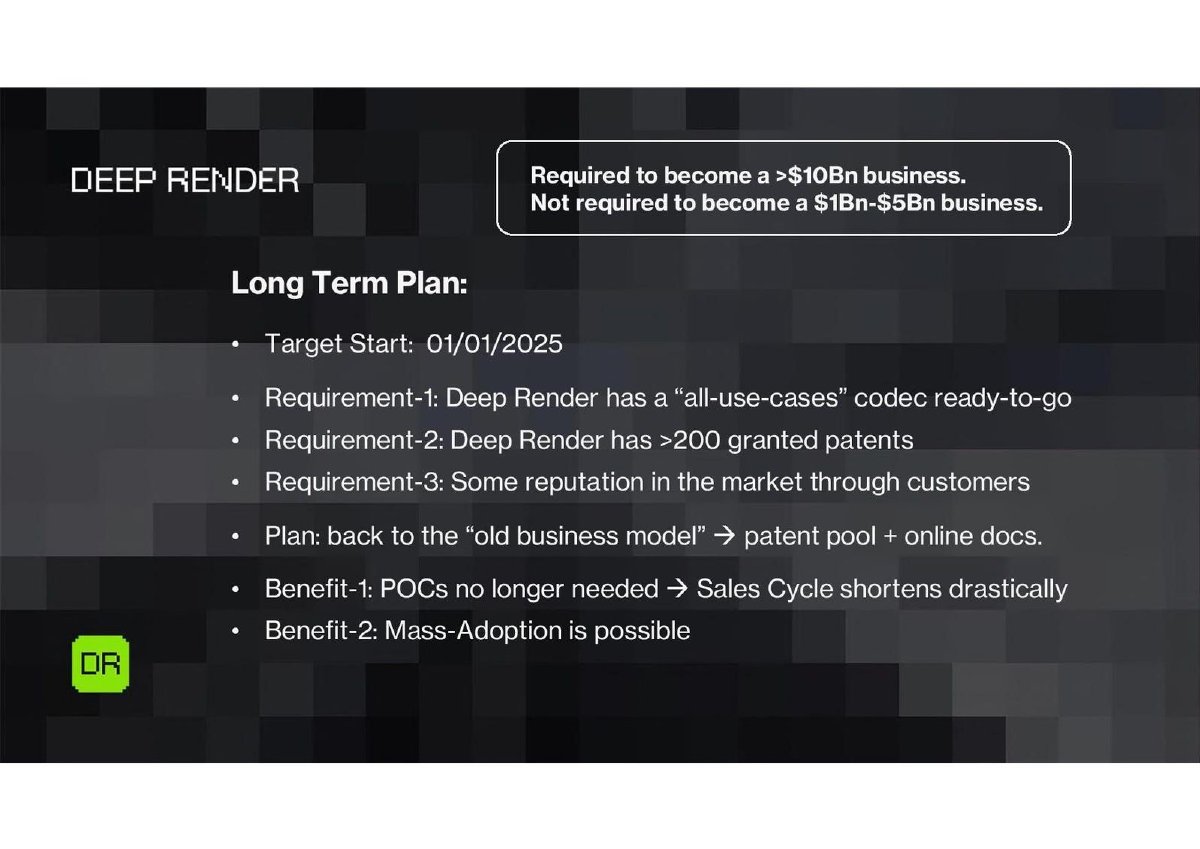
Deep Render deck, slide 45. Exact stored slide matched to this analysis.
Our analysis: Our reading: the clearest statement of what the next stage of money is for, in a deck with no ask slide.
Evidence and limitation: Requirements map back to earlier gaps; no current status or amount.
What a founder can adapt: Give each requirement its current status and attach the raise to it.
Supporting analysis
What the deck claims: 'Target Start: 01/01/2025'; an 'all-use-cases' codec 'ready-to-go', more than 200 granted patents, 'Some reputation in the market through customers'; 'POCs no longer needed → Sales Cycle shortens drastically'; box: required for a business of more than $10Bn, 'Not required to become a $1Bn-$5Bn business.'
Presentation choice: Turns the benchmark's limits into milestones an investor can track.
When it does not fit: Don't state a long-term target without saying how far away it is.
Six stages, ~12 months; pipeline redacted; references offered
Partial
Limits
38-43
No general-purpose codec yet; hardware coverage map
Candid
Long-term plan
44-45
Three requirements, 2025 target; no status or amount
Conditions, no ask
Key Takeaways
State the baseline next to every technical claim. '5x better' needs 'than what, measured how'.
When you translate a benchmark into customer savings, carry the baseline with it, and label the example as illustrative if the company isn't a customer.
Connect the benchmark to how you sell. If the technology isn't general-purpose yet, say so and show the sales step (a paid pilot) that bridges the gap.
Answer the questions investors will ask about your sales model on a slide of their own, as Deep Render does on page 39.
Turn the long-term plan into conditions: what must be true (product, patents, references) before the business model changes.
Carry your benchmark through the deck
Write each step in the buyer's unit, and carry the baseline with it. A step without a baseline is the first to fix.
Benchmark. Your result against each standard buyers use, with dataset and method.
Headline. The one-line claim, with its baseline named.
Buyer value. What the result is worth to one buyer, labelled real or illustrative, with a sourced cost base.
Price. How your price relates to that value.
Sales path. How a buyer gets from interest to a signed deal, and where your deals are now.
Limits and plan. Where the result doesn't apply yet, and the milestones this round funds to close that gap.
Copyable framework: Against [standard], we deliver [x]x smaller files at equal quality on [dataset]. For a buyer spending [cost] on [bandwidth], that is [saving] a year ([illustrative/actual]). We price at [share] of the saving. Today the codec covers [use cases]; this round funds [milestone] by [date].
Illustrative example 1 — written by us
Before: 5X better compression performance.
After: On 1080p test clips rated by viewers, files are about 5x smaller than AVC and about 3x smaller than AV1 at the same quality.
What improved: Our illustrative rewrite using the conversions from page 16's own percentages. The baseline now travels with the claim into every later slide.
The question this guide answers
Our existing coverage uses Deep Render for single questions. The sales-cycle go-to-market guide uses page 35 to show a stage-by-stage enterprise sales timeline; the licensing business-model draft uses page 31 for its encoder and decoder licences; the customer-references traction draft uses page 36 for 'Reference calls are available'. Our Deep Render teardown summarises the deck and its benchmark figures.
Our other whole-deck walkthroughs ask different questions. The Accurx walkthrough follows an evidence chain from product adoption to paying customers to the ask; the Vajro walkthrough asks what each chapter of a deck told as company history must prove. This guide asks: when a deck's main evidence is a technical benchmark, how do the later slides turn it into a reason to buy and a reason to invest, and where does that translation need more support?
Several parts are redacted in the published copy: the customer quotes on pages 7 and 8, the web demo on page 19, the prices and revenue figures on pages 31 to 33, the customer pipeline on page 36, and labels on pages 40 to 43. We don't guess what they hide. Quotes are from the slides; interpretation is marked as ours.
The slides use different templates: some are footed 'Technical deck', some 'Deep Render deck', and pages 29 to 45 use a plainer layout with a 'DR' badge. Our reading: the deck appears to combine material prepared for different audiences, which helps explain why the business sections read differently from the technical ones.
Step one: the benchmark and its baseline
Page 15 sets up the test: dataset '#50 MCL JCV & UVG clips', '1080x1920, SDR (8bit)', '24-120fps (mixed)', '5 sec. sequence length', distortion measured by 'Human Studies' and file size in 'Megabits per second'. Page 16, 'Video compression (MOS)', charts perceived quality (mean opinion score) against bitrate and tabulates Deep Render's savings: '-66.56%' against AV1, '-73.68%' against HEVC and '-81.52%' against AVC. Page 17 summarises the result as '5X better compression performance'. Page 14 says 'Up to 80% reduction' against the 'HEVC Standard'.
Are these figures consistent? They measure different things, so they aren't contradictory. A saving of 81.52% means a file about 5.4 times smaller, which matches '5X' against AVC. Against HEVC the table's 73.68% means about 3.8 times smaller, and against AV1 about 3 times. Page 14's 'up to 80%' against HEVC is a best case, while the table appears to be an average across the test clips; the deck doesn't define either. What remains unknown is which comparison the '5X' claims later in the deck are meant to carry.
Our reading: this is a strong benchmark page. It names the dataset, uses human ratings rather than only computer metrics, and compares against three standards instead of one. The risk is in what happens next, when one headline multiple is lifted out of a table with three baselines.
Recommendation: when you summarise a benchmark, keep the baseline in the headline ('5x smaller than AVC; 3x smaller than AV1'), so every later slide inherits it.
Step two: from benchmark to customer economics
Page 23, 'Value to clients', introduces four cases and says how to read them: 'The added values are non-exclusive; each case shows one of many benefits for an example customer'. Page 24, 'Cost savings: Netflix', applies a '5x saving' to '$400M/y spent on storage costs' (to $80M) and '$1,600M/y paid to ISPs in bandwidth costs' (to $320M), giving cost reductions of '$320M per year' and '$1,280M per year'. Page 25, 'Market expansion: Apple', says Apple TV+ 4K needs '30-40 Mbit', that 157 million people in the US have less than 25 Mbit, and that with a '5X reduction' and '20% penetration' Apple would gain '31M more users', lifting revenue from '1.6B' to '3B'.
The arithmetic inside each page holds: 33 million plus 31 million is the 64 million shown, and $400M divided by five is $80M. Page 23 also labels these as example customers, which is the right disclosure. Our reading: these are illustrations of what the benchmark could be worth to a buyer, not evidence that any buyer has seen the saving. Nothing in the deck says Netflix or Apple tested the product, and an investor skimming page 24 alone could read it that way.
The second gap is the baseline again. Both pages use the full 5x, which corresponds to the comparison against AVC. If an example customer already streams in AV1 or HEVC, the table on page 16 implies a smaller multiple, so the saving shrinks with it. The deck also doesn't give a source for the $400M and $1,600M cost figures.
Recommendation: put the example label on the page itself, give the source of the customer's cost base, and show the saving as a range across baselines (for example, 3x to 5x) rather than a single multiple.
Step three: from customer value to a licence
Pages 29 and 30 show where the product sits: Deep Render's library replaces the standard codec in the customer's encoding and decoding loops, running 'on GPU or NPU'. Page 31 then sets out two licences: for the encoder market, 'An Enterprise License Agreement', 'Fixed price (depending on the customer)', '1-year term + option to extend'; for the decoder market, 'An End-User License Agreement', 'Fixed price per usage / IP Royalty; billed by activated accounts per year'. Page 32 adds that encoder ARR is 'typically, 20%-25% of EULA' and 'comes quicker'; the decoder side is 'reliant on adoption; increases with further NPU adoption'. The prices are redacted, and page 33 adds a disclaimer: 'there is still uncertainty in the given numbers. We may underprice our service significantly.'
Our reading: this is the step where the benchmark should set the price, and the deck makes the connection in structure but not in numbers. The licence charges per customer and per activated account, which tracks the value pages (storage and bandwidth scale with usage). What we can't see, because of the redactions, is whether the price is a share of the saving shown on page 24. The disclaimer is honest and unusual; it tells an investor that pricing is still being discovered.
Recommendation: link price to the customer's saving explicitly, even as a ratio ('we price at about [x]% of the bandwidth saved'), so the value slides and the licence slides support each other. The brackets are our placeholder, not Deep Render's figure.
Step four: the sales path explains the gap
Page 35, 'Sales cycle - the process', lays out six stages with durations: outreach 'up to 2 months', pre-technology evaluation 'up to 2 months', 'Paid Proof of concept (up to 6 months)', final evaluation 'up to 2 month', licensing negotiation 'up to 3 months', then rollout, 'Total ~12 months'. Page 36 shows how far deals have got, but the pipeline is redacted; only 'Reference calls are available' is readable.
Pages 38 and 39 then do something few decks do: they ask the questions an investor would ask about this model and answer them. 'Why are we entering (paid) POCs?', 'What do all these Deep Render ML Engineers do?', 'Why not offer a finished & ready-to-go codec?', 'How to get widespread adoption with the POC Sales Cycle?' The answers: 'IP Protection + Staying under the radar'; 'A "codec" is a product with many, many, many features; we do not have a general-purpose, all-use case codec yet'; 'Need more time to run on all hardware (NPUs, GPUs, CPUs)'.
Our reading: this is the hinge of the deck. The benchmark on page 16 is measured on a defined set of 1080p clips; page 39 admits the product isn't yet a codec for every use case and device. The paid pilot is how the company sells a result that works for specific uses before it works for all of them. Pages 40 to 43 then chart use cases, encoding hardware, decoding hardware and features, with cells highlighted step by step (the labels are redacted), which reads as a coverage map of where the codec runs.
Recommendation: if your technology works in some settings before others, say so as plainly as page 39 does, and tie each pilot to the setting where your benchmark applies.
Step five: the long-term plan as conditions
Page 44 sets out a 'Long Term Plan' with 'Target Start: 01/01/2025'. Three requirements follow: an 'all-use-cases' codec 'ready-to-go', more than 200 granted patents, and 'Some reputation in the market through customers'. The plan is 'back to the "old business model" → patent pool + online docs', with two benefits: 'POCs no longer needed → Sales Cycle shortens drastically' and 'Mass-Adoption is possible'. Page 45 adds a box: 'Required to become a' business of more than $10Bn; 'Not required to become a $1Bn-$5Bn business.'
Our reading: this is the clearest statement in the deck of what the next stage of funding is for, even though there is no ask slide or amount. Each requirement maps back to an earlier gap: the general-purpose codec answers page 39, the patents answer page 17's 'Freedom To Operate' claim, and customer reputation answers the redacted pipeline on page 36. The deck then closes with a thought experiment (pages 46 to 48) rather than a request for money.
What remains unknown: how far the company was from each requirement when the deck was made, and how much money and time each needs. Page 45's box is a useful framing device, but it separates the two outcomes by size without saying what drives the difference.
Recommendation: give each long-term requirement a current status and a milestone ('[n] patents granted of 200; general-purpose codec covers [x] of [y] use cases'), and put the amount you're raising against them.
Where the market slides fit
The market comes before the technology, on pages 9 and 10. Page 9 is titled 'Codec Market / Willingness to Pay' but shows two third-party market charts: an encoder market growing from 1.97 to 2.45 (USD billion, 2021 to 2027) and a next-generation decoder market from 1.9 to 9.2 (2021 to 2029). Page 10's summary table gives '$2.45 Bn on the Encoding Side' and '$9.20 Bn on the Decoding Side' under the heading 'Size by 2029', and a total of more than $10 Bn.
Two points need care. The encoder figure on page 9 is for 2027, while page 10 places it under 2029; the deck doesn't explain the difference, so the total mixes two forecast years. And the title promises willingness to pay, but the evidence for it is elsewhere: the redacted customer quotes on pages 7 and 8 ('better compression would save us hundreds of millions'). Our reading: market size and willingness to pay are different claims, and the deck's best support for willingness to pay is the paid pilot itself.
When this structure is the right choice
Our view, drawing on this deck: a benchmark-led structure suits companies whose technical result is the main reason to invest and is measurable against a recognised standard. It works when each later slide restates the result in the buyer's unit, and when the deck is open about the conditions the result depends on.
It is weaker when the benchmark's baseline gets lost between slides, when example customers could be mistaken for real ones, or when the commercial evidence (pipeline, prices, revenue) has to be hidden. In that case the deck should say what an investor can verify, as Deep Render does by offering reference calls.
Common mistakes
A multiple without a baseline. Say what the result beats and how it was measured.
Examples that read as customers. Label illustrative cases on every page they appear.
Best case applied to every buyer. Show savings as a range across the standards buyers use.
Pricing cut off from value. Express price as a share of the customer's saving.
Limits left for diligence. State where the technology doesn't work yet and how you sell around it.
Diagnostic checklist
The benchmark names its dataset, method and every baseline.
Each summary claim keeps its baseline.
Customer-value pages are labelled real or illustrative and source their cost base.
Price is linked to the value the buyer receives.
The sales path shows stages and where current deals sit.
Limits and long-term requirements have a current status and are tied to the raise.
Frequently asked questions
How should a deep-tech startup present a technical benchmark in a pitch deck?
Name the dataset, the method and every standard you compare against, then carry the baseline into each later slide. Deep Render's page 16 gives three baselines; its later '5X' matches only the oldest of them.
Can I use a famous company as an example customer?
Yes, if every page says it's an illustration and the cost figures are sourced. Deep Render labels its Netflix and Apple cases as examples on page 23, but not on the case pages themselves.
How do I connect a technical result to my business model?
Express the price as a share of what the result saves or earns the buyer. Deep Render's licence tracks usage, but its prices are redacted, so the link to its savings examples can't be seen.
Should my deck admit what the technology can't do yet?
Yes. Deep Render's page 39 says it doesn't yet have a general-purpose codec, which explains why it sells through paid pilots and makes the benchmark more credible.
Does this deck show that a benchmark-led pitch wins funding?
No. Business Insider reported this as the deck used to raise $9 million (reported elsewhere as a $6.3 million Series A plus a $2.7 million grant), but one deck can't show why investors decided. We use it to show how the slides connect, not to explain the outcome.
How we chose these examples
Selection (2026-10-02): chosen autonomously from eligible original decks for the 'technical milestones supporting commercialization' direction. Distinctness check: our teardown summarises the deck and its benchmark; the sales-cycle guide uses page 35, the licensing draft page 31 and the customer-references draft page 36, each for a single question; the Accurx walkthrough follows an adoption-to-ask evidence chain and the Vajro walkthrough a company-history structure. None follows a benchmark through to the sale, so Deep Render was kept.
All 50 pages of the original deck file were rendered; pages 1, 9, 10, 14, 16, 17, 19, 22 to 25, 31 to 33, 35, 39, 44 and 45 were read at full size, the rest at overview size. Eight images are used (pages 16, 17, 23, 24, 31, 35, 39, 45): six stored for this draft on 2026-10-02 and two (31, 35) already in the library. Multiples (about 3x, 3.8x and 5.4x) are our conversions of the slide's percentage savings (1 divided by 1 minus the saving). This guide was written with an AI editorial model and checked against the slide images by model review.
Redactions are in the published copy and are not inferred. Deep Render was private when the deck was made; no takedown request for it is recorded. Funding facts come from the articles listed in Sources and are context only.