One Chart, Two Readers: Following Atom Limbs' Deck
A whole-deck walkthrough of Atom Limbs' 19-page seed deck: how its problem slide says prosthetics cost too much.
One Chart, Two Readers: Following Atom Limbs' Deck from 'Too Expensive' to a Subscription That Earns More
Many decks make two promises that pull against each other: to customers, a cheaper or fairer price; to investors, more revenue per customer. Both can be true, but only if the deck shows how. Atom Limbs' 19-page seed deck for a mind-controlled prosthetic arm is a clear case. It opens by saying the prosthetics industry is broken and expensive, and later shows a subscription that, by its own chart, collects more from each customer over ten years than a competitor's one-time device sale. We follow that thread through the deck and set out what would make both readings hold together.
TL;DR
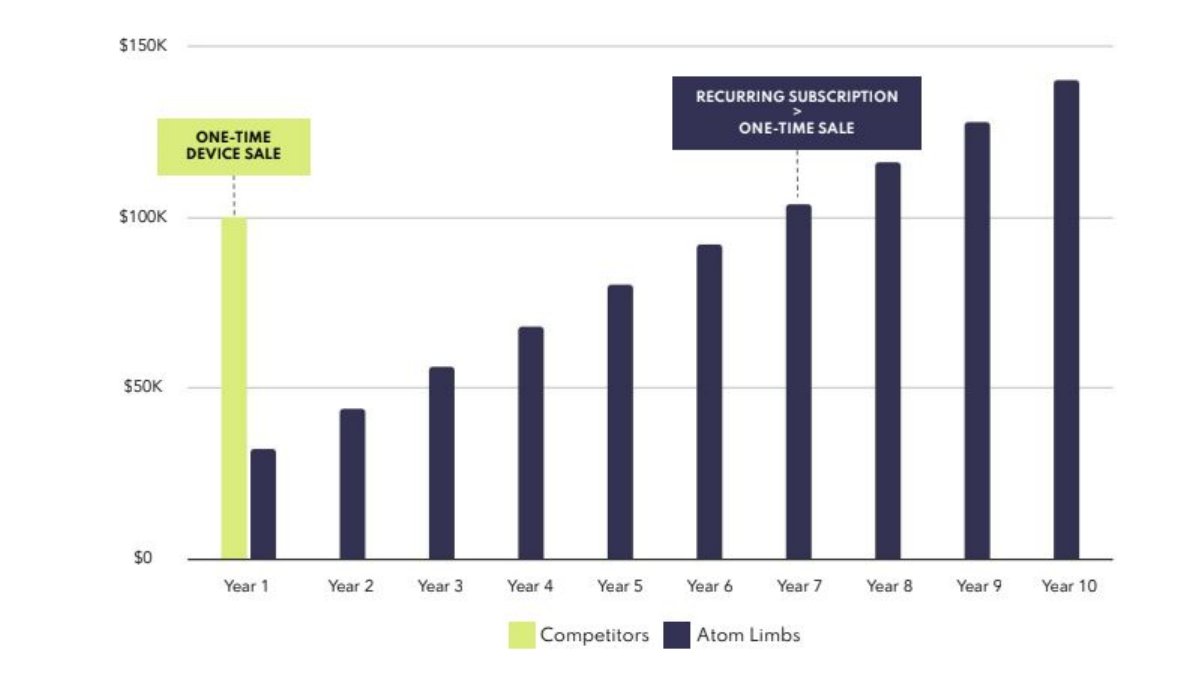
If your pitch says customers pay too much and your model earns more per customer, show the comparison from the customer's side too. Atom Limbs' page 2 says 'Lifetime medical care for each amputee costs… $500,000+' and that prosthetics are 'painful and poorly-designed'. Page 15 says its subscription 'reduces upfront costs by 75% in Year 1' and 'covers ongoing upgrades, repairs and replacements'. Page 16 then charts a competitor's 'One-time device sale' of about $100K in Year 1 against Atom Limbs' bars, which start at about $32K and rise by about $12K a year to about $140K by Year 10, with a label marking Year 7, where the recurring subscription passes the one-time sale (values read from the chart).
Read as revenue, page 16 is good news for investors: each customer is worth more over time than a one-off sale. Read as cost, it shows a customer paying more than the competitor's price from Year 7. The deck could reconcile the two, since page 15 says the subscription covers replacements, and a one-time device would presumably need replacing within ten years. But the chart shows only one competitor bar, with no replacement or repair costs, and nowhere does the deck say who pays: the amputee, an insurer or a public programme.
The lesson for founders: when a chart is drawn for investors, check what it tells customers. Put both sides' totals on the same basis, include the costs the alternative carries, and name who pays.
The argument page by page
Six pages from Atom Limbs' 19-page deck, from the cost complaint to the launch plan.
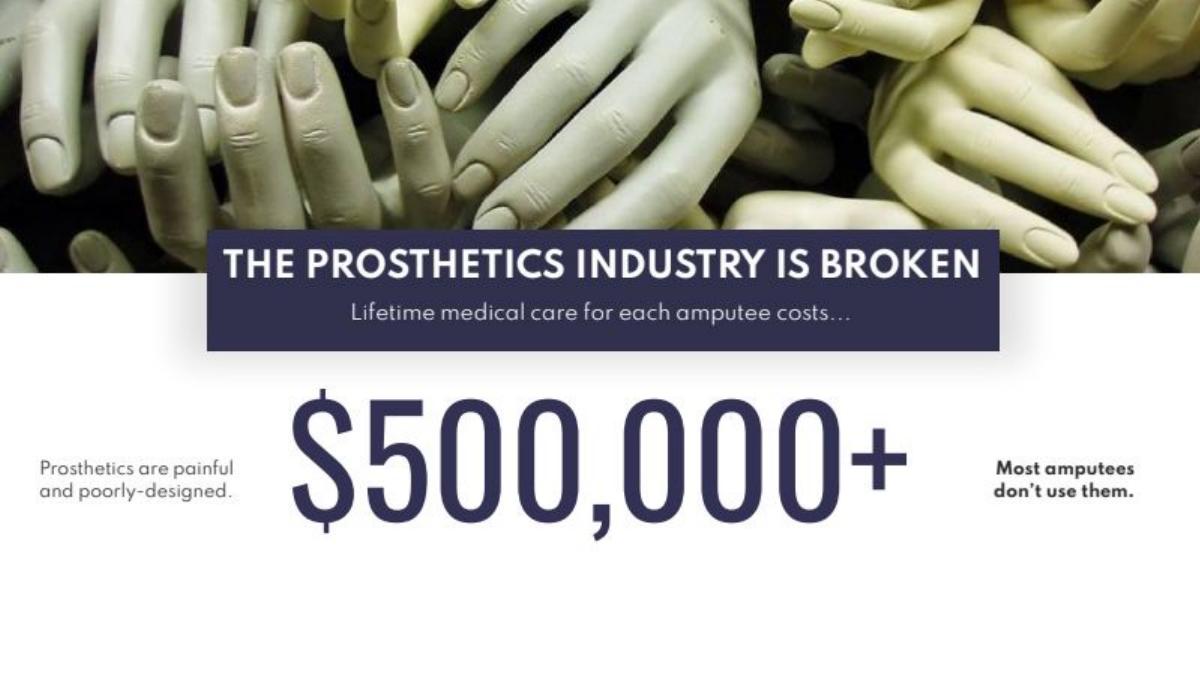
Atom Limbs executive summary slide — slide 2
Prosthetic arm, seed. The problem.
Atom Limbs deck, slide 2. Exact stored slide matched to this analysis.
Our analysis: Our reading: the problem is framed as cost, which the later model must answer.
Evidence and limitation: No source on the slide; the figure covers all lifetime medical care.
What a founder can adapt: If you open on cost, measure your model against the same cost.
Supporting analysis
What the deck claims: 'THE PROSTHETICS INDUSTRY IS BROKEN'; 'Lifetime medical care for each amputee costs… $500,000+'; 'Most amputees don't use them.'
Presentation choice: The opening sets the test the business model has to pass.
When it does not fit: Don't open on lifetime care costs and later compare only device prices.
Atom Limbs deck, slide 16. Exact stored slide matched to this analysis.
Our analysis: Our reading: a revenue win for investors and a higher cost for customers from Year 7, unless the competitor's other costs are added.
Evidence and limitation: No data labels; competitor shown without repairs or replacements.
What a founder can adapt: Draw both sides' ten-year totals on the same basis.
Supporting analysis
What the deck claims: Competitors' one-time device sale about $100K; Atom Limbs from about $32K in Year 1 to about $140K by Year 10, passing the one-time sale at Year 7.
Presentation choice: The same chart is read by investors and, implicitly, customers.
When it does not fit: Don't compare a running subscription total with a single purchase.
Page 16's bars read from each side, using approximate chart values.
Point in time
Investor reading
Customer reading
What's missing
Year 1
About $32K collected vs $100K competitor sale
About 68% cheaper up front (deck says 75%)
Price and what it includes
Year 7
Subscriber now worth more than a one-time buyer
Now paying more than the competitor's price
Competitor repairs and replacements
Year 10
About $140K per customer
About $40K more than one device
Who pays: user, insurer or public programme
Key Takeaways
Check your revenue chart from the customer's side.
Compare like with like: include the alternative's replacement and repair costs.
Name who pays — the user, an insurer or a public programme.
Make sure headline percentages match your own chart.
Tie the revenue forecast to the launch dates on your roadmap.
Check your model from both sides
Fill in each line with your own figures before drawing a per-customer chart.
Customer's alternative. What they'd buy instead, and its price.
Alternative's other costs. Repairs, replacements and services over the same period.
Your price and term. What the customer pays, and for how long.
What your fee covers. Which of the alternative's costs you replace.
Who pays. User, employer, insurer or public programme.
Both totals. Customer's total cost and your revenue per customer over the same years.
Copyable framework: Over [years], the alternative costs [price + other costs]; our plan costs [total], so customers save [amount] while we earn [revenue] per customer, paid by [payer].
Illustrative example 1 — written by us
Before: A chart of a one-time $100K device sale against a subscription total that passes it in Year 7.
After: Ten-year cost: competitor device [$X] + repairs [$Y] + one replacement [$Z] = [total]; Atom plan [total]. Paid by [payer].
What improved: Our illustrative rewrite. Bracketed values are placeholders, not Atom Limbs' figures; it compares both sides on the same basis and names the payer.
The question this guide answers
Our Atom Limbs teardown summarises the deck and notes that it lacks unit economics and pricing detail. Two published guides each use one of its slides: the waitlist traction guide (page 12) and the hardware team guide (page 6). Neither follows the price argument from the problem slide to the subscription chart.
Our Superintelligent walkthrough asks why a product should be sold as a subscription at all. Our 100Plus walkthrough follows money between a patient, a doctor and Medicare. This guide asks something else: when the problem you pitch is cost to the customer, does the model you pitch to investors still look like a better deal for that customer?
How we read the deck
We rendered all 19 pages of the original deck file held in our library and read each one. The deck is undated; it quotes an article from 4 March 2021, and its roadmap runs from 'Q1 2021' to 'Q3 2023'. Atom Limbs is a private company. According to the distributor's listing, it used these decks in its 2021 crowdfunding campaign on Wefunder, raising more than $5M on a SAFE with a $40M valuation cap; its later offering documents are filed with the US Securities and Exchange Commission. We use that only as background and don't claim the deck caused the funding.
The commenters' names and photos on page 12 are blacked out in the deck itself, and we don't try to identify them. The team pages (6 and 7) aren't used. Values on pages 15 and 16 are read from charts that print no data labels, so we round them and call them approximate.
Step one: the problem is cost and poor design
Page 2, 'THE PROSTHETICS INDUSTRY IS BROKEN', puts one number at the centre: 'Lifetime medical care for each amputee costs… $500,000+'. On either side it says 'Prosthetics are painful and poorly-designed' and 'Most amputees don't use them.' Page 3 quotes a writer: 'Prosthetic arm technology is still so limited that I become more disabled when I wear one.' Page 4 sets the mission: 'Atom makes revolutionary prosthetics' and 'We're on a mission to end physical disability'.
Our reading: the opening makes two complaints, cost and design, but presents only the cost one with a number. The $500,000 figure has no source on the slide and covers all lifetime medical care, not only prosthetics. That matters later, because the deck's own revenue plan is measured against a device price, not against lifetime care.
Step two: the product and the demand
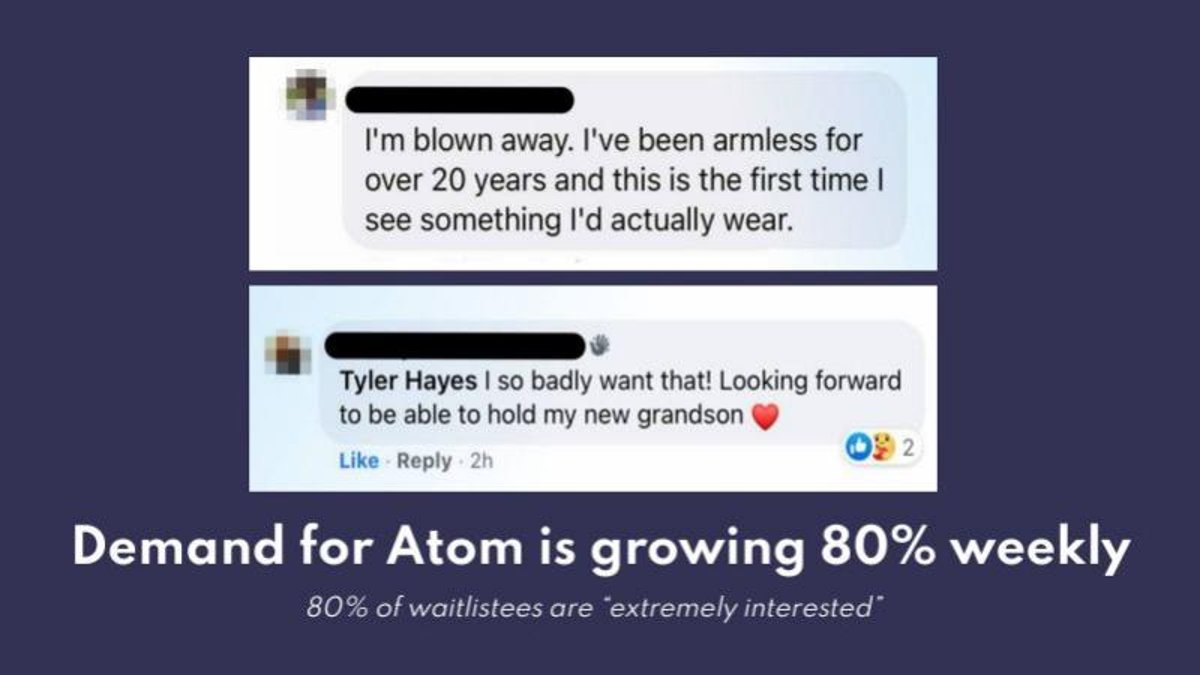
Pages 5 to 11 make the product case: 'Built on 15 YEARS of DARPA R&D', 'Partnered with Johns Hopkins Applied Physics Laboratory', a team with 'experience from Apple, Nike, Tesla, IDEO, Google, and Intel', and features including 'Intuitive neural mind control', 'Haptics-driven basic sense of touch', '50% lighter than competition' and '24/7 Concierge and Health Coach'. Page 12 shows two comments from would-be users and the line 'Demand for Atom is growing 80% weekly', with '80% of waitlistees are “extremely interested”'.
Our reading: these pages answer the design complaint from step one. Our waitlist guide already covers page 12's evidence. For this guide, the point is that none of these pages mentions price, so the reader arrives at the business model with the cost complaint from page 2 still open.
Step three: the market is sized by health spending
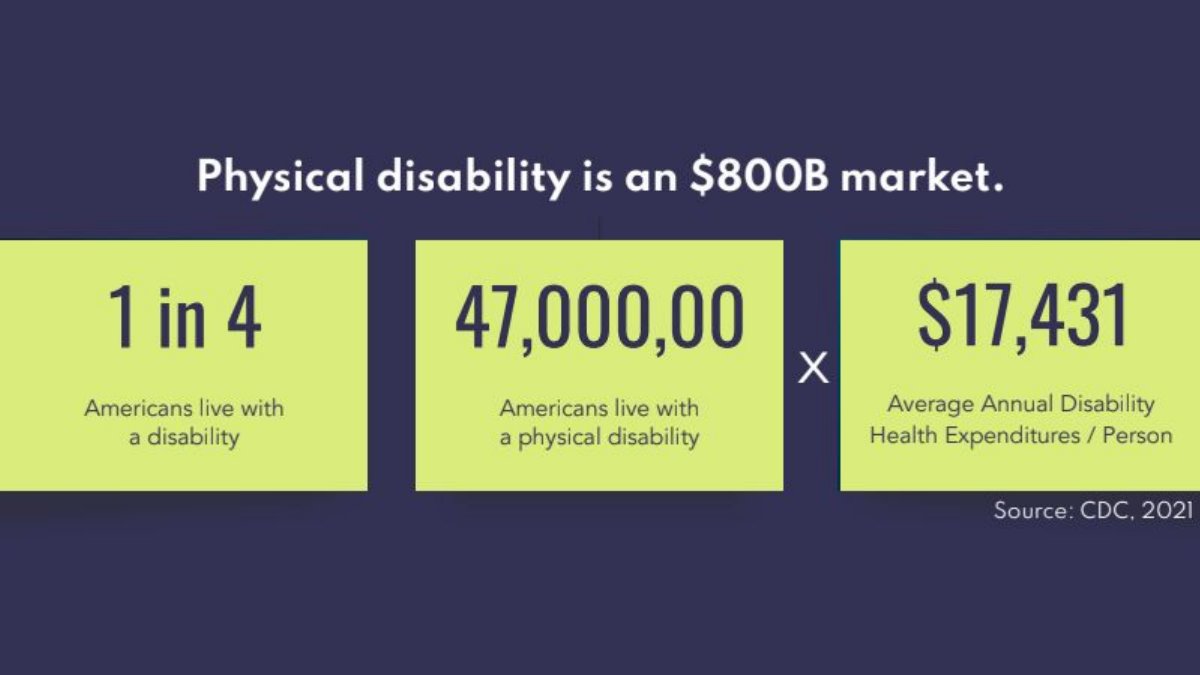
Page 13 shows disability rising with age (Statista, 2021). Page 14 says 'Physical disability is an $800B market', from '1 in 4 Americans live with a disability', '47,000,00 Americans live with a physical disability' and '$17,431 Average Annual Disability Health Expenditures / Person' (CDC, 2021).
Our checks: 47 million times $17,431 is about $819bn, which supports '$800B'. The population figure is printed with a digit missing ('47,000,00'); we read it as 47 million, which the multiplication confirms. Our reading: this sizes total health spending on physical disability, most of which isn't prosthetic arms. It also hints at the answer to who pays — health spending is largely paid by insurers and public programmes — but the deck doesn't say so.
Step four: the subscription, and the chart with two readings
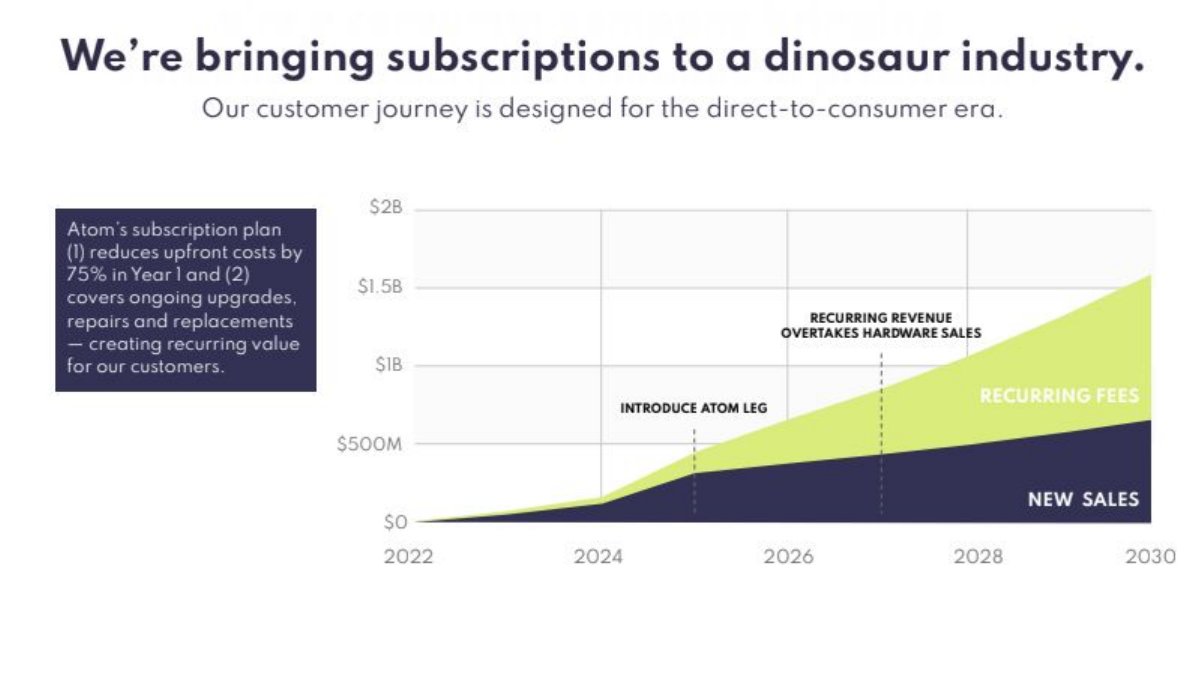
Page 15, 'We're bringing subscriptions to a dinosaur industry. Our customer journey is designed for the direct-to-consumer era', says the plan '(1) reduces upfront costs by 75% in Year 1 and (2) covers ongoing upgrades, repairs and replacements — creating recurring value for our customers.' Its chart shows company revenue from 2022 to 2030 split into 'NEW SALES' and 'RECURRING FEES', reaching about $1.6bn by 2030, with markers for 'INTRODUCE ATOM LEG' (about 2025) and 'RECURRING REVENUE OVERTAKES HARDWARE SALES' (about 2027).
Page 16 has no title. A light bar labelled 'Competitors' and 'ONE-TIME DEVICE SALE' stands at $100K in Year 1. Dark bars labelled 'Atom Limbs' run from about $32K in Year 1 to about $140K in Year 10, and a label at Year 7, where they first pass $100K, says the recurring subscription exceeds the one-time sale.
Our reading: the bars rise steadily, so they show a running total paid per customer. For an investor, that's the point: by Year 7 a subscriber is worth more than a one-off buyer. For a customer, the same bars say Atom Limbs costs less at first and more from Year 7. Both readings come from one chart, and the deck only labels the first.
Two smaller points. First, $32K against $100K is about 68% lower, not the '75%' on page 15; a 75% cut would mean about $25K. The chart may be rounded or the 75% may count something else, so we call it unexplained, not wrong. Second, page 15's company-wide forecast and page 16's per-customer chart aren't connected: the deck gives no number of customers, price or renewal rate that would turn one into the other.
What would reconcile the two readings
The deck already contains the reconciling idea. Page 15 says the subscription 'covers ongoing upgrades, repairs and replacements'. If a competitor's arm needs repairs and is replaced every few years, its ten-year cost is far more than one $100K bar. Drawn that way, the chart could show the subscription cheaper for the customer and more valuable for the company at the same time, because the company captures spending that today goes to repairs, replacements and separate services.
The deck doesn't draw it that way. It shows no replacement cycle, repair cost or service cost for the competitor, and no breakdown of what the roughly $12K a year buys. It also doesn't say who pays. A direct-to-consumer subscription suggests amputees pay themselves, while the $800B market on page 14 is mostly insurer and public spending. For a medical device, which party signs up and pays every year shapes both the sales plan and the renewal rate.
Step five: the roadmap and the ask
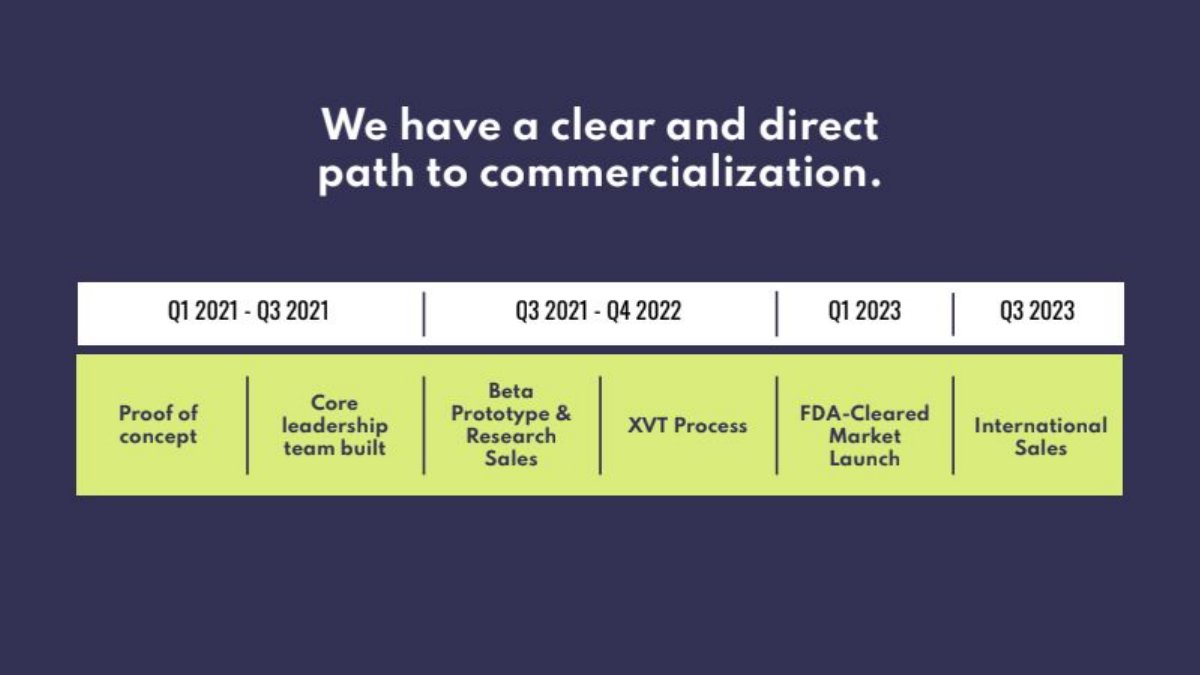
Page 17, 'We have a clear and direct path to commercialization', runs from 'Proof of concept' and 'Core leadership team built' (Q1–Q3 2021), through 'Beta Prototype & Research Sales' and 'XVT Process' (Q3 2021–Q4 2022), to 'FDA-Cleared Market Launch' (Q1 2023) and 'International Sales' (Q3 2023). Page 18 quotes press coverage ('Like something out of space came to Earth.' — CNN). Page 19 closes: 'We're ending physical disability. Join us.'
Our reading: the roadmap dates the market launch to 2023, and page 15's forecast shows revenue starting from 2022. The deck has no ask amount or use of funds; in a crowdfunding campaign those terms usually sit on the campaign page rather than the deck. We don't assess whether the roadmap dates were met.
What a reader can't tell
Missing from the deck: the subscription price and term, what the yearly fee includes, the competitor's replacement and repair costs, who pays (user, insurer or public programme), how many customers the 2030 forecast assumes, expected renewal rates, the source of the $500,000 figure, and the amount raised and its use. The company's later offering documents may answer some of these; this guide reads the deck as published.
When this structure is the right choice
Our view, drawing on this deck: leading with the customer's cost problem and closing with recurring revenue is a strong structure for hardware that needs ongoing service. It works when the deck shows one comparison both readers can accept: the customer's total cost over the product's life against the alternative's, with repairs and replacements included, and the company's revenue per customer from the same numbers. Atom Limbs has the ingredients (the replacement promise on page 15 and the ten-year chart on page 16), but presents the chart only from the company's side.
Common mistakes
Revenue chart read only one way. Check what it says about the customer's cost.
Unequal comparison. Include the alternative's repairs and replacements.
Payer left out. Name who signs up and pays each year.
Headline doesn't match chart. Make sure '75%' matches the bars, or explain it.
Forecast disconnected from unit numbers. Show customers, price and renewal rate.
Diagnostic checklist
The model answers the problem slide's cost complaint.
Per-customer comparisons include the alternative's full costs.
The payer is named.
Headline percentages match the charts.
The revenue forecast uses stated customers and prices.
Launch dates line up with the forecast.
Frequently asked questions
Does Atom Limbs' subscription cost customers more than a competitor's arm?
By the deck's own chart, the running subscription total passes a $100K one-time device sale in Year 7. Whether that's more expensive overall depends on repair and replacement costs for the competitor's device, which the deck doesn't show.
Is the 75% claim wrong?
The chart's Year 1 bar (about $32K against $100K) works out closer to 68%. The figure may be rounded or measured differently, so we call it unexplained.
Who pays for an Atom Limbs subscription?
The deck doesn't say. It describes a direct-to-consumer journey but sizes the market from total health spending, much of which insurers and public programmes pay.
How did Atom Limbs raise money with this deck?
According to the distributor's listing, it used these decks in a 2021–2022 Wefunder crowdfunding campaign. One deck can't show why investors decided.
How is this different from the waitlist guide?
The waitlist guide uses page 12 to discuss demand evidence. This guide follows the price argument from page 2 to page 16.
How we chose these examples
Selection (2026-10-02): saved lead from the previous run (waitlist as demand evidence). The published waitlist traction guide already covers page 12's lesson, so we followed a different thread the deck supports: the cost complaint on page 2 against the subscription chart on page 16. Distinctness check: the teardown summarises the deck; two guides use pages 6 and 12; the Superintelligent and 100Plus walkthroughs answer different questions.
All 19 pages of the original deck file (sha256 b70f402b…, matching our inventory) were rendered and read (AI editorial model review, not human). Six images are used: pages 14, 15, 16 and 17 were stored for this draft on 2026-10-02 and are byte-identical to the renders; pages 2 and 12 reuse images already in our library. Chart values on pages 15 and 16 are read from unlabelled charts and rounded. The deck's own blacking-out on page 12 is left as is.
Eligibility: Atom Limbs is a private company; the deck was used in a public crowdfunding campaign and is already in our library with an existing teardown; no takedown request is recorded. Funding facts are background only.