A '~4.3% Drag on Profitability' That Is a Share of Revenue
A whole-deck walkthrough of Anrok's 22-page 'Navigating sales tax for SaaS' deck.
A '~4.3% Drag on Profitability' That Is a Share of Revenue: Sizing the Cost of a Problem, From Anrok
Founders selling a fix for a risk often put one number on the cost of doing nothing. It is persuasive when a reader can follow how it was built, and risky when the label claims more than the method. Anrok sells sales tax software to software companies. Its 22-page deck, 'Navigating sales tax for SaaS', is presented by the CEO and co-founder and reads like a customer-education talk rather than an investor pitch: it explains the law, shows the risk and closes with the product. Its central page, 'Average annual revenue drag weighted by State GDP', turns state tax, penalty and interest rates into one figure: 'Not charging sales tax may result in ~4.3% drag on profitability'. The arithmetic on the page holds. But the number is a share of revenue, not profit, it assumes a company's sales are spread like U.S. GDP, and it doesn't use the sales thresholds the deck itself explains earlier. We read the deck page by page and show how each page sets up that number, and what a reader would need to apply it to one company.
TL;DR
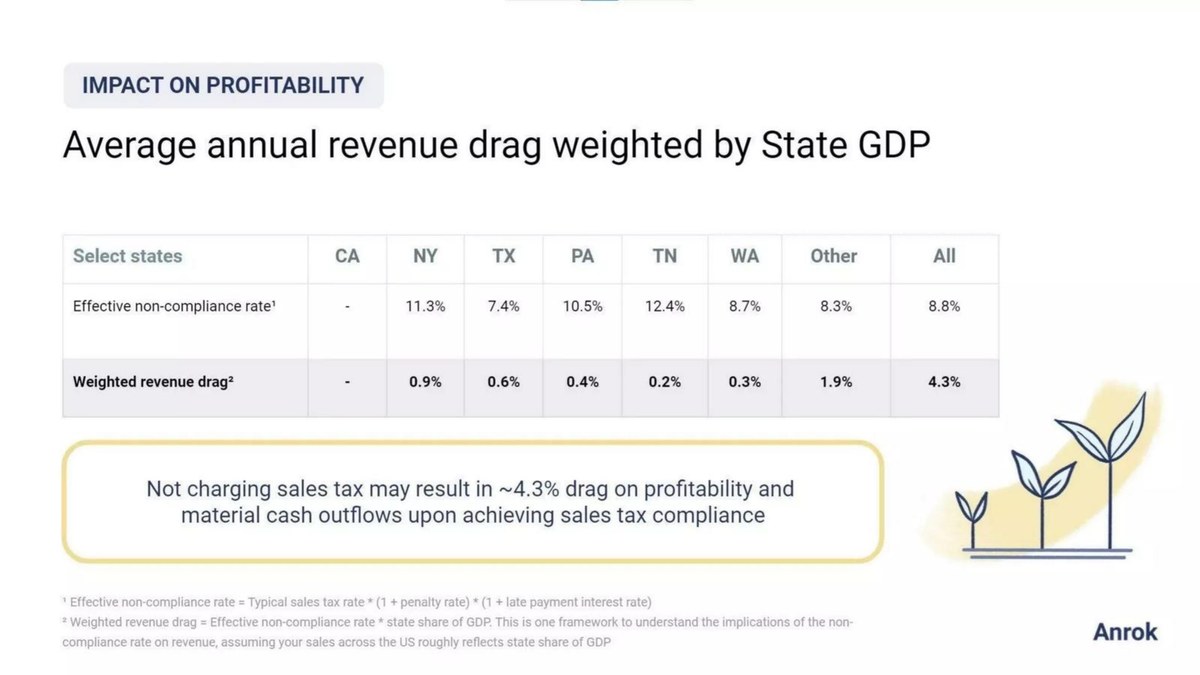
Page 14 shows an 'Effective non-compliance rate' for NY 11.3%, TX 7.4%, PA 10.5%, TN 12.4%, WA 8.7%, 'Other' 8.3% and 'All' 8.8%, with California shown as '-'. Beneath it, 'Weighted revenue drag' is 0.9%, 0.6%, 0.4%, 0.2%, 0.3%, 1.9% and 4.3% for 'All'. Footnotes define the first row as 'Typical sales tax rate * (1 + penalty rate) * (1 + late payment interest rate)' and the second as that rate times 'state share of GDP', 'assuming your sales across the US roughly reflects state share of GDP'. The box reads: 'Not charging sales tax may result in ~4.3% drag on profitability and material cash outflows upon achieving sales tax compliance.'
The six drag figures do add to 4.3%. Dividing each drag by its rate gives the GDP shares the table implies: about 8% each for New York and Texas, 4% for Pennsylvania, 3% for Washington, 2% for Tennessee and 23% for 'Other' — roughly 48% in total (our arithmetic, from rounded figures). So the 4.3% averages the cost over the whole U.S. economy, counting about half of it, including California, at zero. The figure measures uncollected tax plus penalties and interest as a share of revenue; calling it a drag on 'profitability' would fit only if every dollar of revenue were profit. It also applies from the first dollar of sales, while page 9 shows states only require collection above thresholds such as $100K of sales.
The lesson for founders: when you size the cost of a problem, say what the number is a share of, show who it applies to, and use the same rules you explained earlier in the deck.
Six pages of the deck
Pages with the presenter's photograph and the stock image are not reproduced.
Anrok executive summary slide — slide 8
SaaS sales tax, about 2021. Definitions.
Anrok deck, slide 8. Exact stored slide matched to this analysis.
Our analysis: Our reading: sets up the two triggers.
Evidence and limitation: Clear definitions.
What a founder can adapt: Keep it this simple.
Supporting analysis
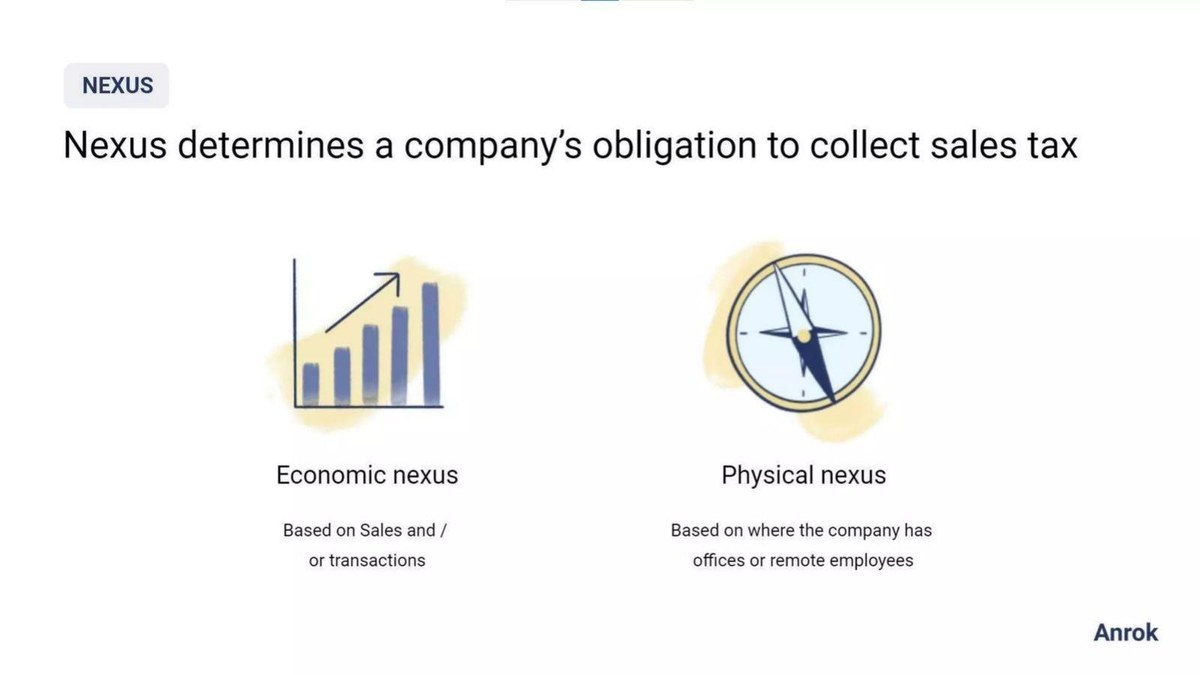
What the deck claims: Economic nexus (sales or transactions) and physical nexus (offices or remote employees).
Presentation choice: Readers need terms before numbers.
When it does not fit: Don't drop these triggers from the estimate.
The deck's rates and drags, with the GDP share each implies (our arithmetic, from rounded figures, so approximate).
State
Non-compliance rate
Revenue drag
Implied GDP share
New York
11.3%
0.9%
about 8.0%
Texas
7.4%
0.6%
about 8.1%
Pennsylvania
10.5%
0.4%
about 3.8%
Tennessee
12.4%
0.2%
about 1.6%
Washington
8.7%
0.3%
about 3.4%
Other
8.3%
1.9%
about 22.9%
California and rest
-
-
about 52%, counted as zero
All
8.8%
4.3%
about 48% to 49% taxed
Key Takeaways
Label a cost as a share of revenue or profit, not both.
Show what share of the market sits at zero.
Apply your own thresholds to your own estimate.
Turn the average into a worked example for one customer.
Back 'the only solution' with a comparison.
Check a cost-of-the-problem number
Answer these before putting a cost figure in a deck.
Base. Is it a share of revenue, profit or cash, and is the word the same everywhere?
Coverage. What share of the market contributes zero?
Rules. Have you applied the thresholds you explained?
Example. Is there one worked example a reader can adjust?
Assumptions. Are penalty, interest and period stated?
Copyable framework: For a company with $[sales] a year, above the threshold in [states], not collecting costs about $[n] a year ([x]% of revenue).
Illustrative example 1 — written by us
Before: 'Not charging sales tax may result in ~4.3% drag on profitability'
After: Not charging sales tax could cost about 4.3% of revenue for a company above the threshold in every taxing state, with sales spread like U.S. GDP.
What improved: Our illustrative rewrite. It uses only the deck's own figure and footnote assumptions, and names revenue as the base.
The question this guide answers
Our teardown of this deck calls it a masterclass in regulatory-driven market creation. No other guide uses it. This walkthrough asks a specific question: when a deck builds its whole case on a single 'cost of doing nothing' figure, how was that figure made, does the label match the method, and what would make it useful to the reader deciding whether to act?
This is a different question from guides about market size or traction. The 4.3% isn't a market estimate; it is the deck's measure of the customer's pain. Every page before it leads to it, and every page after it sells the remedy.
How we read the deck
We rendered all 22 pages of the original file and read them on a four-column contact sheet at about 427 pixels per page. We read pages 8, 9, 12 and 17 to 20 at 150 dpi, and page 14, the table, at 300 dpi to check every figure and footnote. The deck has no date. Page 18 shows a sample alert dated 7 June 2021, so it is probably from 2021 or later; that is our estimate.
The deck's own disclaimer says its figures 'are estimates' based on each jurisdiction's website, and that Anrok is not providing tax advice. We report its figures as written and don't check them against state law. Nothing here is tax advice. Pages 1 and 3 show the presenter's photograph and page 6 a stock image; we don't reproduce them. We make no claim about the company's funding or results.
Step one: who is speaking, and why now
Page 1: 'Anrok — Navigating sales tax for SaaS'. Page 2 sets out three questions: 'Why do software companies need to worry about sales tax now? When should startups tackle sales tax? What strategies are there for quantifying impact and understanding exposure?' Page 3 introduces Michelle Valentine, CEO and co-founder. Page 4, 'About Anrok', lists Sequoia and Index Ventures as backers, Forbes and TechCrunch as press, and three reasons it is 'chosen for': accuracy for SaaS, end-to-end automation and customer experience.
Our reading: the three questions are a strong structure, and the deck returns to them as section dividers (pages 5, 10, 13 and 15). The 'chosen for' list has no customer count or names, so it is a positioning statement rather than evidence.
Step two: the law and the thresholds
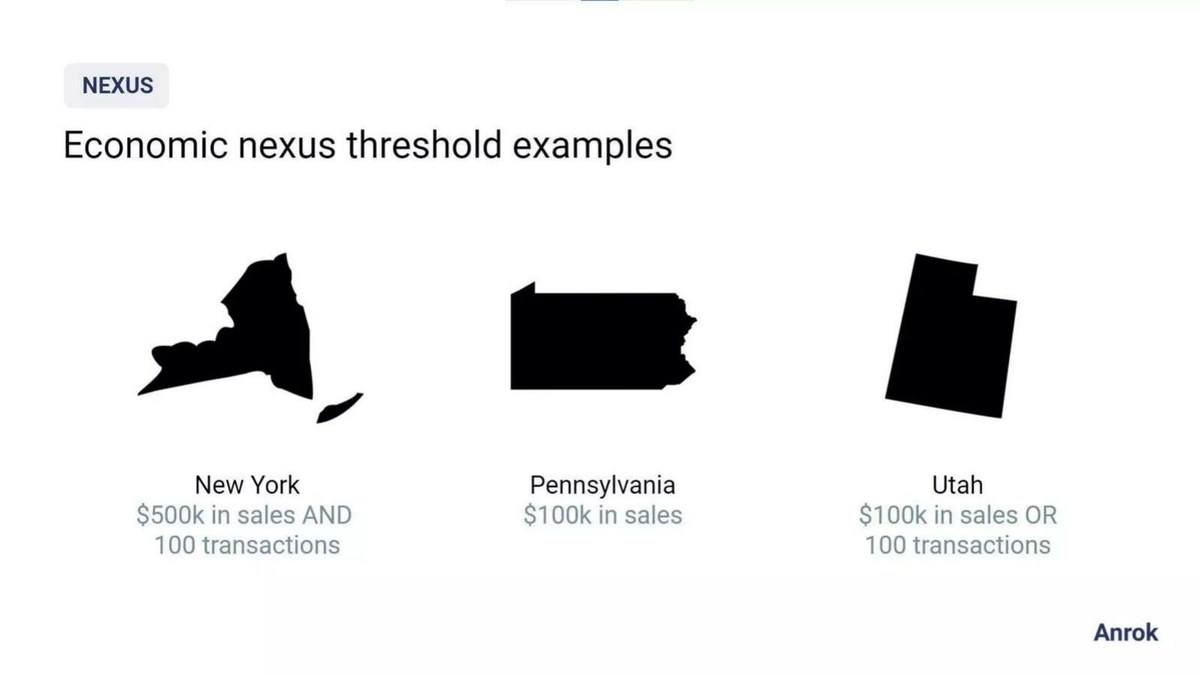
Page 7: 'Since the 2018 South Dakota v. Wayfair Supreme Court case, SaaS companies have to collect and remit sales tax based on physical and economic presence.' Page 8 defines 'Economic nexus — based on sales and / or transactions' and 'Physical nexus — based on where the company has offices or remote employees'. Page 9, 'Economic nexus threshold examples', shows New York '$500k in sales AND 100 transactions', Pennsylvania '$100k in sales' and Utah '$100k in sales OR 100 transactions'.
Our reading: page 9 is the deck's most useful page for a reader. It shows that the obligation starts at a threshold, and that thresholds differ — one uses 'AND', one 'OR', one sales alone. A company with $80K of sales in Pennsylvania, on these figures, wouldn't need to collect there. Keep that page in mind: the 4.3% on page 14 doesn't use it.
Step three: 'It depends'
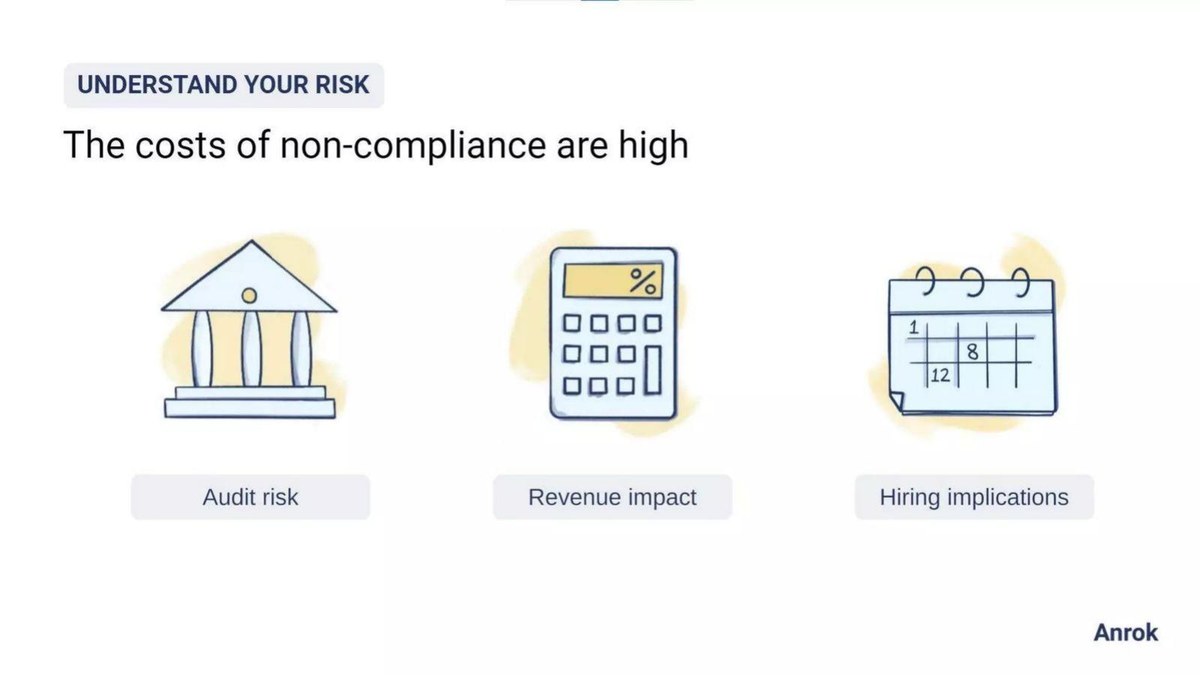
Page 11 answers 'When should startups tackle sales tax?' with 'It depends. What is your exposure? What is your risk tolerance?' Page 12, 'The costs of non-compliance are high', names three costs: audit risk, revenue impact and hiring implications.
Our reading: 'It depends' is honest, and it is the right answer. It also sets up a promise: the next section should help a reader work out their own exposure. Page 12 names three costs but quantifies only one of them, revenue impact, on page 14. Audit risk and hiring implications have no figures.
Step four: the table
Page 14, headed 'Impact on profitability — Average annual revenue drag weighted by State GDP', is the core of the deck. Its figures and footnotes are quoted in the answer above. The method is set out in two footnotes, which is good practice: a reader can see exactly how the numbers were built.
The first row multiplies a typical tax rate by one plus a penalty rate and one plus an interest rate. The second multiplies that by the state's share of U.S. GDP. 'All' in the second row is the sum of the columns: 0.9 + 0.6 + 0.4 + 0.2 + 0.3 + 1.9 = 4.3. That checks.
Working backwards shows what the 4.3% covers. New York's 0.9% drag divided by its 11.3% rate implies an 8.0% share of GDP; Texas 8.1%; Pennsylvania 3.8%; Tennessee 1.6%; Washington 3.4%; 'Other' about 22.9% (our arithmetic, from the deck's rounded figures, so each is approximate). Together, about 48%. The rest of the U.S. economy, including California, marked '-', counts as zero. The 8.8% 'All' rate in the first row, divided into the 4.3%, gives the same answer: about 49%.
What the 4.3% is, and isn't
It is a share of revenue. If a company sells $1M a year spread across the U.S. like GDP, never collects sales tax, and later pays the tax plus penalties and interest on all of it, the table suggests about $43,000 a year. That is a clear and useful framing.
It isn't a share of profit. The box calls it a '~4.3% drag on profitability'. A company with a 20% profit margin losing 4.3% of revenue loses about a fifth of its profit, which is a much bigger-sounding number; a loss-making company has no margin to drag. The page title says 'revenue drag'; the box says 'profitability'. Both can't be the measure.
It isn't conditional on thresholds. The calculation applies from the first dollar in every taxing state, while page 9 shows obligations start at $100K or more. For a startup below the thresholds in most states, the real figure could be far lower; for one above them everywhere, close to the table. The deck says it 'depends' on page 11, then gives one number on page 14.
It isn't company-specific. The footnote is careful: 'This is one framework... assuming your sales across the US roughly reflects state share of GDP'. A software company with most customers in California and Texas would get a very different result. The deck doesn't contradict itself here; it simply doesn't show the reader how to swap in their own sales mix.
A version a customer could use
The same table could carry a worked example: 'A company with $[x] of annual sales, [y]% in New York and [z]% in Texas, above both thresholds, would owe about $[n] a year if it didn't collect.' Or a simple rule: 'For each state where you pass the threshold: sales there × rate × penalty × interest.' Those bracketed values are blanks; the deck doesn't give a sample company and we don't invent one.
Changing 'profitability' to 'revenue' in the box would cost nothing and match the page title. Adding 'about half of U.S. GDP sits in states shown as zero here' would help readers understand that the 4.3% is an average that already includes many states where they owe nothing.
Step five: from risk to product
Page 16, 'The path to compliance', leads to page 17, 'The journey with Anrok', which compares 'The Path Forward' (nexus survey and exposure analysis, registration, calculation, returns, remittance) with 'The Anrok Approach' (real-time nexus monitoring, guided registration, calculations across your tech stack, auto file returns, auto pay).
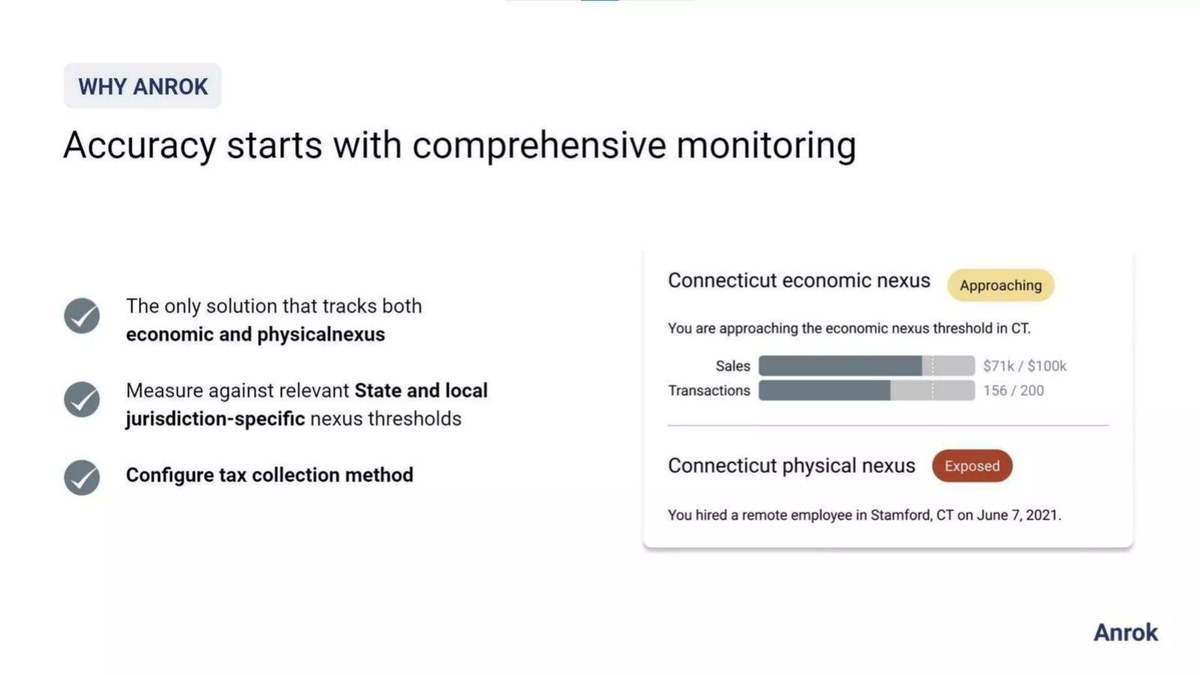
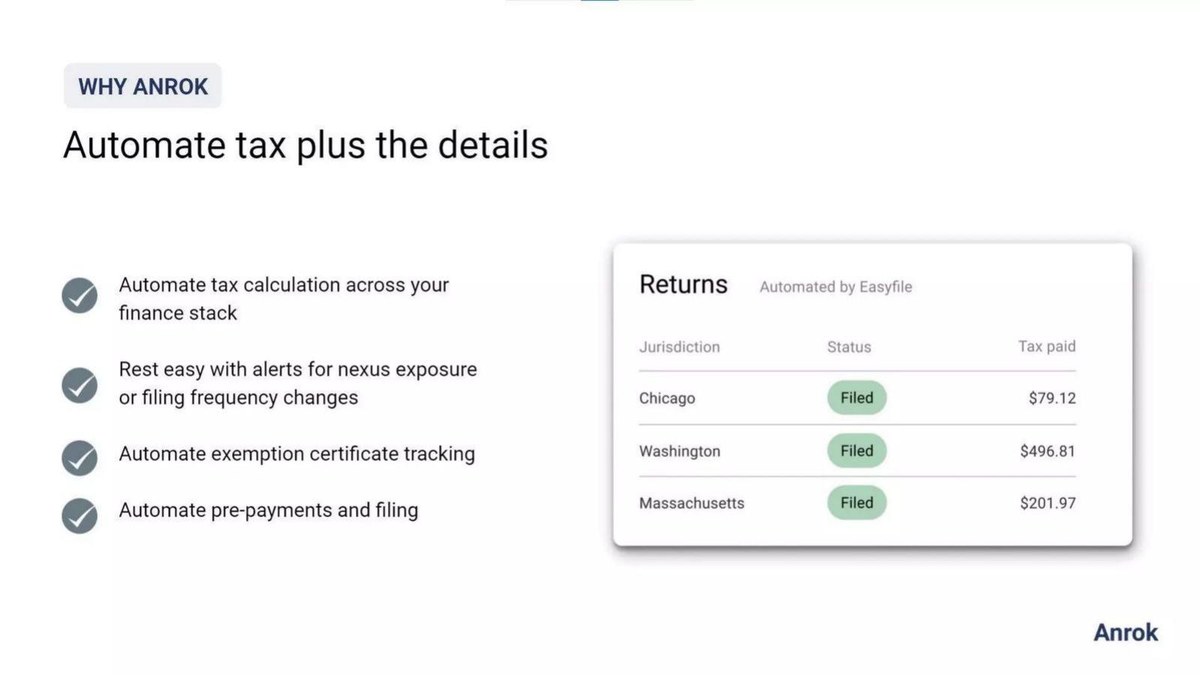
Page 18, 'Accuracy starts with comprehensive monitoring', claims Anrok is 'the only solution that tracks both economic and physical nexus', with a sample panel: Connecticut economic nexus 'Approaching' at $71K of $100K sales and 156 of 200 transactions, and Connecticut physical nexus 'Exposed' after a remote hire. Page 19 shows automated returns for Chicago, Washington and Massachusetts. Page 20 shows a registrations panel.
Our reading: page 18 is where the deck finally uses thresholds — the sample company is at 71% of a $100K threshold. That is the per-company view page 14 lacks, and putting the two side by side would make the 4.3% concrete. 'The only solution' is an unsupported claim on the page; no competitor is named.
How the pages connect
The structure is clear: the law changed; obligations start at thresholds; the cost depends on exposure; here is an average cost; here is a tool that tracks your exposure. The weak link is between pages 9 and 14. Page 9 teaches the reader that thresholds decide whether they owe anything; page 14 then gives a number that ignores them. Page 18 brings thresholds back for the product. Connecting page 14 to page 18 — average cost, then your cost — would let the central number do the job the deck sets for it.
What a reader would ask next
Is the 4.3% a share of revenue or profit? Which states are counted as zero, and why is California '-'? Which penalty and interest rates were used, and for how many years? How does the figure change for a company below the thresholds in most states? Can I enter my own sales mix? Who else tracks physical nexus? For an investor reading this as a company deck: how many customers use Anrok, and what do they pay?
What the deck proves, and what it leaves open
Shown: a clear explanation of the 2018 legal change, specific state thresholds, an honest 'it depends', a transparent formula with footnotes that add up, and a product that tracks exposure against thresholds. Left open: whether the headline cost is a revenue or profit figure, how it changes with thresholds and sales mix, the penalty and interest assumptions, evidence for 'the only solution', and any customer or revenue figures.
Building a cost-of-the-problem number
Show the formula, as Anrok does. Name the base — revenue, profit or cash — and use the same word everywhere. Say what share of the market contributes zero. Apply the rules you've explained, such as thresholds. Then give one worked example the reader can adjust, so the average becomes their number.
Common mistakes
Revenue labelled as profit. Use one base.
Hidden zeros in an average. Say what share is zero.
Thresholds ignored. Apply your own rules.
No worked example. Show one company.
'The only solution'. Name what you compared.
Diagnostic checklist
The base of the cost figure is named consistently.
The share of the market at zero is stated.
Thresholds are applied.
Penalty, interest and period are given.
A worked example is included.
Uniqueness claims are backed by a comparison.
Frequently asked questions
Does Anrok's 4.3% figure add up?
Yes. The six state and 'Other' drag figures on page 14 sum to 4.3%.
Is 4.3% a share of profit?
No. By the deck's own formula it is uncollected tax plus penalties and interest as a share of revenue, though the box calls it a drag on 'profitability'.
Why does 4.3% sit below the 8.8% rate?
Because it is weighted by GDP share, and about half of U.S. GDP, including California, is counted as zero (our arithmetic).
Does the 4.3% use the sales thresholds?
No. It applies from the first dollar, while page 9 shows thresholds such as $100K of sales.
Is this an investor pitch deck?
It reads as a customer-education deck presented by the CEO. It has no raise, revenue or customer figures.
How we chose these examples
Selection (2026-10-02): no guide uses this deck. The question here — how a single cost-of-the-problem figure is built, and whether its label matches its method — is distinct from existing guides.
All 22 pages of the original deck file were rendered and read on a four-column contact sheet at about 427px per page; pages 8, 9, 12 and 17 to 20 were read at 150 dpi and page 14 at 300 dpi (AI editorial model review, not human). Pages 8, 9, 12, 14, 18 and 19 are reproduced, stored for this draft on 2026-10-02 from the original file at 1200×675.
Figures are reported as written and not checked against state law; implied GDP shares are our arithmetic from the deck's rounded figures. Nothing here is tax advice. The deck's date is our estimate.
Eligibility: private company deck, already in our library with an existing teardown; removal requests on file (24) were checked and none mention Anrok. Pages with the presenter's photograph and a stock image are not reproduced; the contact pages are not reproduced.