Revenue Forecast Growth Rates: Check the Year-Over-Year
$7K to $18.8M in four years. Four real projection slides show how to work out the yearly growth your forecast implies.
Forecast Growth Rates on a Pitch Deck: Work Out the Jumps Before an Investor Does
A five-year revenue forecast is a series of bars, but an investor reads it as a series of growth rates. The first thing many do is divide each year by the one before it. If a jump looks unexplained, the whole forecast loses weight. This guide uses four real projection slides to show how to do that arithmetic yourself, where the hardest jumps usually sit, and what to put on the slide so each step has a reason behind it.
TL;DR
Before you show a revenue forecast, divide each year by the previous one and look at the multiples. Then check three things: the step from your last real year to your first forecast year, the steepest single year, and whether growth slows as revenue gets bigger. Put the driver behind each step on the slide, such as customers times price. Evvnt's slide labels 2018 as actual and 2019 to 2023 as forecast, so a reader can see the plan starts from $1.1M of real revenue and rises 1.7x, 2.4x, 2.7x, 1.6x and 1.5x. Lincsphere shows paying users beside sales, so each jump is explained by user growth at a constant $50 a user. ConnectU Media's revenue rises 55x in one year with no label saying which years are real.
Four projection slides, with the multiples worked out
Each slide was rendered from the original deck at full size and read in full. Multiples are our calculations from the figures shown; none was checked against company accounts.
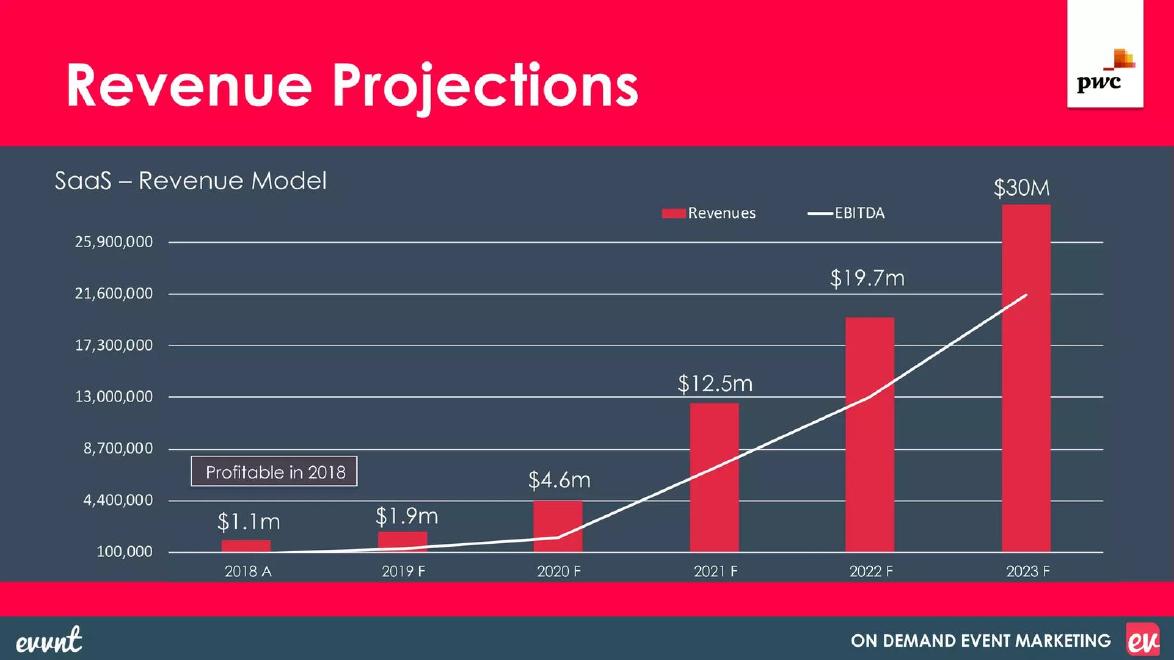
Evvnt financials slide — slide 11
Event marketing software. Revenue and EBITDA, 2018 actual to 2023 forecast.
Evvnt deck, slide 11. Exact stored slide matched to this analysis.
Our analysis: Clear actual and forecast labels; the steepest year (2021) is not explained.
Evidence and limitation: Our multiples: 1.7x, 2.4x, 2.7x, 1.6x, 1.5x; about 27x over five years, roughly 94% a year compounded.
What a founder can adapt: Add one line naming the cause of the steepest year, and show year-to-date results for the current year.
Supporting analysis
What the deck claims: "2018 A" $1.1m; "2019 F" $1.9m; "2020 F" $4.6m; "2021 F" $12.5m; "2022 F" $19.7m; "2023 F" $30M; "Profitable in 2018"; EBITDA line without values.
Presentation choice: Shows the value of marking the actual starting year.
When it does not fit: Leaving the biggest jump without a reason.
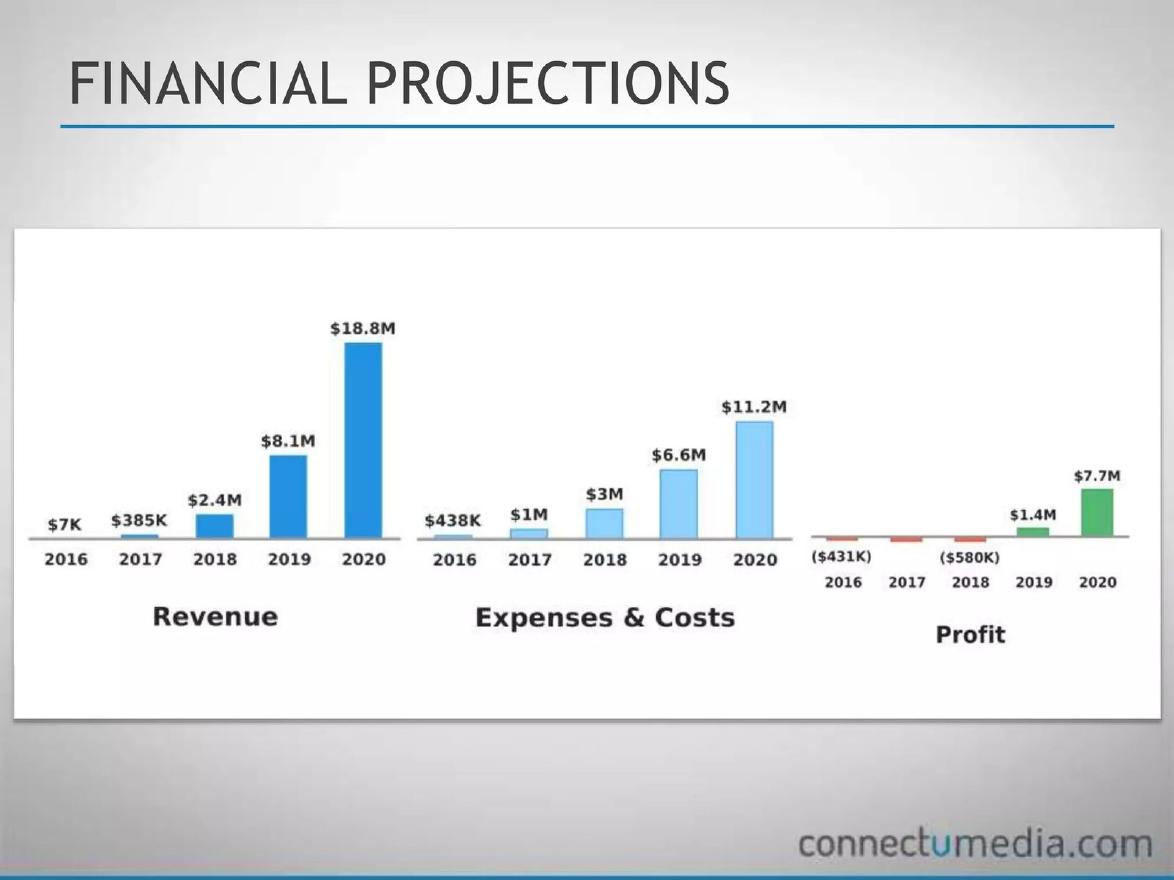
Community app builder. Revenue, costs and profit, 2016 to 2020.
ConnectU Media deck, slide 11. Exact stored slide matched to this analysis.
Our analysis: A sensible slowing shape, dominated by one 55x step whose status is unclear.
Evidence and limitation: Our multiples: 55x, 6.2x, 3.4x, 2.3x. Profit figures roughly match revenue minus costs. 2020 margin about 41%. No actual or forecast labels.
What a founder can adapt: Label actual years and explain why costs grow more slowly than revenue in later years.
Supporting analysis
What the deck claims: Revenue $7K, $385K, $2.4M, $8.1M, $18.8M; expenses and costs $438K, $1M, $3M, $6.6M, $11.2M; profit ($431K), unlabelled loss, ($580K), $1.4M, $7.7M.
Presentation choice: Shows why actual years must be marked when the first step is steep.
When it does not fit: A first-year jump the reader can't place as a result or a plan.
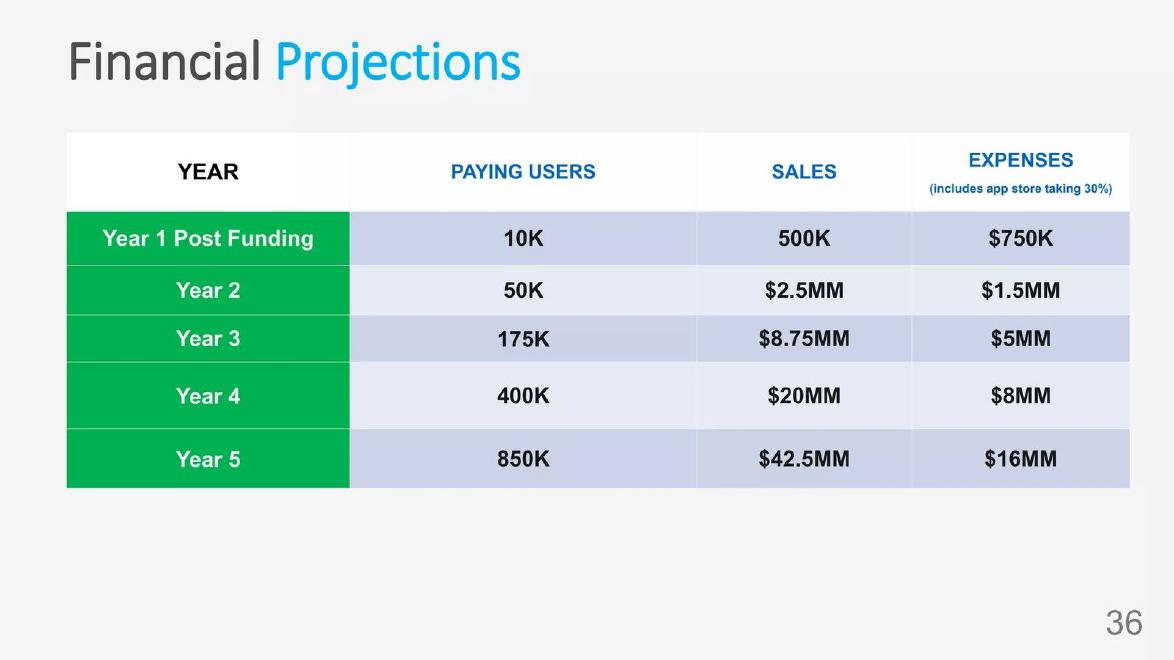
Personal CRM app. Five-year table of paying users, sales and expenses.
Lincsphere deck, slide 32. Exact stored slide matched to this analysis.
Our analysis: Growth fully explained by a driver; costs look too low once the store fee is taken out.
Evidence and limitation: Sales ÷ users = $50 every year. Multiples 5x, 3.5x, 2.3x, 2.1x. A 30% app store fee would be $12.75M of Year 5's $16M expenses.
What a founder can adapt: Keep the driver column, add today's users as a baseline, and split store fees from other costs.
Supporting analysis
What the deck claims: Year 1 Post Funding to Year 5: paying users 10K, 50K, 175K, 400K, 850K; sales 500K, $2.5MM, $8.75MM, $20MM, $42.5MM; expenses ("includes app store taking 30%") $750K, $1.5MM, $5MM, $8MM, $16MM.
Presentation choice: Shows how a driver column lets a reader test every step.
When it does not fit: Cost totals that leave almost nothing for acquisition.
Free-item marketplace app. Advertising revenue forecast for Years 1, 3 and 5.
FreeSpot deck, slide 6. Exact stored slide matched to this analysis.
Our analysis: A driver is shown, but skipped years hide the steep early growth.
Evidence and limitation: Revenue per user about $0.22, $0.22, $0.20. Assuming even growth: users about 3.2x a year to Year 3, then about 1.7x; revenue about 3.2x, then about 1.65x. Source link points to a used-goods store report.
What a founder can adapt: Show all five years, give today's user count and avoid calling ad income ARR.
Supporting analysis
What the deck claims: "$109K Year 1: 500K Users"; "$1.1M Year 3: 5M Users"; "$3M Year 5: 15M Users"; "more than 1M ARR by Year 3"; note on AdMob earnings, time in app and 20% active users.
Presentation choice: Shows what skipping years conceals.
When it does not fit: Three headline figures in place of a full forecast.
Whether the reader can find the starting point, the steepest step and its cause.
Example
Actual years marked
Steepest step
Driver shown
Evvnt
Yes (2018 A)
2.7x into 2021
No
ConnectU Media
No
55x into 2017
No
Lincsphere
No baseline (Year 1 post funding)
5x into Year 2
Yes (paying users)
FreeSpot
No
About 3.2x a year to Year 3 (assumed even)
Yes (users)
Key Takeaways
Work out the multiple for every year: next year ÷ this year.
Mark which years are actual and which are forecast.
Explain the steepest jump; it is the one investors will ask about.
Show the driver (customers, users, price) beside revenue.
Check that costs and margins move with the growth you claim.
Test your own forecast
Fill this in before the forecast goes into the deck.
Baseline. What is your last full year of revenue, and your current monthly run rate?
Multiples. What is next year ÷ this year, for every forecast year?
Peak. Which year has the biggest multiple, and what causes it?
Driver. Which numbers (customers, users, price) produce each year's revenue?
Costs. Do costs grow enough to deliver that growth, including fixed fees?
Copyable framework: "[Year] F: $[revenue] ([multiple]x), driven by [driver change]. Last actual: [year] A $[revenue]."
Illustrative example 1 — written by us
Before: "2021 F: $12.5m"
After: "2021 F: $12.5m (2.7x), driven by [named cause]. Last actual: 2018 A $1.1m."
What improved: Our illustrative rewrite of Evvnt's label. The multiple is calculated from the slide; the cause is left blank because the slide doesn't give one.
The question this guide answers
Founders ask how fast a revenue forecast can grow before investors stop believing it. There is no rule for that, and we don't give one here. What we can show is how investors test a forecast: they turn the bars into yearly multiples and look for steps the slide doesn't explain. This guide shows how to run that test on your own numbers before you send the deck.
Our financials guide covers what a projection slide should contain, and our scenarios guide covers best, base and worst cases. Our market growth guide checks compound growth rates in market sizing. None of them looks at the growth each forecast year implies, which is the subject here.
How we chose and read the examples
We searched saved slide text in the teardown library for revenue projection and forecast slides with at least three yearly figures. Most results with marked actual and forecast years came from listed companies and SPAC merger decks; we excluded those, because they weren't startups when the decks were made. From the private-company slides, we kept four that show four different growth patterns: a forecast built on one actual year (Evvnt), a steep chart with no actual or forecast labels (ConnectU Media), a table that shows a driver beside revenue (Lincsphere) and a slide that skips years (FreeSpot).
Each slide was rendered from the original deck at full size and read in full. Every multiple and growth rate in this guide is our own calculation from the figures on the slide. We didn't check any figure against company accounts, and we don't know whether any company reached its forecast. We judge only what the slide lets a reader work out.
How to do the arithmetic
For each year, divide revenue by the previous year's revenue. A result of 2.0 means revenue doubles; 1.5 means it grows by half. Write these multiples in a row under the chart, even if you don't show them to investors. The pattern is more revealing than any single figure.
Then work out the compound annual growth rate over the whole forecast: divide the last year by the first, raise the result to the power of one over the number of years, and subtract one. This is a single summary number, but it hides the shape. A forecast that grows 10x in year two and 1.2x after that has the same compound rate as one that grows steadily, and the two tell very different stories.
Three checks matter most. First, the bridge: how does the first forecast year compare with the last real year, or with the current run rate? Second, the peak: which year has the biggest multiple, and what happens that year? Third, the shape: do the multiples get smaller as revenue gets bigger? Most companies find it harder to double $20M than to double $2M, so a forecast whose multiples rise in later years needs a strong reason.
A forecast tied to one real year: Evvnt
Evvnt's slide, "Revenue Projections" with the subtitle "SaaS – Revenue Model", shows red bars for revenue and a white line for EBITDA from 2018 to 2023. The x-axis labels are "2018 A", "2019 F", "2020 F", "2021 F", "2022 F" and "2023 F". The bars are labelled $1.1m, $1.9m, $4.6m, $12.5m, $19.7m and $30M. A box reads "Profitable in 2018". A PwC logo sits in the corner; the slide doesn't say what PwC's role was.
The A and F labels are the slide's main strength. A reader knows the forecast starts from $1.1M of real revenue, not from a guess. Our multiples: 1.7x into 2019, 2.4x into 2020, 2.7x into 2021, then 1.6x and 1.5x. Over five years revenue rises about 27x, a compound rate of roughly 94% a year.
The pattern shows where the questions will come. Growth speeds up for three years before slowing, and the steepest year, 2021, adds almost $8M, more than seven times all of 2018's revenue. The slide doesn't say what changes that year: a new product, a sales team, a partner channel. One line under the 2021 bar would answer the question before it is asked.
There is also a timing detail. The deck's file name suggests it dates from June 2019, which means part of the 2019 forecast had already happened. Showing the first half of 2019 as actual, or the current monthly run rate, would have let readers check the first forecast step against real results. The slide's left axis also runs in odd steps (100,000 to 25,900,000) and the $30M bar rises above the top gridline, which makes the axis harder to read than the bar labels; the labels carry the information.
Steep growth with no actual years marked: ConnectU Media
ConnectU Media's slide, "Financial Projections", has three bar charts for 2016 to 2020. Revenue: $7K, $385K, $2.4M, $8.1M, $18.8M. Expenses and costs: $438K, $1M, $3M, $6.6M, $11.2M. Profit: ($431K) in 2016, an unlabelled loss in 2017, ($580K) in 2018, then $1.4M and $7.7M.
The multiples tell the story at once: 55x from 2016 to 2017, 6.2x, 3.4x and 2.3x. The shape is right; growth slows as revenue gets bigger. But the first step dominates the chart. Going from $7K to $385K is the kind of jump that is common when a product has only just launched, and also the kind that is easy to project and hard to achieve. Nothing on the slide says which years have happened, so a reader can't tell whether $385K is a result or a plan.
The profit chart can be checked against the other two. 2016's ($431K) matches $7K minus $438K. 2018's ($580K) is close to $2.4M minus $3M, which gives about ($600K); the gap may be rounding in the bar labels. 2020's $7.7M is close to $18.8M minus $11.2M ($7.6M). The figures hang together, which helps.
The margin is the bigger question. Revenue grows 2.3x in 2020 while costs grow 1.7x, so profit reaches about 41% of revenue. That may be possible for an app business, but the slide gives no reason why costs would grow more slowly than revenue. A forecast that grows quickly and becomes very profitable at the same time needs both claims explained.
Growth explained by a driver: Lincsphere
Lincsphere's slide, "Financial Projections", is a table with four columns: Year, Paying Users, Sales and Expenses ("includes app store taking 30%"). Year 1 Post Funding: 10K users, 500K sales, $750K expenses. Year 2: 50K, $2.5MM, $1.5MM. Year 3: 175K, $8.75MM, $5MM. Year 4: 400K, $20MM, $8MM. Year 5: 850K, $42.5MM, $16MM.
The table does something the other slides don't: it puts the driver next to revenue. Dividing sales by paying users gives exactly $50 in every year. So every jump in revenue comes from user growth, and the reader can see that. The multiples are 5x, 3.5x, 2.3x and 2.1x for both users and sales, and they shrink as the business grows. That is the pattern this guide recommends.
The table also lets an investor check the costs, and here it is weaker. If the app store takes 30% of sales, that alone is $12.75M in Year 5, leaving $3.25M of the $16M for everything else: staff, marketing, servers. In Year 4, the app store's share is $6M of $8M, leaving $2M. Acquiring 450,000 new paying users in Year 5 with about $3M of non-store spending implies very cheap acquisition, which the deck would need to support.
Two smaller points. "Year 1 Post Funding" means the table has no current baseline, so the reader can't see how far Year 1 is from today. And the constant $50 a user is an assumption worth stating outright: does it mean no price change in five years, or an average across tiers?
Skipped years hide the shape: FreeSpot
FreeSpot's slide, "Revenue Projections", shows three large figures: "$109K, Year 1: 500K Users", "$1.1M, Year 3: 5M Users" and "$3M, Year 5: 15M Users". The headline reads "Through Google Ad Mob revenue alone, we plan to be reach more than 1M ARR by Year 3!" A note says the projections are "based on estimates from average application earnings through Google Ad Mob adjusted to our current stats (time in app (2;30avg), percentage of active users(20%))."
Like Lincsphere, FreeSpot shows a driver. Revenue per user is about $0.22 in Years 1 and 3 and $0.20 in Year 5, so the forecast is mostly a user forecast. By skipping Years 2 and 4, though, the slide hides how growth is spread. Users rise 10x from Year 1 to Year 3; if that happens evenly, it is about 3.2x a year. Then they rise 3x over the next two years, about 1.7x a year. Revenue follows a similar path: about 3.2x a year, then about 1.65x. A reader has to do this arithmetic to find out that the forecast assumes the user base keeps growing more than threefold a year for two years.
The wording also needs care. Advertising income isn't recurring revenue in the way subscription income is, so calling it ARR may mislead. And the source link at the bottom of the slide points to an IBISWorld report on used-goods stores, not to the advertising earnings the note describes. The note about "current stats" is useful; giving the current number of users would have been more useful, because it is the starting point for the 10x jump.
What to put on your forecast slide
Label actual and forecast years. An "A" and "F" after each year, as Evvnt does, costs nothing and answers the reader's first question. If the current year is part-way through, show the year-to-date figure or the current monthly run rate.
Show every year. Skipping years, as FreeSpot does, hides the steepest steps. If space is short, use a table rather than three large numbers.
Put the driver beside revenue. Customers or users, and revenue per customer, turn a revenue line into a model a reader can test. Lincsphere's table is the clearest example in this set.
Explain the peak. Find your largest multiple and write one line about what causes it. If you can't name a cause, the forecast may need to change.
Check that costs agree. If revenue grows faster than costs, profit margin rises. Make sure you can explain why, and check fixed fees such as app store or payment charges against total costs.
How to judge your own multiples
We don't set a maximum growth rate, because the right number depends on stage, market and starting size. A product that has only just launched can grow many times over in a year from a tiny base; a company already at several million in revenue rarely does. What investors look for is consistency: does each multiple follow from the driver, the team and the money being raised?
A practical test is to compare the first forecast year with your recent history. If revenue has grown 2x in the past year, a forecast of 5x next year needs a reason the slide can name: new funding, a new channel, a signed contract. If the forecast's first step is roughly in line with recent growth, the later years will be judged more kindly.
Also tie the forecast to the ask. If the forecast's steepest years come after the money runs out, the plan depends on another raise. Our runway guide covers that check.
What these examples can and cannot show
These four slides show what a reader can and can't work out from a projection slide. We don't know whether any company met its forecast, what investors thought, or how the forecasts were built. We didn't check any figure against company accounts. Every multiple is our own calculation from the figures shown, rounded to one decimal place; where a slide skips years, the yearly rates assume even growth between the years shown.
The lesson is about the arithmetic a reader will do. A forecast that survives it, with each step explained, is more persuasive than a steeper one that doesn't.
Common mistakes
Unmarked actual years. Label each year A or F.
Skipped years. Show every year so steep steps are visible.
Unexplained peak. Name what causes the biggest multiple.
Rising multiples. Growth that speeds up at larger size needs a strong reason.
Costs that don't follow. Check fees and acquisition spending against growth.
Diagnostic checklist
Every forecast year shown.
Actual and forecast years labelled.
Multiples worked out for each year.
Steepest year explained on the slide.
Driver shown beside revenue.
Costs checked against growth.
Frequently asked questions
How fast can a startup revenue forecast grow?
There is no fixed limit. Investors care whether each year's growth follows from a stated driver and from your recent results.
Should I show year-over-year growth on the slide?
It helps, but at minimum work out the multiples yourself, because investors will.
What if I have no revenue yet?
Show the driver (expected customers and price) for each year, and explain the first year most carefully.
How we chose these examples
Corpus: published pitch deck teardowns on StartupFundraising.com. Founder-uploaded private decks are excluded.
Selection (2026-10-01): we searched extracted slide text for revenue projection and forecast slides with at least three yearly figures, excluded listed-company and SPAC presentations, and kept four private-company slides showing four different growth patterns.
Review: the four slides were rendered from the source decks at full size on 2026-10-01 and read in full against company, deck and page number (editorial model review, with AI assistance in drafting). All multiples and growth rates are our calculations from the figures shown; none was checked against company accounts. No person has yet completed a human editorial review of this draft.