How to Show Uptime in a Pitch Deck: Measured Results vs SLA
A 99.99% uptime figure and a 99% SLA are different claims. Two real software decks show how to state uptime so an investor knows whether it was measured.
How to Show Uptime in a Pitch Deck: Measured Results vs SLA Promises
If you sell software that customers depend on, investors will want to know whether it stays up. Founders usually answer with a percentage: 99.9%, 99.99%, 'four nines'. But the same kind of number can mean two very different things. It can be a result you measured over a past period, or it can be a promise in a contract, a service level agreement (SLA), about what you will deliver in future. This guide answers one founder question: how do you present uptime on a slide so an investor can tell which it is, how long it was measured for and which part of the service it covers? It uses two slides: Cloudsmith, a software package management company, which states a measured figure with its period in a footnote; and Airbyte, a data integration company, which lists an SLA as a feature of a paid plan.
TL;DR
Say whether the figure is measured or promised. If measured, give the period, the part of the service it covers and how it was measured (your own monitoring or an outside status page). If promised, say which plan or customers it applies to, what it covers and what happens if you miss it. Cloudsmith's footnote, '99.99%+ availability uptime (past 3 months)', is a measured result with a stated window, though the window is short and the method is not given. Airbyte's pricing slide lists '99% SLA support for certified connectors' on one paid plan, which is a promise limited to one plan and one group of connectors, and the wording leaves open whether 99% refers to availability or to support response. Put the measured result and the promise side by side only when you have both, and never let one stand in for the other.
Two software slides that state uptime
Each slide was read at full size from the source deck. Quotes are exact.
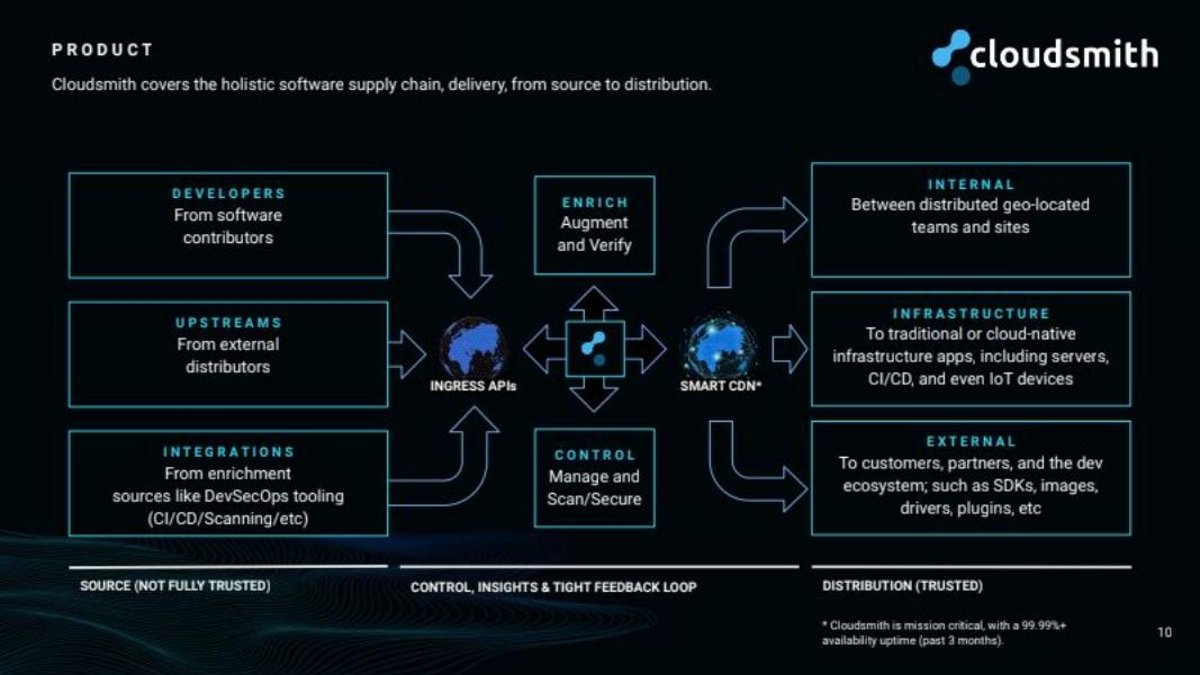
Cloudsmith technology slide — slide 10
Software package management platform. Product page with a supply-chain diagram; uptime appears in a footnote tied to the 'Smart CDN' label. Deck undated in our copy.
Cloudsmith deck, slide 10. Exact stored slide matched to this analysis.
Our analysis: The right kind of uptime evidence, placed where it explains why reliability matters, but too small and too briefly measured to carry much weight.
Evidence and limitation: A measured figure with a stated window, tied to the delivery part of the product. The window is short (by our calculation about 13 minutes of downtime allowed over three months), the method and scope are not stated, and the months are not dated.
What a founder can adapt: Move the figure into the slide body, extend the window to twelve months, and name the part of the service and the monitoring source.
Supporting analysis
What the deck claims: "Cloudsmith covers the holistic software supply chain, delivery, from source to distribution." Footnote: "* Cloudsmith is mission critical, with a 99.99%+ availability uptime (past 3 months)."
Presentation choice: Shows how to state a measured uptime figure with its period.
When it does not fit: Leaving a key reliability result in footnote type with no method.
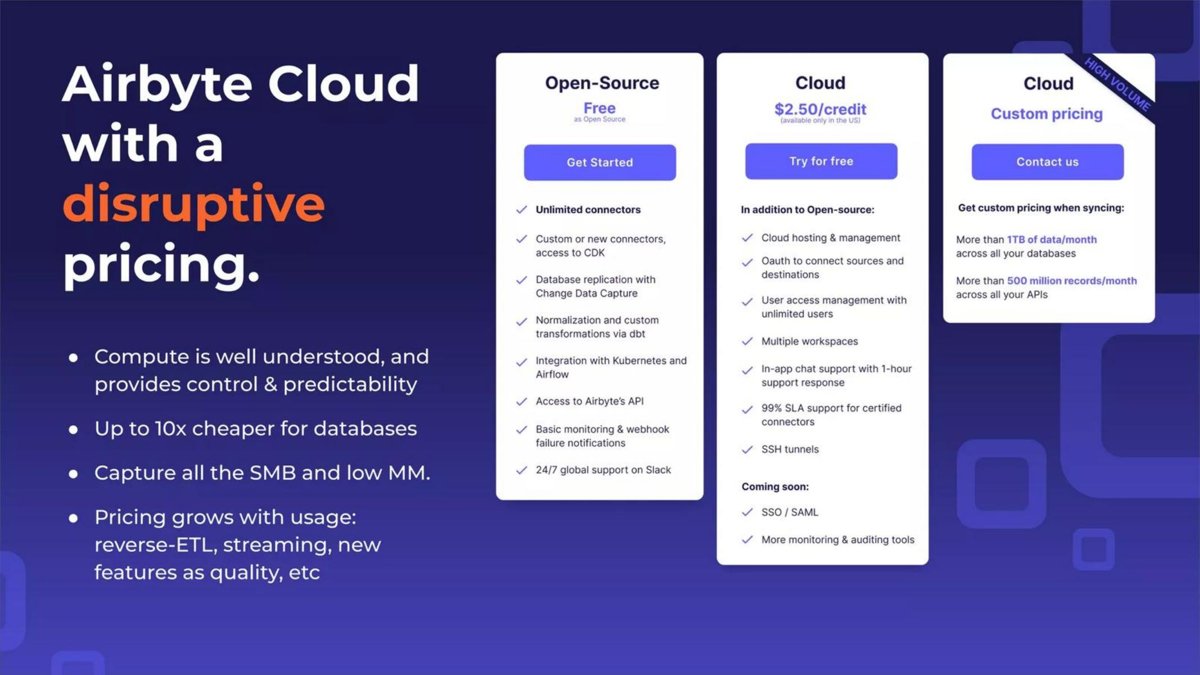
Data integration company, Series B deck. Pricing page with three plans; the SLA appears as a feature of the $2.50-per-credit Cloud plan.
Airbyte deck, slide 15. Exact stored slide matched to this analysis.
Our analysis: A sensible use of an SLA as a reason to pay, which says nothing about the record behind it.
Evidence and limitation: A promise limited to one plan and to certified connectors. The wording does not make clear whether 99% is availability or support. No measured uptime is shown.
What a founder can adapt: Say exactly what the 99% covers, why that level fits customers' use, and add the measured result against it.
Supporting analysis
What the deck claims: "Airbyte Cloud with a disruptive pricing." Cloud plan "$2.50/credit": "99% SLA support for certified connectors"; "In-app chat support with 1-hour support response".
Presentation choice: Shows an SLA presented as a plan feature rather than a track record.
When it does not fit: Letting a contractual promise stand in for evidence of reliability.
Measured or promised, period, scope, method, and what the figure allows in downtime (our calculation).
Example
Measured or promised
Period
Scope stated
Method stated
Downtime allowed (ours)
Cloudsmith p10
Measured
Past 3 months (undated)
Implied: delivery network
No
About 13 minutes over 3 months
Airbyte p15
Promised (SLA)
Not applicable
One plan; certified connectors
Not applicable
About 7.2 hours per 30-day month, if 99% is availability
Key Takeaways
Label every uptime figure as measured (a past result) or promised (an SLA or target).
For a measured figure, give the period, the service covered and the measurement method.
For a promise, give the plan or customers covered, what is covered and the remedy if it is missed.
Translate the percentage into allowed downtime so a reader can judge it: 99% and 99.99% are far apart.
Prefer a period of twelve months or more; three months can miss a rare outage.
Keep hardware failure rates and customer downtime saved out of an uptime figure; they are different measures.
Write your uptime line
Answer these with your own records before you design the slide. They are our recommendations, not steps the example companies took.
Type. Is your figure a measured result, a contractual promise, or an internal target? Label it as such.
Period. Over which dates was it measured? Twelve months or more is stronger than three.
Scope. Which part of the service does it cover: the whole product, the main API, one region?
Method. How was it measured: a public status page, outside monitoring, or internal logs?
Downtime. What does the percentage mean in minutes or hours over the period, and how many incidents caused it?
Promise. If you offer an SLA, who gets it, what does it cover, and what credit applies if you miss it?
Why it matters. What happens to a customer when you are down, and has reliability won or kept specific customers?
Copyable framework: "Measured: [X]% availability for [service], [start date] to [end date], from [monitoring source]; [N] incidents, [Y] minutes in total. Promised: [Z]% SLA for [plan/customers], service credits if missed. Why it matters: an outage stops customers' [process]."
Illustrative example 1 — written by us
Before: Footnote: "Cloudsmith is mission critical, with a 99.99%+ availability uptime (past 3 months)."
After: "Package delivery network: 99.99%+ availability, [month] to [month] [year], measured by [monitor]. Customers' builds stop if we are down, so we report uptime publicly at [status page]."
What improved: Our illustrative rewrite of Cloudsmith's page 10. Bracketed items are not stated in the deck.
The question this guide answers
This guide answers one founder question: my product has to be reliable for customers to trust it, so how do I show uptime in a pitch deck so investors believe the number and know what it means?
Our library covers related topics without answering this one. Our security and data privacy guidance separates audited controls from claims, but it is about security, not availability. Our hardware milestone guidance treats reliability testing as a development stage for physical products. Our case study guidance includes customer results such as fewer missed service levels at a customer, which measure the customer's operations, not the startup's own service. None of them explains how to state the startup's own uptime and tell a measured result apart from a promise.
Demand note: our own search data for the last three months shows no query about uptime or SLAs on a pitch deck; the reliability-related queries we found are about which investors or websites are reliable, which is a different question. This page therefore rests on an editorial hypothesis: that founders of infrastructure and business-critical software need this answer when investors ask about reliability. We have not estimated search volume.
Scope: why this page covers software uptime only
Three kinds of reliability figure appear in startup decks, and they do not measure the same thing. Software uptime is the share of time a service was available. A hardware failure rate counts how often physical units break, often over thousands of operating hours. A customer downtime figure measures how much less time a customer's own operation was stopped after using the product. Putting them in one percentage, or comparing one with another, would mislead.
We considered slides for all three. Chef Robotics' page 11 says its food-assembly robots have made '44,000,000+ servings' with 'unsupervised, high uptime performance', which is a hardware claim with no uptime figure. Aveda Energy's page 10 reports a '64% reduction in rig downtime for customer' from one oilfield case study, which is a customer outcome. Both answer different questions from this page, so neither is used as an example here. We also found a 'greater than four 9s of service uptime' claim in a Cogint presentation, but Cogint was a listed company, so it falls outside our startup corpus.
Measured result or promise: what an investor needs from each
A measured uptime figure is evidence. It tells an investor what customers actually experienced. To be useful it needs four things: the figure, the period it covers, the part of the service it covers (the whole product, the main API, one region) and how it was measured. A public status page or third-party monitoring is stronger than an internal dashboard, because an investor can check it.
An SLA is a commitment. It tells an investor what the company is willing to be held to, and it often matters for selling to larger customers. To be useful it needs the level promised, who gets it (all customers or one plan), what it covers, and the remedy if it is missed, usually service credits. A promise says nothing about whether the company has met it. Missing a promised level can also cost money through those credits, which is worth knowing when you read the financial plan.
Both kinds of figure need translating. A percentage close to 100 hides large differences. Our calculation: over a 30-day month, 99% allows about 7.2 hours of downtime, 99.9% about 43 minutes and 99.99% about 4.3 minutes. Over a year, 99% allows about 88 hours. A reader who sees '99%' and '99.99%' on different slides may think they are close; in downtime terms one allows 100 times more than the other.
A measured figure with its window: Cloudsmith
Cloudsmith sells a platform for storing and distributing software packages. Page 10 of its deck is a product page headed 'Product': 'Cloudsmith covers the holistic software supply chain, delivery, from source to distribution.' A diagram shows sources on the left (developers, upstreams, integrations), Cloudsmith's ingress APIs and 'Smart CDN' in the middle, and destinations on the right (internal teams, infrastructure, external customers). The 'Smart CDN' label carries an asterisk, and the footnote reads: '* Cloudsmith is mission critical, with a 99.99%+ availability uptime (past 3 months).'
This is a measured figure, and the deck says so by giving a past period. It is tied to a point in the product story: the part of the service that delivers packages to customers, which is where an outage would stop customers' builds and deployments. That placement explains why uptime matters to this business without a separate slide.
The limits are clear too. Three months is a short window; our calculation is that 99.99% over about 91 days allows roughly 13 minutes of downtime, and one bad incident just outside the window would not appear. The footnote does not say how uptime was measured, whether it covers the whole platform or only the delivery network, or which three months. The deck is undated in our copy, so we cannot place the window in time. The figure sits in small type at the foot of the page, so a reader can miss what is arguably the slide's strongest evidence.
A promise inside a pricing plan: Airbyte
Airbyte moves data between business systems. Page 15 of its Series B deck is headed 'Airbyte Cloud with a disruptive pricing.' It shows three plans: open source (free), Cloud at '$2.50/credit' and a high-volume Cloud plan with custom pricing. Under the $2.50 Cloud plan, one of the listed features is '99% SLA support for certified connectors', alongside 'In-app chat support with 1-hour support response'.
This is a promise, not a result. It applies to one paid plan and only to 'certified connectors', which implies other connectors carry no such commitment. The wording is also ambiguous: '99% SLA support' could mean a 99% availability commitment or a support commitment, and the slide does not say. Placed on a pricing page, the SLA reads as a feature that justifies paying instead of using the free open-source version, which is a reasonable use of it.
What the slide cannot show is whether Airbyte meets it. No measured uptime appears on this page, and an investor reading it should not treat 99% as a reliability record. As a promise, 99% is also a modest level: our calculation is that it allows about 7.2 hours of downtime in a 30-day month. That may suit batch data syncing, where a delay of hours is tolerable, but a founder should say why the chosen level fits how customers use the product.
What neither slide shows
Neither deck pairs a measured record with a promise. The most convincing presentation would show both: 'We commit to 99.9% for paying customers; over the last 12 months we delivered 99.97%, measured by [outside monitor], with two incidents totalling [X] minutes.' That tells an investor the company sets a promise it can keep, and has kept it.
Neither deck links uptime to a business result, such as larger customers won because of an SLA, or customers lost after an outage. Where a founder has that evidence, it turns uptime from a technical detail into a reason the business can sell upmarket.
Neither deck mentions incidents. An investor doing due diligence on business-critical software will often ask for the incident history behind an uptime figure: how many outages, how long each lasted, what caused them and what changed afterwards. A founder who can summarise that history in one line, for example the number of incidents and total minutes in the period, shows that the figure comes from records rather than memory. Where an outage did happen, saying what was fixed is usually more reassuring than a perfect-looking percentage with no detail behind it.
We can't tell from the slides how investors read them, and we don't infer that either page helped or hurt a fundraise. We did not check either figure against a status page or company records.
Common mistakes
Promise shown as a record. An SLA says what you commit to, not what you delivered.
No period. An uptime figure without dates can't be judged or checked.
A short window. Three months can miss a rare but serious outage.
Unclear scope. Say whether the figure covers the whole service or one part.
Percentages without downtime. 99% and 99.99% look close but differ 100-fold in downtime allowed.
Mixing measures. Hardware failure rates and customer downtime saved are not uptime.
Diagnostic checklist
Each uptime figure labelled measured, promised or target.
Measured figures give dates, scope and method.
Window of twelve months or more where available.
Percentage translated into downtime for the period.
SLA states who is covered, what is covered and the remedy.
Measured record shown next to any promise you make.
Hardware or customer-outcome figures kept separate.
Reliability linked to what customers lose when you are down.
Frequently asked questions
Should I put uptime on its own slide?
Usually not. A line on the product or technology slide, next to the part of the service customers depend on, is enough. Give it its own slide only if reliability is the main reason customers choose you.
What uptime figure do investors expect?
It depends on how customers use the product. A payment or delivery service needs more than a nightly batch job. Explain why your level fits your customers rather than quoting a number for its own sake.
I'm pre-launch. Can I show a target?
Yes, if it is clearly labelled as a target and you explain how the design supports it. Don't present it alongside measured figures from other companies as if it were comparable.
Is a public status page worth linking?
Yes. It lets an investor check the record and shows you are willing to be held to it. Make sure it covers the same period and service as the figure on the slide.
How we chose these examples
Corpus: published pitch deck teardowns on StartupFundraising.com. Founder-uploaded private decks are excluded. Listed-company presentations were excluded.
Selection (2026-10-02): we followed earlier leads from slide-text searches for uptime, availability, SLA, reliability, downtime and 'four 9s', read the candidate pages at full size, and kept startup slides where the startup states its own software uptime. Chef Robotics page 11 (hardware, unquantified) and Aveda Energy page 10 (customer downtime) were considered and left out as different measures; Cogint page 16 was left out as a listed-company presentation; ANYbotics page 16 mentions customer plant uptime only in passing.
Demand: our search data for the past three months shows no uptime or SLA query for this site; the page rests on an editorial hypothesis. No search volume is estimated.
Review: Cloudsmith page 10 was rendered from the source deck at 250 dpi and its footnote read enlarged; Airbyte Series B page 15 at 200 dpi. Both were checked against company, deck and page number (editorial model review, with AI assistance in drafting; not human-reviewed). No figure was checked against a status page or company records. Downtime calculations are labelled as ours. We checked our removal-request records before using either deck; none concerns these companies.