Source Line on a Traction Slide: Say Where Your Own Numbers
How should a pitch deck show where its own traction numbers come from? Four real slides show how to name the system, the dates and the definition.
Metric Source Line: Name the System, the Dates and How Each Number Was Counted
Founders are taught to cite sources for market figures, but their own traction numbers often appear with no source at all. A small line under a chart, saying which system the number comes from, what dates it covers and how it was counted, makes the figure checkable in due diligence and answers the first question an investor asks. This guide uses four real slides to show what that line should say, and how a source line can mislead when it mixes measurement tools.
TL;DR
Under every traction chart, add one line naming the system the figures come from, the dates covered and any definition or exclusion. Bukalapak's "Source: Google analytics" under monthly pageviews is the minimum; Aircall's "excl micro-customers" and "*Gross Retention computed between months 3-11 and then annualized" shows the fuller version. Never compare your own analytics with estimates for competitors from a different tool without saying so.
Four traction slides and their source lines, read in full
Each slide was rendered from the original deck at full size and read in full. We checked Bukalapak's growth multiples against its bars; we did not check any figure against the companies' analytics.
Bukalapak traction slide — slide 5
Indonesian online marketplace. Growth slide.
Bukalapak deck, slide 5. Exact stored slide matched to this analysis.
Our analysis: The minimum source line, done right.
Evidence and limitation: Tool named, dates on the axis, multiples match the bars.
What a founder can adapt: Say whether figures are monthly totals, and add a transaction figure from the order system.
Supporting analysis
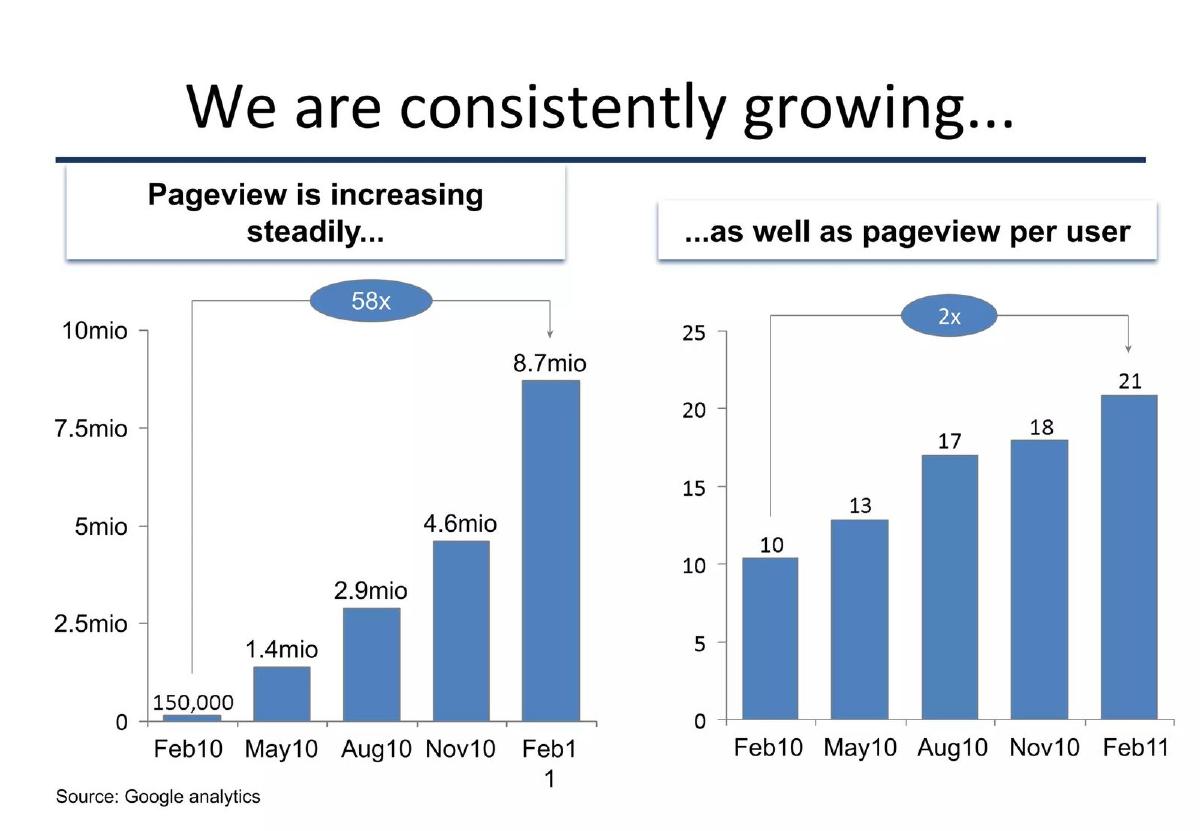
What the deck claims: "We are consistently growing..."; pageviews Feb10 to Feb11: 150,000, 1.4mio, 2.9mio, 4.6mio, 8.7mio, "58x"; pageview per user 10 to 21, "2x"; "Source: Google analytics".
Presentation choice: An investor knows exactly where to check the figures.
When it does not fit: Relying on attention metrics alone for a marketplace.
Cloud phone software. Retention slide, Series C deck.
Aircall deck, slide 16. Exact stored slide matched to this analysis.
Our analysis: The fuller source line: definition instead of tool.
Evidence and limitation: Exclusion and calculation method stated for gross retention; no method for net retention.
What a founder can adapt: Add a method footnote for every calculated figure, and the date the data was pulled.
Supporting analysis
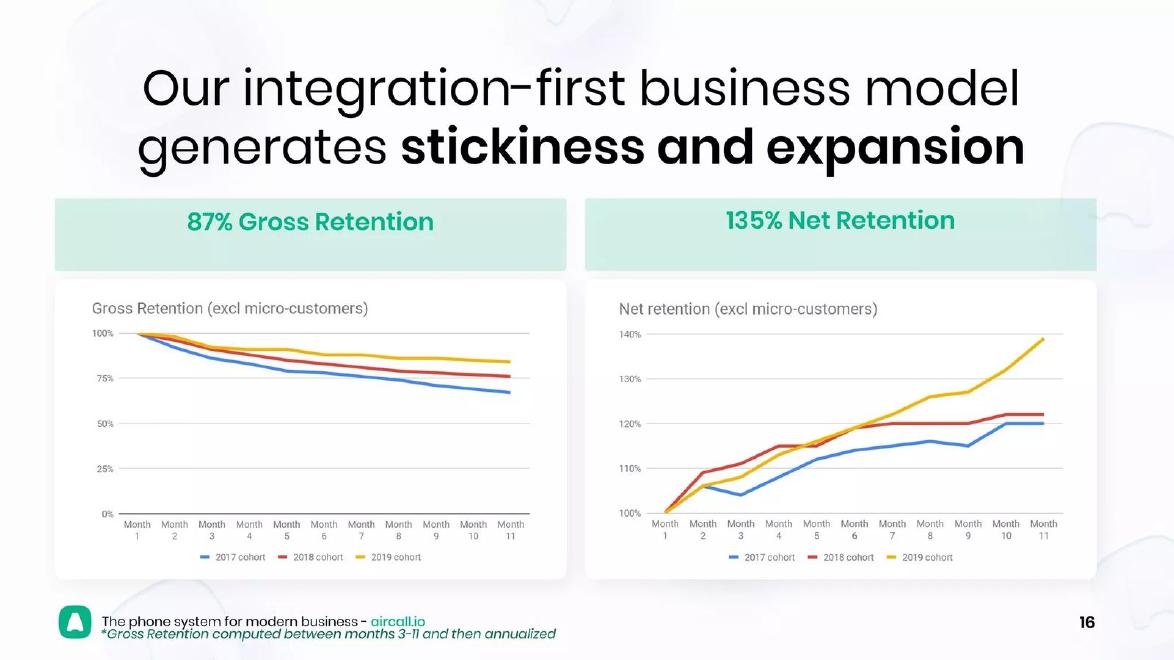
What the deck claims: "87% Gross Retention"; "135% Net Retention"; charts "(excl micro-customers)" by 2017, 2018 and 2019 cohort; "*Gross Retention computed between months 3-11 and then annualized".
Presentation choice: Tells the investor which follow-up questions to ask.
When it does not fit: Explaining one headline figure and not the other.
Umamao deck, slide 17. Exact stored slide matched to this analysis.
Our analysis: A source line that makes the figures look checked while chart and claim differ.
Evidence and limitation: Tool and dates named; both lines end below the 1K gridline at the Feb point.
What a founder can adapt: State the exact dates behind the claim so chart and text agree.
Supporting analysis
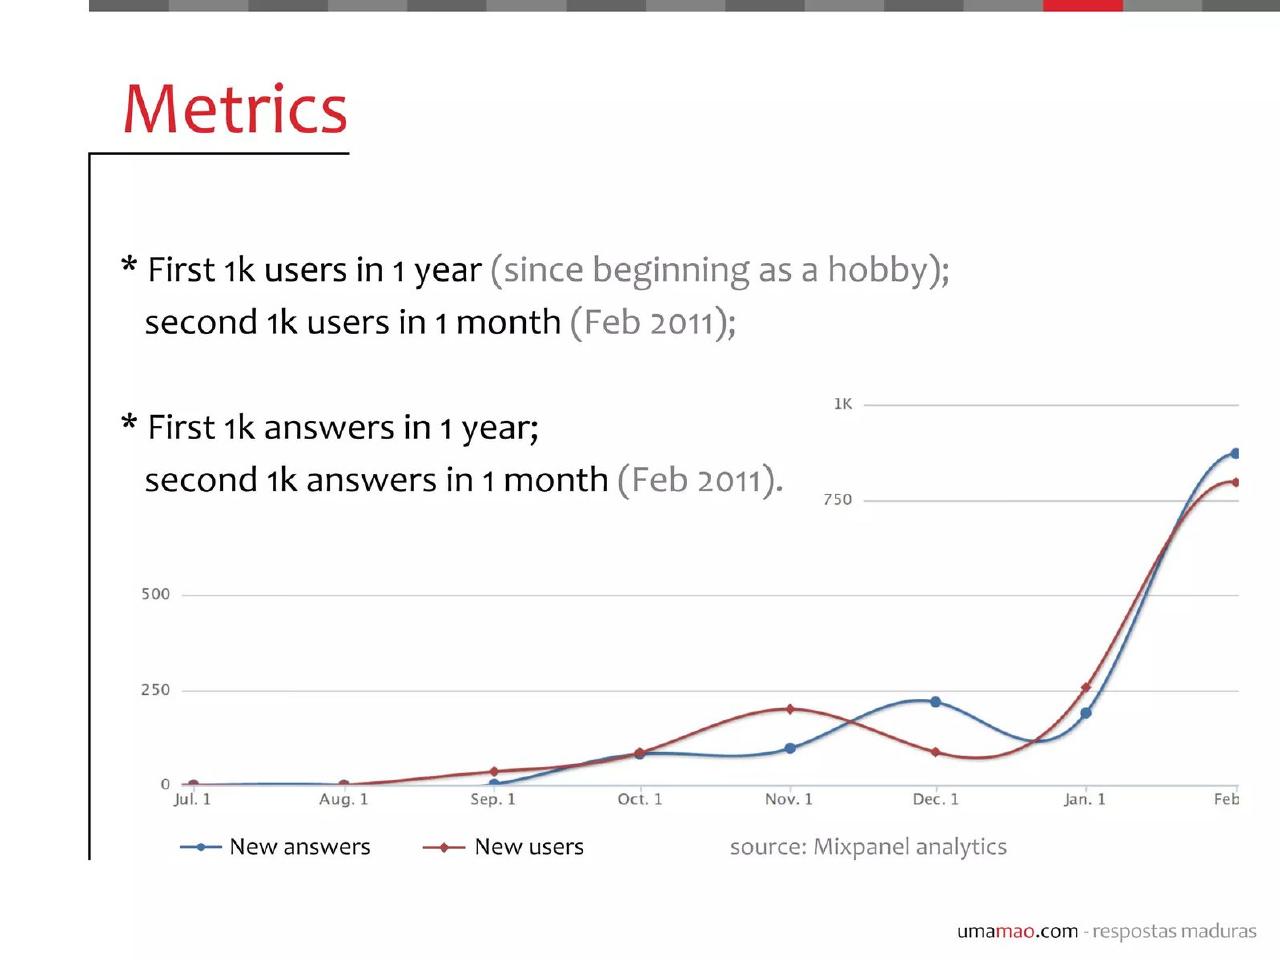
What the deck claims: "First 1k users in 1 year (since beginning as a hobby); second 1k users in 1 month (Feb 2011)"; same for answers; chart of new answers and new users, Jul. 1 to Feb; "source: Mixpanel analytics".
Presentation choice: Shows the need to read each claim against its own chart.
When it does not fit: Headlines and charts prepared separately and never reconciled.
Indonesian online marketplace. Competitor comparison slide.
Bukalapak deck, slide 6. Exact stored slide matched to this analysis.
Our analysis: A warning: two measurement tools compared as if equal.
Evidence and limitation: Own analytics and a third-party estimate in one chart, with anonymous competitors.
What a founder can adapt: Use one tool for every bar, say which, and show your own analytics separately.
Supporting analysis
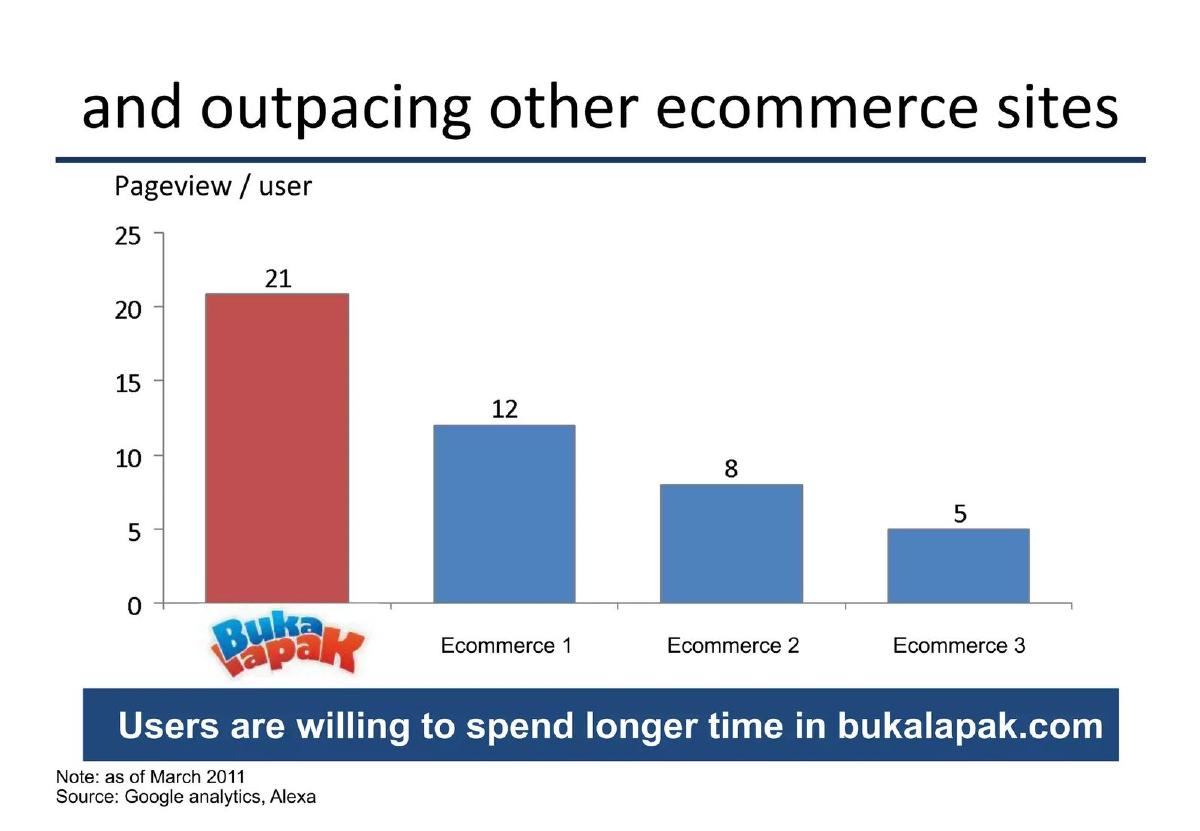
What the deck claims: "and outpacing other ecommerce sites"; pageview per user: Bukalapak 21, "Ecommerce 1" 12, "Ecommerce 2" 8, "Ecommerce 3" 5; "Users are willing to spend longer time in bukalapak.com"; "Note: as of March 2011"; "Source: Google analytics, Alexa".
Presentation choice: Shows how a source line can hide a mismatch rather than prevent it.
When it does not fit: Calling pages per user "time spent".
Whether each slide names the system, gives dates, states definitions, and has a chart that supports its claim.
Example
System named
Dates
Definition or exclusion
Chart supports claim
Bukalapak growth
Google Analytics
Yes
No
Yes
Aircall
No
Cohort years
Yes, gross only
Yes
Umamao
Mixpanel
Yes
No
Not clearly
Bukalapak comparison
Two tools, unassigned
March 2011
No
Mixed measures
Key Takeaways
Name the system each traction figure comes from.
Give the dates the figures cover.
State any exclusions or calculation method.
Make sure the chart supports the headline claim.
Do not compare figures from different measurement tools as if equal.
Write a source line for each traction chart
Answer each prompt for every figure on your traction slides.
System. Which tool or record produced this figure?
Dates. What period does it cover, and when was it pulled?
Definition. What is counted and what is excluded?
Method. If calculated, how?
Match. Does the headline claim match the chart for the same dates?
Copyable framework: Source: [system], [start] to [end], [frequency]. [Excludes x.] [Figure calculated as y.]
Illustrative example 1 — written by us
Before: "Revenue up 4x" with no source line.
After: "Source: Stripe, Jan to Jun 2024, monthly gross revenue; excludes refunds. 4x = June vs January."
What improved: Our illustrative rewrite; the figures are invented for the example. It names the system, dates, exclusion and method.
The question this guide answers
Founders ask how to show investors that their own traction numbers are real. Our traction guides cover which metrics to show, our market guides cover citing outside research, and our retail traction guide says to name third-party sales data such as SPINS. None covers the source line for a company's own figures: which tool produced them, over what dates, and how they were counted.
This matters because investors will ask for access to the same system in due diligence. A deck that names the tool and the dates tells the investor exactly what to check, and signals that the founder expects the numbers to hold up. A deck that names nothing leaves the investor guessing whether a figure is from analytics, a spreadsheet or memory.
How we chose and read the examples
We searched saved slide text in the teardown library for source lines naming analytics or internal systems, such as "Source: Google Analytics", "Mixpanel", "internal data" and "company data". We left out listed companies and their investor presentations, and one deck whose company may already have been listed when it was made. We added one slide we had already read for another guide, Aircall's retention chart, because its footnote defines the calculation rather than naming a tool. Four slides from three startup decks remained.
The examples are Bukalapak (an Indonesian online marketplace, two slides), Umamao (a Brazilian question-and-answer site) and Aircall (cloud phone software). Each slide was rendered from the original deck at full size and read in full. We checked the growth multiples on Bukalapak's chart ourselves. We did not check any figure against the companies' analytics.
The minimum: tool and dates under the chart
Bukalapak titles a slide "We are consistently growing..." and shows two charts. The left, "Pageview is increasing steadily...", has bars for Feb10, May10, Aug10, Nov10 and Feb11: 150,000, 1.4mio, 2.9mio, 4.6mio and 8.7mio, with a "58x" arrow from first to last. The right, "...as well as pageview per user", rises from 10 to 21, marked "2x". Under both: "Source: Google analytics".
This is the minimum done right. The reader knows which tool counted the pageviews, the dates are on the axis, and the multiples match the bars: 8.7 million divided by 150,000 is 58, and 21 divided by 10 is 2.1. An investor could ask for read access to the analytics account and see the same figures.
Two additions would help. The slide does not say whether the figures are monthly totals or a point in time, though the axis spacing suggests one month every quarter. And pageviews are a measure of attention, not transactions; on a marketplace, a second line with orders or sales value, from the order system, would show the traffic turns into business.
The fuller version: definitions and exclusions
Aircall's slide is titled "Our integration-first business model generates stickiness and expansion". Two headline figures, "87% Gross Retention" and "135% Net Retention", sit above cohort charts labelled "Gross Retention (excl micro-customers)" and "Net retention (excl micro-customers)", each with lines for the 2017, 2018 and 2019 cohorts over months 1 to 11. A footnote reads: "*Gross Retention computed between months 3-11 and then annualized".
Aircall does not name a tool, but it does something more useful: it tells the reader how the number was calculated and what was left out. "Excl micro-customers" warns that the smallest accounts, which usually churn most, are not counted. The footnote explains that the 87% is a calculated annual figure from months 3 to 11, not a figure read straight off the chart. An investor can now ask the right follow-up questions: what counts as a micro-customer, how much revenue they are, and what retention looks like with them included.
The footnote covers gross retention only. The slide does not say how the 135% net retention was calculated, or over what period. Adding a second footnote for it, and the date the data was pulled, would complete the slide.
A source line that does not settle the claim
Umamao titles its slide "Metrics". Two claims sit at the top: "First 1k users in 1 year (since beginning as a hobby); second 1k users in 1 month (Feb 2011)" and "First 1k answers in 1 year; second 1k answers in 1 month (Feb 2011)". Below, a chart plots "New answers" and "New users" from Jul. 1 to Feb, with a 1K gridline. The source line reads "source: Mixpanel analytics".
The source line is good practice: it names the tool, and the claims give dates. But the chart does not clearly support the claim. Both lines finish below the 1K gridline at the Feb point, while the text says a full second thousand arrived in February. The difference may be explained by dates, for example if the last point is a partial month or the claim counts a different 30 days, but the slide does not say.
This is a common pattern: the source line makes the figures look checked, but the headline and chart were prepared separately and no longer agree. Before sending a deck, read each claim against its chart. If they differ because of timing, say so: "Feb 1 to Mar 2, 2011" would make both readings consistent.
Warning: comparing your analytics with another tool's estimates
Bukalapak's next slide is titled "and outpacing other ecommerce sites". A chart of "Pageview / user" shows Bukalapak at 21, with three competitors labelled only "Ecommerce 1", "Ecommerce 2" and "Ecommerce 3" at 12, 8 and 5. A banner says "Users are willing to spend longer time in bukalapak.com". The notes read: "Note: as of March 2011" and "Source: Google analytics, Alexa".
The two sources measure differently. Google Analytics counts Bukalapak's own visitors from code on its own site. Alexa, at the time, estimated other sites' traffic from a sample of users with a browser toolbar. Putting the two side by side as one chart compares a direct count with an estimate, and the slide does not say which source applies to which bar. The competitors are also anonymous, so the reader cannot check them.
The banner adds a further step: "pageview per user" is a count of pages, not time spent. If you need a competitor comparison, use the same tool for every bar, such as one traffic estimate service for all sites including your own, and say so. Then, separately, show your own analytics figure.
What the source line should say
Keep it to one line in small type under each chart: the system ("Source: Stripe", "Source: Mixpanel", "Source: company accounts, unaudited"), the dates ("Jan 2024 to Jun 2024, monthly") and any definition or exclusion ("excludes free accounts", "annualised from months 3-11"). If a figure is calculated, give the method in a footnote. If figures come from more than one tool, say which applies to which.
Then do the check that the source line implies. Open the system named, pull the same figure for the same dates, and confirm it matches the slide. If an investor asks for access in due diligence, they will do exactly this.
Choosing which system to cite
Cite the system closest to the money or the event you are counting. For revenue, that is the payment processor or the accounting records, not a dashboard built on top of them. For users, it is the product database or the analytics tool that records sign-ups, and you should say which event counts as a user: a sign-up, a verified account or a first purchase. For retention, it is the billing system, with the cohort definition stated.
Where two systems disagree, as analytics and payment records often do because of refunds, trials or tracking gaps, pick one, say which, and keep using it across the deck. An investor who finds one chart from analytics and the next from billing, with neither labelled, will reasonably wonder which figures were chosen because they looked better. Consistency matters more than which tool you pick.
Common objections
"Investors don't read footnotes." Some don't, but the ones who matter in due diligence do, and an unexplained figure is the first thing they ask about. The source line costs one line of small type.
"Naming the tool invites scrutiny." It does, and that is the point. A figure an investor can check carries more weight than one they cannot. If you would not want an investor to see the system, the figure probably should not be on the slide.
"Our numbers come from a spreadsheet." Then say so, and say what the spreadsheet is built from: "Source: monthly revenue export from Stripe, compiled by the company". A plain description is better than none.
Common mistakes
No source on own figures. Name the system each figure comes from.
No dates. Give the period and when data was pulled.
Hidden exclusions. State what is left out of the count.
Claim and chart disagree. Reconcile them for the same dates.
Mixed tools. Do not compare direct counts with estimates.
Diagnostic checklist
System named for every figure.
Dates and frequency stated.
Exclusions and methods footnoted.
Headline claims match charts.
One tool per comparison.
Frequently asked questions
Do I need to cite a source for my own traction numbers?
Yes. Name the system, such as your analytics or payment tool, and the dates, so an investor knows what to check in due diligence.
What if my numbers come from a spreadsheet?
Say so, and say what it is built from, such as a monthly export from your payment system.
Can I compare my traffic with competitors'?
Only with the same tool for every site, including yours. Do not compare your own analytics with outside estimates for rivals.
Where should the source line go?
Directly under the chart in small type, with any calculation method in a footnote.
How we chose these examples
Corpus: published pitch deck teardowns on StartupFundraising.com. Founder-uploaded private decks are excluded.
Selection (2026-10-01): we searched extracted slide text for source lines naming analytics or internal systems, excluded listed-company presentations and one deck of uncertain listing status, and kept three slides from two decks, adding one Aircall slide read earlier for another guide.
Review: all four slides were rendered from the source decks at full size on 2026-10-01 and read in full against company, deck and page number (editorial model review, with AI assistance in drafting). Bukalapak's growth multiples were recalculated from its bars. No person has yet completed a human review. No figures were checked against the companies' analytics.