Own-Brand (Private Label) Margin in a Pitch Deck: How
How a retailer or marketplace should show investors what launching its own brand does to margin: the per-item comparison, proof customers buy it.
Own-Brand Margin: Show the Per-Item Gain, the Adoption Evidence and What It Adds Up To
Retailers, delivery companies and marketplaces often plan to sell products under their own brand because they keep the margin a supplier would otherwise take. In a pitch deck that plan usually becomes one sentence ("private label will improve margins"). Eaze, a California cannabis delivery company, gave it three slides: a per-item margin comparison, launch adoption charts and a profit sizing formula. Read together, they show what an own-brand case needs and where each number can mislead.
TL;DR
Show four things, each on a stated basis. First, the per-item comparison: your landed cost for the own-brand product against the wholesale cost of the branded product it replaces, at the selling price you actually charge, in dollars as well as margin points. Second, the costs only your brand carries (development, packaging, compliance, minimum order quantities, unsold stock, brand marketing). Third, evidence customers choose it: share of the category after launch, over a stated period, in stated stores, in units or dollars. Fourth, the profit impact: the share you expect, on which revenue base, by when, with the ramp rather than a full-year end state.
Eaze shows the first, third and fourth, and its figures check out: $30 retail less a $7.50 house-brand cost is 75% margin, against 60% on a $12 third-party product: a 15-percentage-point difference, or $4.50 more gross profit per item on the slide's stated cost basis. Its sizing formula multiplies correctly ($125M × 40% × 15% = $7.5M), but the result is a conditional estimate, not profit earned. What a reader cannot tell is which months of its share chart are actual, why three different bases (share of GTV, menu share and revenue) are combined in one sizing, and what the brand costs beyond the product itself.
Three slides from one deck that make an own-brand case
All three slides come from Eaze's deck and are shown as they appear in the original. They are read in order: the per-item gain, the evidence customers buy, and the profit sizing.
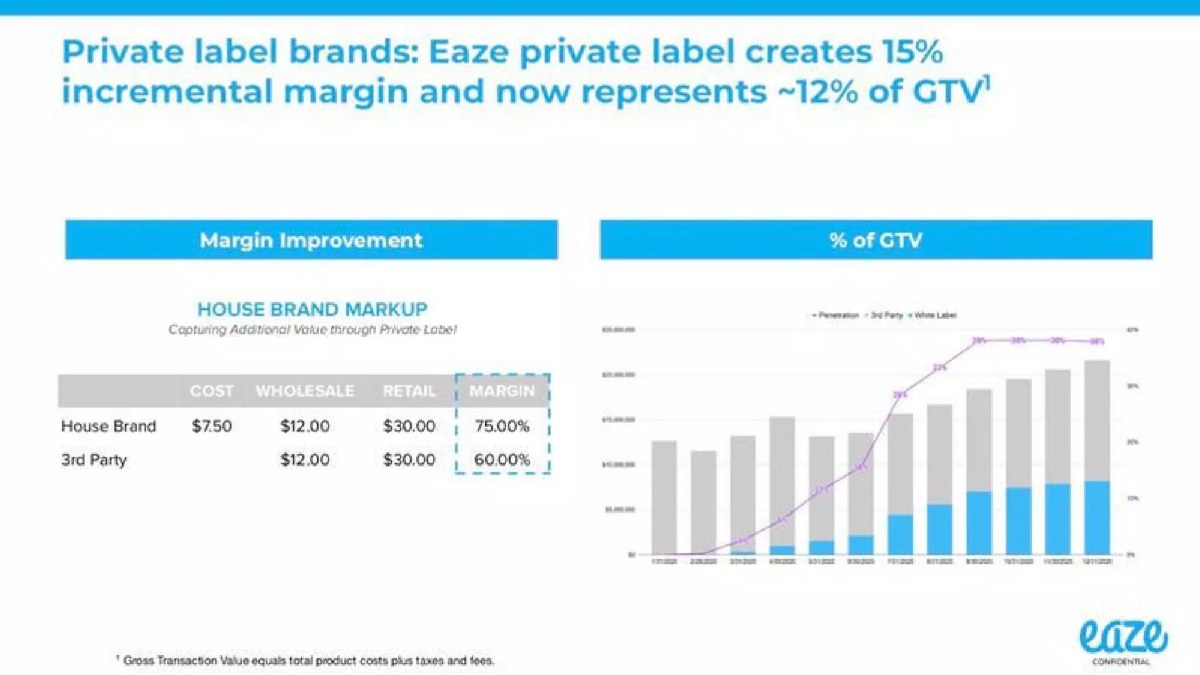
Eaze unit economics slide — slide 7
Cannabis delivery company in California, presenting a shift from marketplace to vertical retailer. Deck page 7 of 15; pages carry an "Eaze Confidential" mark, and the deck has a live teardown on our site.
Eaze deck, slide 7. Exact stored slide matched to this analysis.
Our analysis: A clear per-item comparison at the same retail price, paired with a share chart whose actual and planned months are not separated.
Evidence and limitation: The table adds up: (30 − 7.50) ÷ 30 = 75% and (30 − 12) ÷ 30 = 60%. The house-brand row also lists $12.00 under Wholesale, which reads as the third-party cost it replaces, not a price Eaze pays. Both rows assume the same $30 retail price. The chart's small labels are only partly legible in the source file; the penetration line climbs through roughly 12% and 16% in late spring, to the high 20s and low 30s in summer, and holds at about 38% from September to December. The bars run to December 2020, yet the title says own brand "now" represents about 12%, so some later months may be projected; the slide does not say which months are actual, and the deck's date is not stated. The legend calls the same products "White Label" that the table calls "House Brand".
What a founder can adapt: Keep the table, add the gain in dollars, and mark the chart: solid bars for actual months, hatched or labelled bars for plan, with the date of the deck.
Supporting analysis
What the deck claims: Title: "Private label brands: Eaze private label creates 15% incremental margin and now represents ~12% of GTV". A table, "House Brand Markup: Capturing Additional Value through Private Label": House Brand: Cost $7.50, Wholesale $12.00, Retail $30.00, Margin 75.00%; 3rd Party: Wholesale $12.00, Retail $30.00, Margin 60.00%. A chart, "% of GTV", shows monthly bars from 1/31/2020 to 12/31/2020 (left axis $0 to $25M) split into "3rd Party" and "White Label", with a "Penetration" line on a 0 to 40% axis. Footnote: "Gross Transaction Value equals total product costs plus taxes and fees."
Presentation choice: The table makes the source of the gain visible: the brand captures the $4.50 gap between a $12 wholesale price and a $7.50 product cost. An investor can test each number, which a sentence about "better margins" does not allow.
When it does not fit: A headline percentage that can mean margin points or a relative gain, and a chart running past today with no actual/plan split.
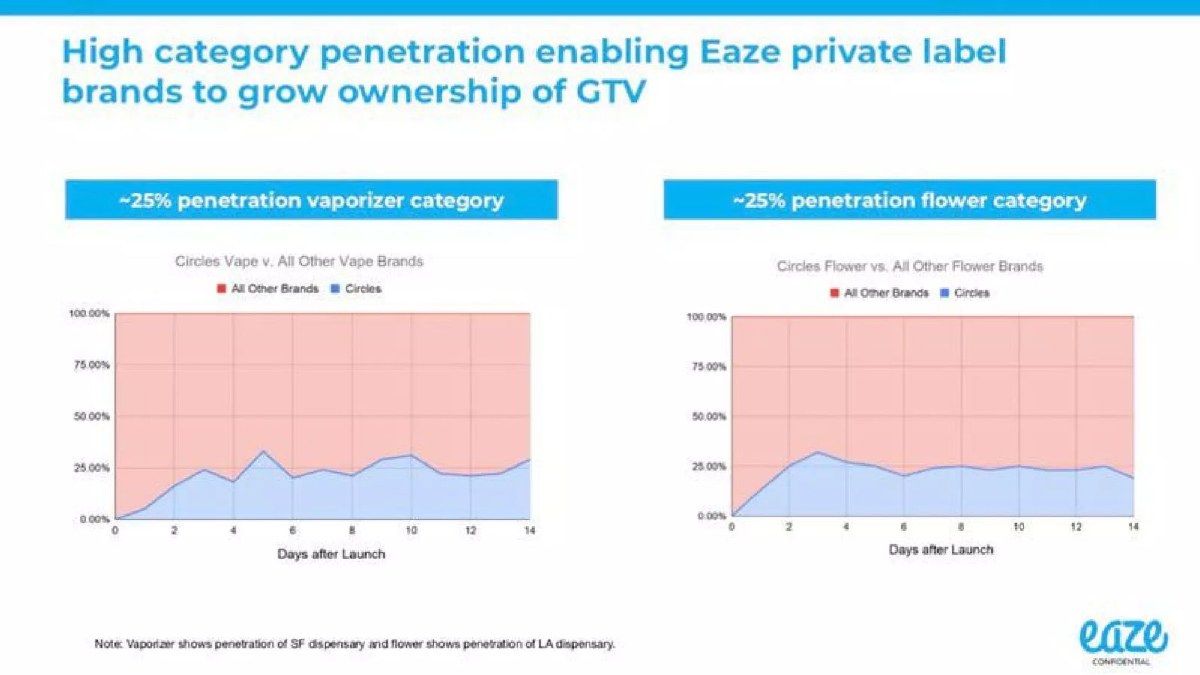
Deck page 8, immediately after the margin table. "Circles" is the Eaze house brand.
Eaze deck, slide 8. Exact stored slide matched to this analysis.
Our analysis: Real launch data that shows customers will try the brand, from a sample too small and too short to show they keep buying it.
Evidence and limitation: Read from the charts: vape share rises from zero to about 25% within three days, peaks near 33% around day 5 and ends near 29% on day 14; flower share peaks near 32% around day 3 and ends near 19% on day 14. Each chart covers one category in one dispensary in one city for two weeks; these are single-shop launch results, not evidence of company-wide adoption. The slide does not say whether share is measured in units, orders or dollars, whether Circles was promoted or given prominent placement at launch, or how many customers bought it again.
What a founder can adapt: State share in dollars, over at least a full repurchase cycle, across every location where the product is sold, and add the repeat rate among first-time buyers.
Supporting analysis
What the deck claims: Title: "High category penetration enabling Eaze private label brands to grow ownership of GTV". Two area charts headed "~25% penetration vaporizer category" ("Circles Vape v. All Other Vape Brands") and "~25% penetration flower category" ("Circles Flower vs. All Other Flower Brands"), each from 0 to 14 "Days after Launch" on a 0 to 100% axis. Note: "Vaporizer shows penetration of SF dispensary and flower shows penetration of LA dispensary."
Presentation choice: The margin table only matters if customers choose the house brand. This slide is the adoption evidence, and its note honestly states the narrow scope, which lets an investor weigh it.
When it does not fit: A "~25%" headline over a line that is falling at the end of the period; give the latest value as well as the peak.
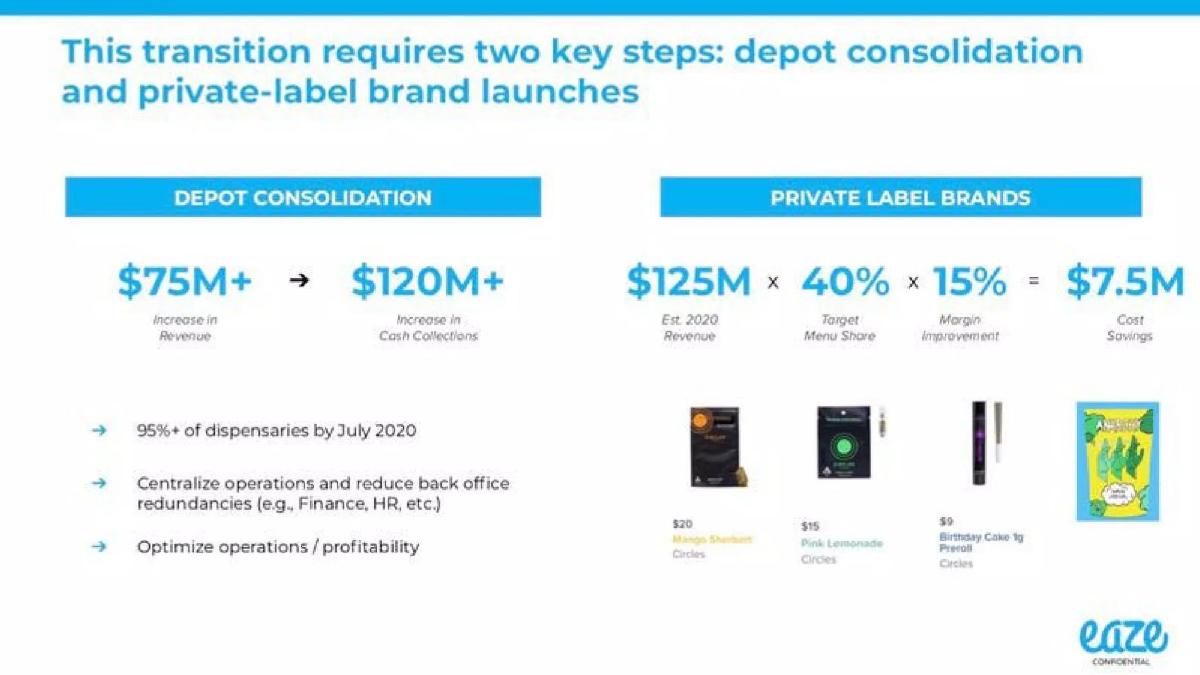
Deck page 5, setting out the two steps in the transition to vertical retailer: depot consolidation and private-label brand launches.
Eaze deck, slide 5. Exact stored slide matched to this analysis.
Our analysis: A transparent one-line sizing that an investor can recompute, built on three inputs measured on different bases and an end-state share.
Evidence and limitation: The multiplication is right: 125 × 0.40 × 0.15 = 7.5. It applies the 40% target share to the whole year, while page 7 says the share is about 12% now; following page 7's own monthly line instead would give a smaller 2020 figure. Its three inputs are measured on bases the deck does not reconcile: a 15-point gain measured against the $30 retail price on page 7, a "menu share" target that is not defined (it could count listed products or sales), and estimated revenue, which on page 9 is product value plus delivery fees. The $7.5M is therefore a conditional estimate of additional gross margin if a 40% share and a 15-point gain held for the whole year on that revenue, not profit earned and not a saving on existing costs. The slide does not say whether any costs specific to running the brand (for example development, compliance, inventory or marketing) are netted out. The target is labelled; the result is not marked as a plan.
What a founder can adapt: Keep the formula, but use product sales excluding taxes and fees, the month-by-month share from your plan, and subtract brand fixed costs; label the result "planned gross margin gain, [year]".
Supporting analysis
What the deck claims: Title: "This transition requires two key steps: depot consolidation and private-label brand launches". Under "Private Label Brands": "$125M (Est. 2020 Revenue) x 40% (Target Menu Share) x 15% (Margin Improvement) = $7.5M (Cost Savings)", above product photos priced $20, $15 and $9 (Circles). Under "Depot Consolidation": "$75M+ Increase in Revenue" and "$120M+ Increase in Cash Collections", "95%+ of dispensaries by July 2020".
Presentation choice: Writing the formula out is what makes the critique possible: every input is visible, so a reader can replace the full-year 40% with the ramp and see the difference.
When it does not fit: Calling a margin gain a cost saving, and multiplying an end-state share by a full year of revenue.
Adoption evidence. Share of category in dollars, stores covered, weeks measured, repeat rate.
Share plan. Actual share today and the planned share by month.
Profit impact. Gross gain from the ramp, minus brand-only costs, labelled as a plan for a stated year.
Copyable framework: Own brand: landed cost $[a] vs $[b] wholesale for the product it replaces, both sold at $[p] → +[x] margin points (+$[d] per item). Share of product sales (ex. taxes): [s0]% actual in [month], plan [s1]% by [month]. Planned [year] gain: $[g] gross, $[n] after $[f] brand costs.
Illustrative example 1 — written by us
Before: Eaze private label creates 15% incremental margin and now represents ~12% of GTV.
After: Our house brand costs $7.50 against $12.00 wholesale for the branded product it replaces, both sold at $30: +15 margin points (+$4.50 per item). Share: about 12% of GTV in [month] (actual); months after [month] are plan.
What improved: Uses Eaze's page 7 figures; the bracketed month is a placeholder. States the gain in dollars and separates actual from plan.
Illustrative example 2 — written by us
Before: $125M × 40% × 15% = $7.5M cost savings.
After: Planned 2020 gross margin gain: $[sales ex. taxes and fees] × [average share from the monthly plan] × 15 points = $[g], before $[f] of brand development, compliance and marketing costs.
What improved: Built on Eaze's page 5 formula; bracketed values are placeholders, not Eaze's figures. Puts every input on one base and uses the ramp.
What this guide covers and what it doesn't
This guide covers one decision a founder has to explain: why selling your own brand changes your economics, and by how much. Our gross margin guide covers which margin to show and on which revenue. Our per-order guide uses Eaze's per-transaction waterfall (deck page 9) to show what one order earns after every cost. Neither explains how to build and test the own-brand case itself: the per-item comparison, the costs that come with owning a brand, the evidence that customers switch, and how a share target turns into profit.
It is also different from white label, where a startup builds a product that another company sells under its name. Here the startup is the retailer or marketplace and is putting its own name on products it used to buy from brands.
Why own brands raise margin, and what they cost
A retailer selling a third-party product keeps the difference between the retail price and the wholesale price. When it sells its own version, it pays a manufacturer to make the product and keeps the difference between the retail price and that cost. If the retail price stays the same, the margin rises by the gap between the wholesale price and the own-brand cost.
That gap is not all profit. The retailer now carries costs the brand owner used to carry: product development and testing, packaging and labelling, regulatory compliance (heavy in cannabis, food and supplements), minimum production runs, inventory that may not sell, and the marketing or placement that makes customers choose it. Some of these are per item and belong in the cost you compare; others are fixed and belong in the profit sizing. An investor will look for both.
Price is the other assumption. Many retailers price their own brand below the branded alternative to win the customer. Every dollar of discount comes straight off the gain. If you assume the same retail price, say so and show why customers will pay it. (Corporate Finance Institute)
Margin points, dollars and relative gains
Eaze's headline says private label "creates 15% incremental margin". On its own table that means 15 percentage points of the retail price: 75% against 60% of $30, or $4.50 more per item. Measured on the margin dollars themselves, the gain is larger: $22.50 against $18.00 is 25% more gross profit per item. Both are correct; they answer different questions, and a reader who assumes the wrong one will misjudge the plan.
Write the gain in a form that cannot be misread: "+15 margin points (+$4.50 per $30 item)". When the gain feeds a profit sizing, use the dollar or margin-point version consistently, and multiply it only by revenue measured the same way as the price it came from.
Worked example: sizing an own-brand plan with the ramp
Hypothetical example, invented for illustration; the numbers are not Eaze's. A delivery retailer sells $10M of products a month at retail prices, excluding taxes. Its own brand earns 15 margin points more than the branded products it replaces at the same price. Own-brand share of sales is 12% this month and planned to reach 40% in month 7, rising evenly by about 4.7 points a month, then holding.
If you take the end state for the whole year, the gain is $120M × 40% × 15% = $7.2M. Following the ramp, the share averages roughly 32% over the twelve months (months 1 to 7 average about 26%, months 8 to 12 are at 40%), so the gain is about $120M × 31.8% × 15% = $5.7M. The end-state shortcut overstates the year by about $1.5M, roughly a quarter more than the ramp supports.
Then subtract the brand's own fixed costs. If product development, compliance testing and launch marketing cost $1.2M in the year, the net gain is about $4.5M, not $7.2M. Unsold stock written off would reduce it further. Show both the gross gain and the net figure, and say which months are actual.
Three bases that look alike but are not
Eaze's own-brand slides use three different measures of share and size. Page 7 gives own-brand sales as a percentage of gross transaction value (GTV), which its footnote defines as product costs plus taxes and fees. Page 5 sets a target as "menu share". The same page multiplies by estimated 2020 revenue, and on page 9 revenue is product value plus delivery fees, before taxes. A share of a figure that includes taxes is not the same as a share of revenue, and a menu share may count listed products rather than sales.
This is common: operations teams track share of orders or listings, finance tracks revenue, and the deck takes a number from each. Pick one base (product sales at retail price, excluding taxes, is usually the right one for a margin gain), restate the share on that base and keep it through the sizing.
Common mistakes
Ambiguous percentage. "15% more margin" can mean margin points or a relative gain. Write the points and the dollars per item.
Leaving out brand-only costs. Development, compliance, minimum runs, unsold stock and brand marketing reduce the gain; show them in the sizing.
Assuming price parity silently. If your brand sells below the branded product, the gain shrinks by the discount. State the price you assume.
Mixing bases. Share of GTV including taxes, menu share and revenue including fees are different numbers. Restate on one base.
End-state share for the full year. Use the monthly ramp; a target share applied to twelve months overstates the year.
Plan shown as actual. Mark which months of a share chart are actual and date the deck.
Diagnostic checklist
The revenue base is stated and used for every share and every sizing input.
Own-brand landed cost and the replaced product's wholesale cost are both shown.
The selling price assumption is stated.
The gain is given in dollars per item and in margin points.
Brand-only costs are listed and subtracted in the sizing.
Adoption evidence states stores, period, unit of share and repeat purchase.
The share plan is monthly, with actual months marked.
The profit impact is labelled as a gross or net plan for a stated year.
Frequently asked questions
Is a higher gross margin from an own brand a cost saving?
No. Your existing costs don't fall; you earn more on each item you sell instead of a branded one. Call it a margin gain, and keep it separate from savings such as Eaze's depot consolidation on the same slide.
We only have two weeks of launch data. Should we show it?
Yes, with its scope, as Eaze's note does: which stores, which dates, and what was measured. Give the latest value as well as the peak, and say what you will measure next (repeat purchase, more locations).
Should the own brand be cheaper than the branded product?
That is a commercial choice; the slide must state it. A lower price can raise share but lowers the gain per item. Show the per-item gain at the price you actually plan to charge.
Where does the own-brand case go in the deck?
Next to your unit economics or business model slide, as Eaze does after its transition slide. Put the detailed bases and monthly plan in the appendix if space is short.
How we chose these examples
Discovery (2026-10-04): an own-brand lead from the previous writing-queue review was reassessed under the owner's corrected rule that one substantial company example can qualify. The corpus index was searched for private label, house brand, own brand, in-house brand and exclusive brand near margin terms. Other matches were listed companies (Splash Beverage, Vintage Wine Estates, Namshi, Summer Infant), consumer brands describing grocery private labels as competitors (Chobani, Flow Water), or decks naming private label only as an opportunity (Beveragewala, SSB, Rohlik); none added evidence about a startup's own-brand economics. Closest content checked: the released gross margin and per-order guides, and the gross margin path, revenue mix and white label drafts; the gross margin path draft names mix as one lever in a sentence and does not cover the own-brand case.
Eaze deck pages 4, 5, 7, 8 and 9 were rendered from the stored deck file and read from the images, with the page 7 chart re-rendered at 300 dpi to read its labels (still only partly legible in the source). Pages 5, 7 and 8 were uploaded as new 1200px images; page 4 was read for context only and page 9 is the Eaze example in the per-order guide. Eaze has a live teardown page; the pages carry an "Eaze Confidential" mark, as do other decks in our library with live teardowns. Our corpus exclusion list does not name Eaze; the database removal-request check could not be run this cycle (expired credentials), so it remains a pre-release check.
Company figures are not verified. The worked example is invented and labelled. Classifications and recommendations are our editorial reading, not financial or accounting advice. Drafted with AI assistance and checked by an editorial model against the slide images; not reviewed by a person.