Hiding Numbers in a Pitch Deck You Send: What to Redact
"$XM ARR", "REDACTED", "~XX%". Four real slides with hidden figures show how to protect sensitive numbers in a shared deck without leaving a slide.
Hidden Figures in a Shared Pitch Deck: Redact the Amount, Keep the Argument
Founders often send a deck before they have met an investor, and many worry about where it ends up. Some respond by replacing their numbers with "$XM" or a black box marked "REDACTED". That protects the figures, but it can also remove the reason the slide exists. This guide uses four real slides with hidden figures to show what can be hidden safely, what must stay visible for the slide to make its case, and when it is better to hold a slide back altogether.
TL;DR
Hide absolute amounts if you must, but keep the ratios, growth rates, time axis and chart shape that carry the argument, and say that exact figures are available on request. Recess is the best example: it hides every dollar amount on its bookings slide but keeps the headline "Bookings in H1 were 2.8x our total 2021 Bookings" and a dated twelve-month chart, so the slide still proves growth. Cloudsmith keeps "3x YoY, 10% MoM" and a dated ARR chart while hiding eight metric boxes. A slide that hides everything, like Phospholutions' black "5-Year Forecast" panel, is better left out of the sent version and shown in the meeting.
Four slides with hidden figures, read in full
Each slide was rendered from the original deck at full size and read in full. We do not know who removed the figures or when.
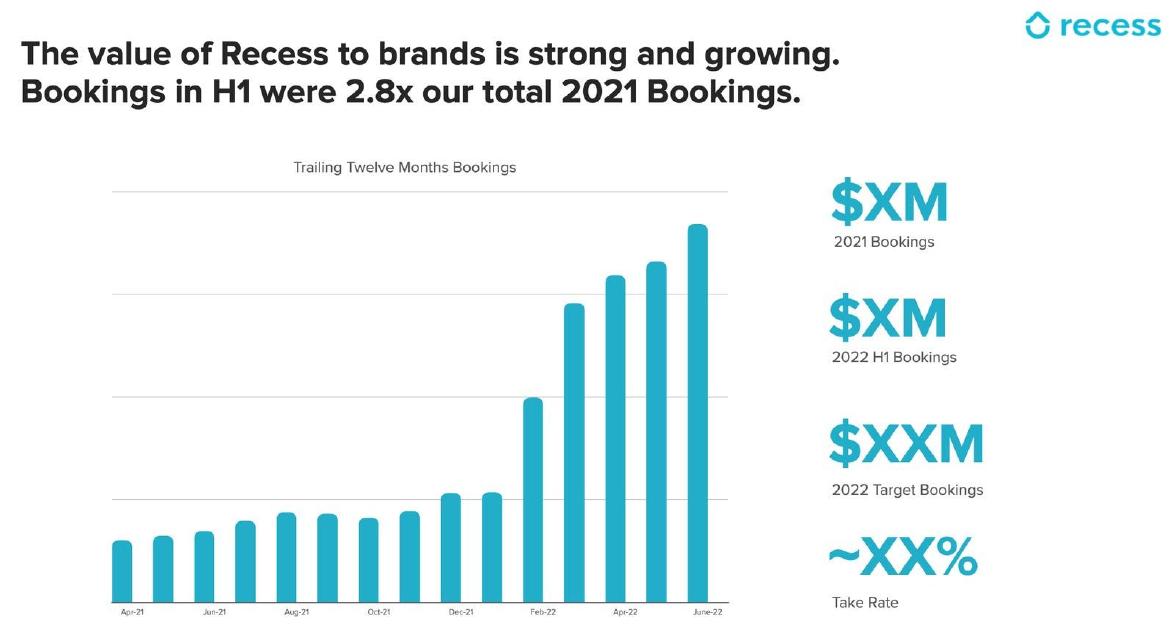
Recess executive summary slide — slide 9
Brand sampling marketplace. Bookings slide covering April 2021 to June 2022.
Recess deck, slide 9. Exact stored slide matched to this analysis.
Our analysis: The strongest redaction in the set: amounts gone, argument intact.
Evidence and limitation: Ratio and dated chart shape kept; all amounts and take rate hidden.
What a founder can adapt: Keep the take rate visible; it is the business model, not a size figure.
Supporting analysis
What the deck claims: "Bookings in H1 were 2.8x our total 2021 Bookings"; "Trailing Twelve Months Bookings" chart, no axis values; "$XM 2021 Bookings", "$XM 2022 H1 Bookings", "$XXM 2022 Target Bookings", "~XX% Take Rate".
Presentation choice: Shows a ratio carrying the claim when amounts are hidden.
When it does not fit: Hiding the one ratio that explains the economics.
After: "ARR grew 6x from December 2019 to December 2021 (December 2021 is a target). Exact figures available on request."
What improved: Our illustrative rewrite; the 6x multiple is invented for the example. It keeps the growth claim, separates actual from target and hides the amounts.
The question this guide answers
Founders ask whether they should hide revenue, forecasts or customer numbers in a deck they email to investors, and how to do it without weakening the deck. Our guides cover footnotes, metric sources, labelling units and keeping a separate appendix, but none answers this question: when a figure is hidden, what should the slide still show so that it makes its point?
The answer matters because a sent deck is read without the founder in the room. A slide that says "$XM" with no other evidence asks the reader to take growth on trust, which is exactly what a deck is meant to avoid.
How we chose and read the examples
We searched saved slide text in the teardown library for "REDACTED", "$XM", "$XXM" and similar placeholders. That returned more than 250 pages across dozens of decks. We kept four slides that hide figures four different ways: amounts hidden but ratio kept (Recess), metric boxes hidden but growth rates and chart kept (Cloudsmith), a whole slide blacked out (Phospholutions), and a timeline where every milestone amount is a placeholder (Reachdesk). All four companies were private when their decks were made.
An important limit: these decks reached our library as public versions, and we do not know who removed the figures, or when. Some companies redact before publishing an old deck; others send redacted decks to investors. We treat each slide as an example of what a reader sees when figures are hidden, not as evidence of what the company sent to any investor. Each slide was rendered from the original deck at full size and read in full.
Amounts hidden, argument kept: Recess
Recess's slide 9 is headed "The value of Recess to brands is strong and growing. Bookings in H1 were 2.8x our total 2021 Bookings." A bar chart titled "Trailing Twelve Months Bookings" runs monthly from April 2021 to June 2022, with no values on its axis. The bars rise gently through 2021, then step up sharply from February 2022. On the right, four figures are hidden: "$XM 2021 Bookings", "$XM 2022 H1 Bookings", "$XXM 2022 Target Bookings" and "~XX% Take Rate".
The slide still works. The 2.8x ratio tells the reader that the first half of 2022 brought in nearly three times all of 2021, and the chart shows the shape and timing of that change. An investor cannot tell whether Recess is a $1M or a $10M business, but can see that it is growing fast and when the growth began. That is the evidence the headline promises.
What is lost is scale and economics. The take rate, hidden as "~XX%", is the number that says how much of each booking Recess keeps, and it is the one an investor most needs to judge the model. Hiding a ratio that is itself the business model removes more than hiding an amount. If one figure has to stay visible, the take rate is a better candidate than the bookings totals.
Boxes hidden, growth rates kept: Cloudsmith
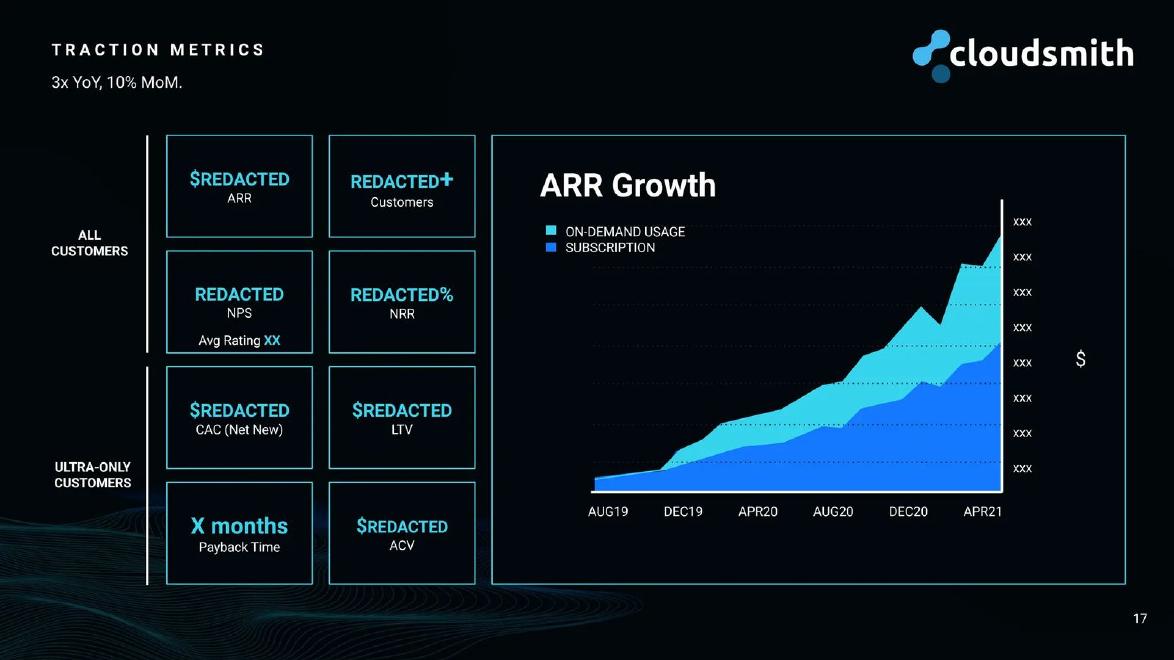
Cloudsmith's slide 17, "Traction Metrics", carries the subheading "3x YoY, 10% MoM." On the left, eight boxes are split between "All customers" ("$REDACTED ARR", "REDACTED+ Customers", "REDACTED NPS, Avg Rating XX", "REDACTED% NRR") and "Ultra-only customers" ("$REDACTED CAC (Net New)", "$REDACTED LTV", "X months Payback Time", "$REDACTED ACV"). On the right, an "ARR Growth" chart stacks on-demand usage over subscription revenue from August 2019 to April 2021, with the axis values replaced by "xxx".
Like Recess, the slide keeps its argument. "3x YoY" and "10% MoM" are the claims; the dated chart shows the shape and the mix, with subscription revenue rising steadily and on-demand usage adding a growing layer above it. The structure of the boxes is also informative: by naming the metrics it tracks for its top tier, including CAC, LTV and payback, the company shows it measures unit economics, even though the values are hidden.
The weakness is the number of hidden boxes. Eight placeholders on one slide read as a list of things the reader is not allowed to know. Payback in months and net revenue retention are ratios that reveal little about absolute size; keeping them visible would have strengthened the slide at little cost. A useful test is to hide only figures a competitor could act on, such as exact ARR or customer count, and keep the rest.
A slide with nothing left: Phospholutions
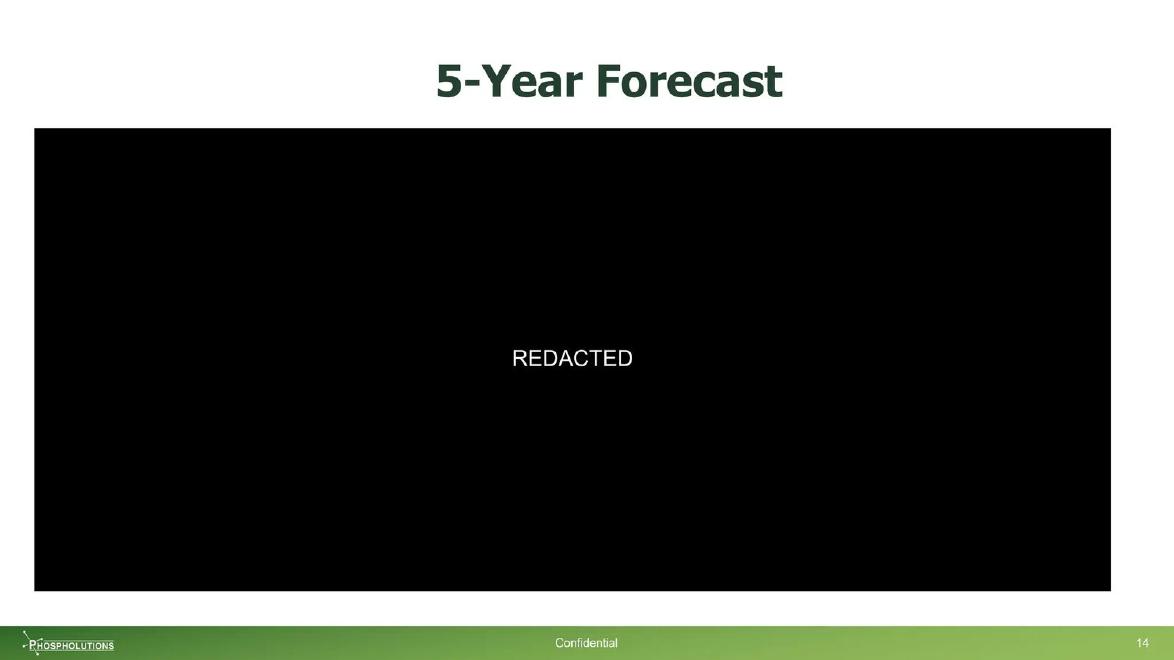
Phospholutions' slide 16 is titled "5-Year Forecast". Below the title, a black rectangle fills the slide with one word, "REDACTED". The footer reads "Confidential". In the same deck, the slides before and after it, headed "Short-Term Objectives" and "Series B Use of Proceeds", are also redacted in our copy.
Here nothing remains to read. The title tells the investor a forecast exists; the slide tells them nothing about it. In a public copy, that is a reasonable way to show that a slide was removed. In a deck sent to an investor, it would be better to drop the slide, keep the slide number sequence clean, and add one line to the closing slide: "Five-year forecast and use of proceeds available in the meeting." A black box spends a page to say what a sentence could.
If a forecast must appear in a sent deck, a stripped version can still say something useful: the years covered, the shape of the curve, the year the company expects to break even, or the main assumption. Each of these reveals much less than the full model.
Placeholders that read as unfinished: Reachdesk
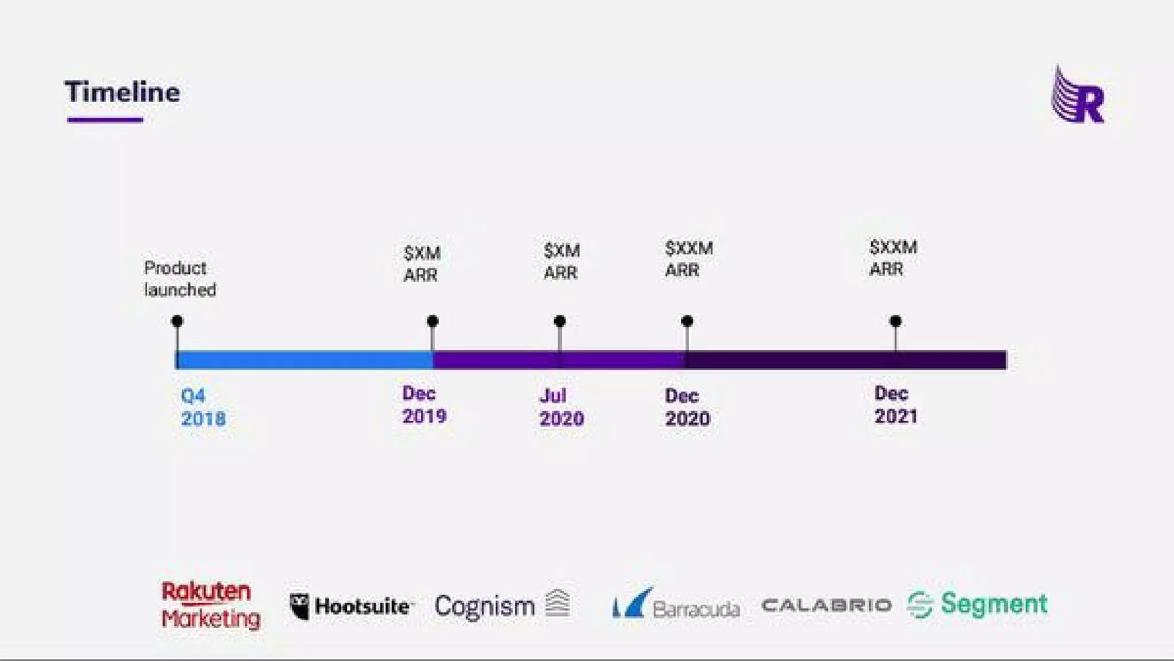
Reachdesk's slide 12, "Timeline", runs from "Product launched, Q4 2018" through four points, "Dec 2019", "Jul 2020", "Dec 2020" and "Dec 2021", each labelled with an ARR figure written as "$XM ARR" or "$XXM ARR". Customer logos run along the bottom: Rakuten Marketing, Hootsuite, Cognism, Barracuda, Calabrio and Segment.
The placeholders here look less like redaction and more like a template no one filled in. The number of X's hints at size, single-digit millions turning into double-digit, but that is a guess the slide invites rather than evidence it provides. The last point, December 2021, may be a target rather than an actual figure; the slide does not say which, so the reader cannot tell achieved results from plans.
A simple fix keeps the figures private and the argument intact: replace the amounts with multiples ("3x ARR in 12 months") or mark one baseline as 1x and the rest as multiples of it. And separate actual from forecast, with a dashed segment or a label, so the timeline does not blur results and targets.
What to hide and what to keep
Start by asking who could act on each figure. Exact revenue, customer counts, pricing to named customers and detailed forecasts can help a competitor or weaken a negotiating position. Growth rates, retention rates, payback periods and margins are usually far less sensitive, and they are the numbers investors use to judge quality.
Keep the dated time axis, the direction and shape of any chart, and at least one ratio that states the main claim. These carry most of the persuasive weight. Hide only the absolute values if you must.
Never leave a placeholder that looks like a draft. "$XM" in a sent deck can read as unfinished work. If you hide a figure, say so clearly once ("exact figures available on request") rather than scattering X's across slides.
Remove slides that have nothing left after redaction, and list what you will share in the meeting.
Whether to hide numbers at all
For most early-stage companies, the risk of sharing figures with a professional investor is smaller than the cost of a deck that proves nothing. Investors see many decks; one that hides its traction gives them an easy reason to pass without a meeting. Many founders send a full deck to investors they have qualified and keep a redacted version only for wider circulation, such as accelerator applications or public sharing.
If you do send a redacted version, label it on the cover ("Shared version; full figures on request") so the reader knows the gaps are deliberate.
What these examples can and cannot show
These four slides show what a reader sees when figures are hidden in different ways. We do not know who redacted them, whether these versions were ever sent to investors, or how investors responded. We did not check any figure against outside records; where figures are hidden, there was nothing to check.
The lesson is about the reader's experience: a hidden amount costs little if the argument remains; a hidden argument costs the slide its purpose.
Common mistakes
Hiding the argument. Keep the ratio or growth rate that proves the claim.
Hiding ratios. Retention, payback and margins reveal little about size.
Template-style placeholders. "$XM" reads as unfinished; use multiples.
Black-box slides. Remove slides with nothing left and list them for the meeting.
Unlabelled redaction. Mark the deck as a shared version.
Diagnostic checklist
Only competitively sensitive figures hidden.
Main claim still proven on every slide.
Ratios and dated axes kept.
Empty slides removed.
Deck labelled as shared version.
Frequently asked questions
Should I hide revenue in a pitch deck I email?
Usually not for qualified investors. If you must, keep growth rates and dated charts so the slide still proves growth.
Is "$XM" acceptable on a slide?
It reads as unfinished. Use multiples of a baseline instead.
What about financial forecasts?
Remove the detailed model from a sent deck and show the shape, horizon or break-even year if anything.
Do investors mind redacted decks?
They mind decks that prove nothing. A redacted deck that keeps its argument is far less costly.
How we chose these examples
Corpus: published pitch deck teardowns on StartupFundraising.com. Founder-uploaded private decks are excluded.
Selection (2026-10-01): we searched extracted slide text for "REDACTED", "$XM", "$XXM" and similar placeholders (more than 250 pages), excluded listed-company presentations, and kept four slides hiding figures four different ways.
Review: the four slides were rendered from the source decks at full size on 2026-10-01 and read in full against company, deck and page number (editorial model review, with AI assistance in drafting). We do not know who removed the figures or when. No person has yet completed a human editorial review of this draft.