Investors check whether your price, traction, forecast and milestones agree. We traced the numbers through seven pages of eShares' (now Carta) 2014 Series.
Do Your Numbers Agree From Slide to Slide? Tracing One Real Series A Deck
Seven pages from one deck: the Series A deck eShares (now Carta) used to close a $7M round in November 2014, later published by the company. We follow one chain of numbers from the price per transaction, through monthly revenue, customer counts and case studies, into the 18-month forecast and the 24-month milestones, and check where each link holds.
TL;DR
An investor reading a deck closely will carry numbers from one page to the next. The price on the business model page should explain the revenue on the traction page; the customer count and revenue per customer on the traction page should be the starting point of the forecast; the forecast's assumptions should be no rosier than what the case studies show; and the milestones should be what the forecast produces at the date you name. When a link breaks, the investor has to ask which page is right.
eShares' deck is a useful example because most of its links hold. Its forecast's first month, $57,500 of core revenue, is exactly 70 new companies at $250 plus 320 existing companies at $125 (our check), and $800K a month is reached in the model's eighteenth month, as the headline says. But some links break: the August revenue label doesn't match the table under it, the model starts below the run rate claimed on the summary page, and the model assumes twice as many shareholders per company as the summary page reports.
Seven pages from the eShares Series A deck
Each page is read for the numbers it shares with other pages and whether they agree. "Our calculation" marks arithmetic we did; everything else is quoted from the slide.
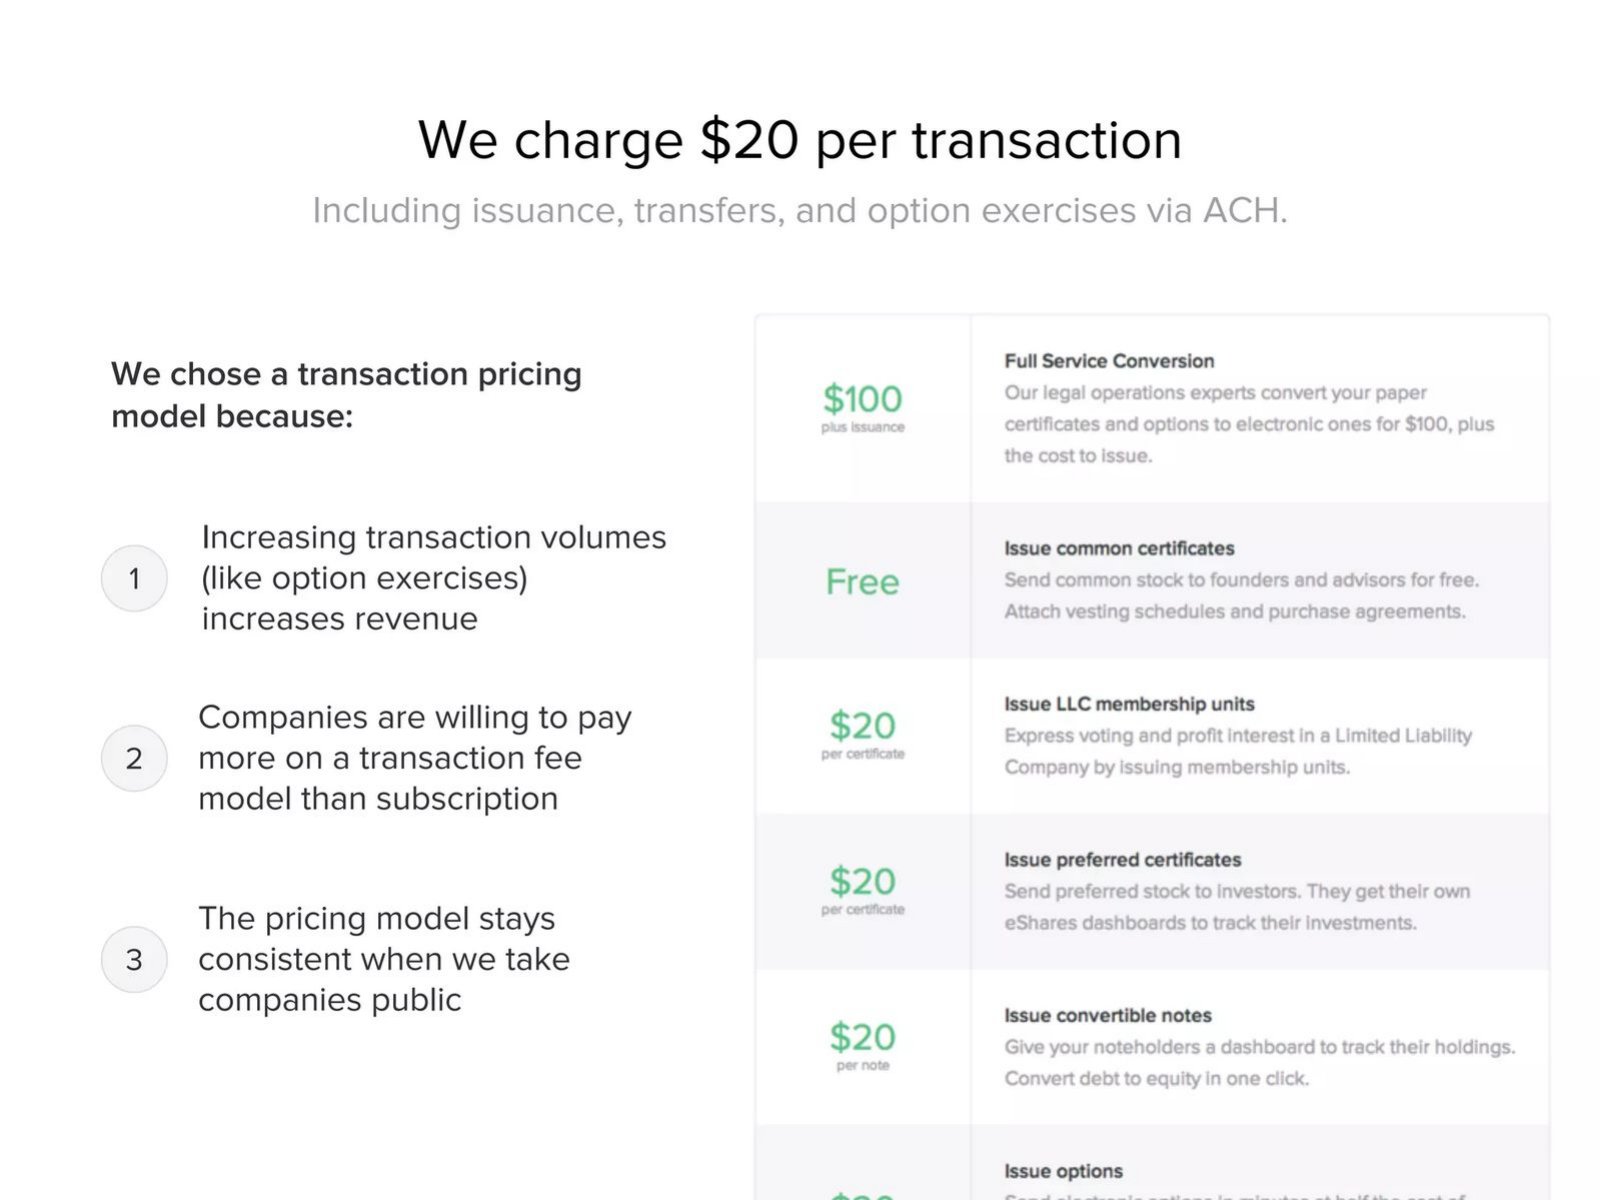
eShares financials slide — slide 9
Cap table and transfer agent software. 2014 Series A deck; pricing page.
eShares deck, slide 9. Exact stored slide matched to this analysis.
Our analysis: One clear unit the rest of the deck can be checked against.
Evidence and limitation: Sets the pricing unit. Page 13 later splits transaction from subscription revenue; subscription isn't explained here.
What a founder can adapt: Name each revenue line here that appears later.
Supporting analysis
What the deck claims: "We charge $20 per transaction", "Including issuance, transfers, and option exercises via ACH"; $100 "Full Service Conversion" plus issuance; common certificates "Free"; $20 per certificate or note.
Presentation choice: Investors look for the same unit in revenue and forecast.
When it does not fit: Don't report a revenue line the pricing page never mentions.
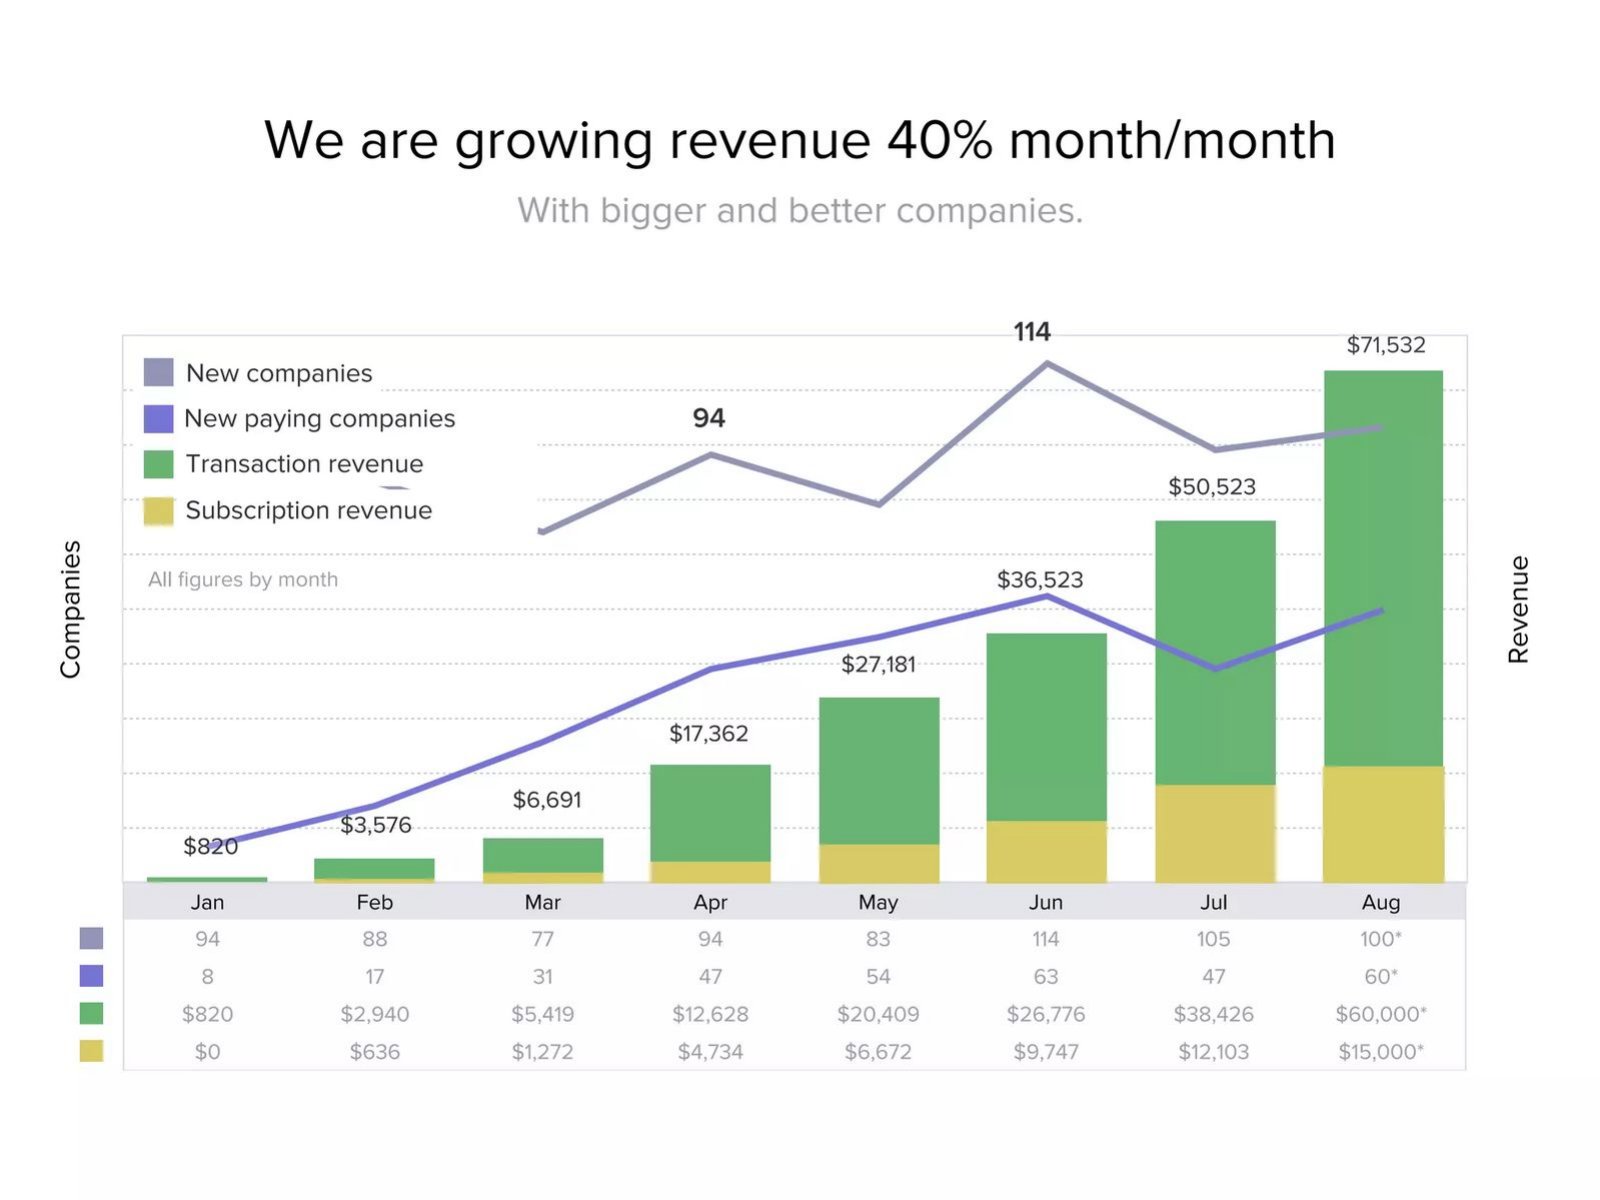
Same deck. Monthly revenue and customers, January to August.
eShares deck, slide 13. Exact stored slide matched to this analysis.
Our analysis: Good detail, with labels that don't all match the table.
Evidence and limitation: Our calculation: August parts sum to $75,000, not $71,532; May and July labels are off by $100 and $6. April to July growth averages about 43% a month.
What a founder can adapt: Sum every label from its parts and give the months behind a growth rate.
Supporting analysis
What the deck claims: "We are growing revenue 40% month/month"; July transaction $38,426, subscription $12,103; August estimates (asterisked) $60,000 and $15,000; August bar labelled $71,532.
Presentation choice: A chart that disagrees with its own table invites doubt.
When it does not fit: Don't leave an estimate with two different totals.
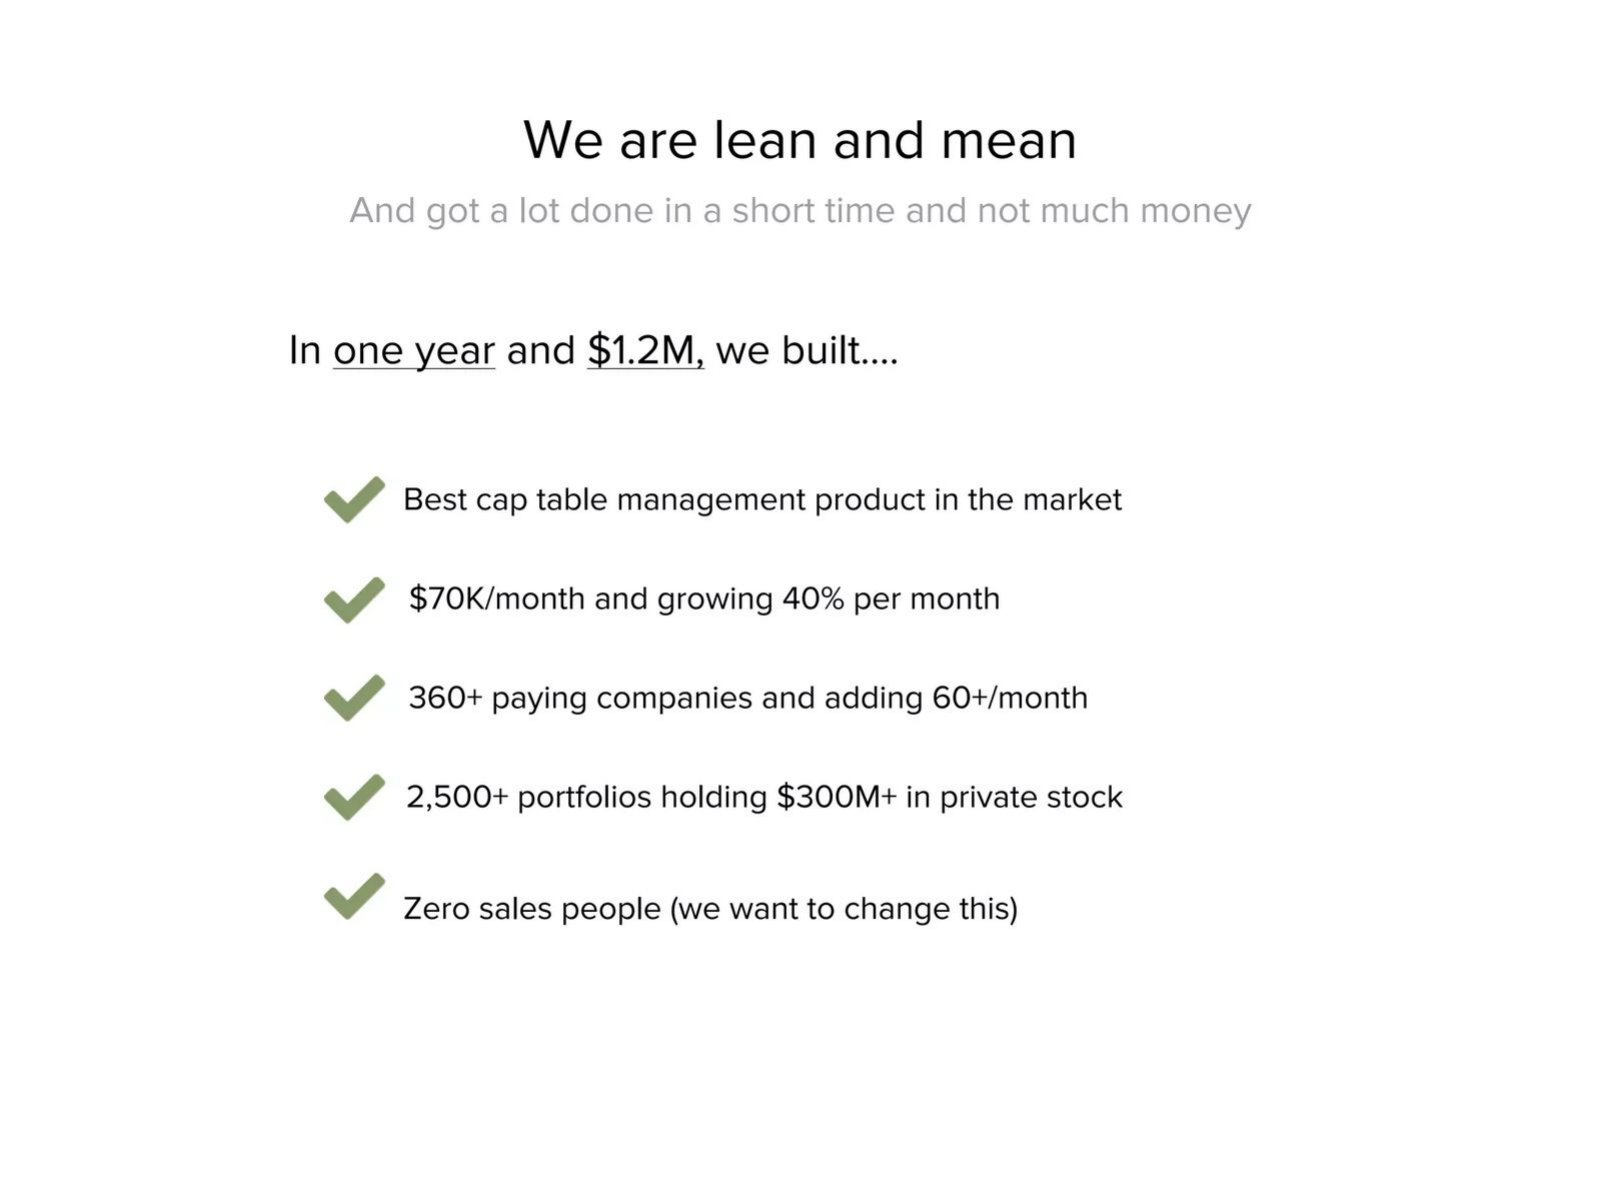
eShares deck, slide 21. Exact stored slide matched to this analysis.
Our analysis: Memorable summary, slightly rounded up from the detail.
Evidence and limitation: Our calculation: new paying companies January to August sum to 327; recent actuals 63 and 47 a month; about 7 portfolios per company.
What a founder can adapt: Footnote how each summary figure is counted.
Supporting analysis
What the deck claims: "In one year and $1.2M": "$70K/month and growing 40% per month", "360+ paying companies and adding 60+/month", "2,500+ portfolios holding $300M+ in private stock", "Zero sales people (we want to change this)".
Presentation choice: Readers quote the summary, so it must match the tables.
When it does not fit: Don't round a monthly rate up to your best month.
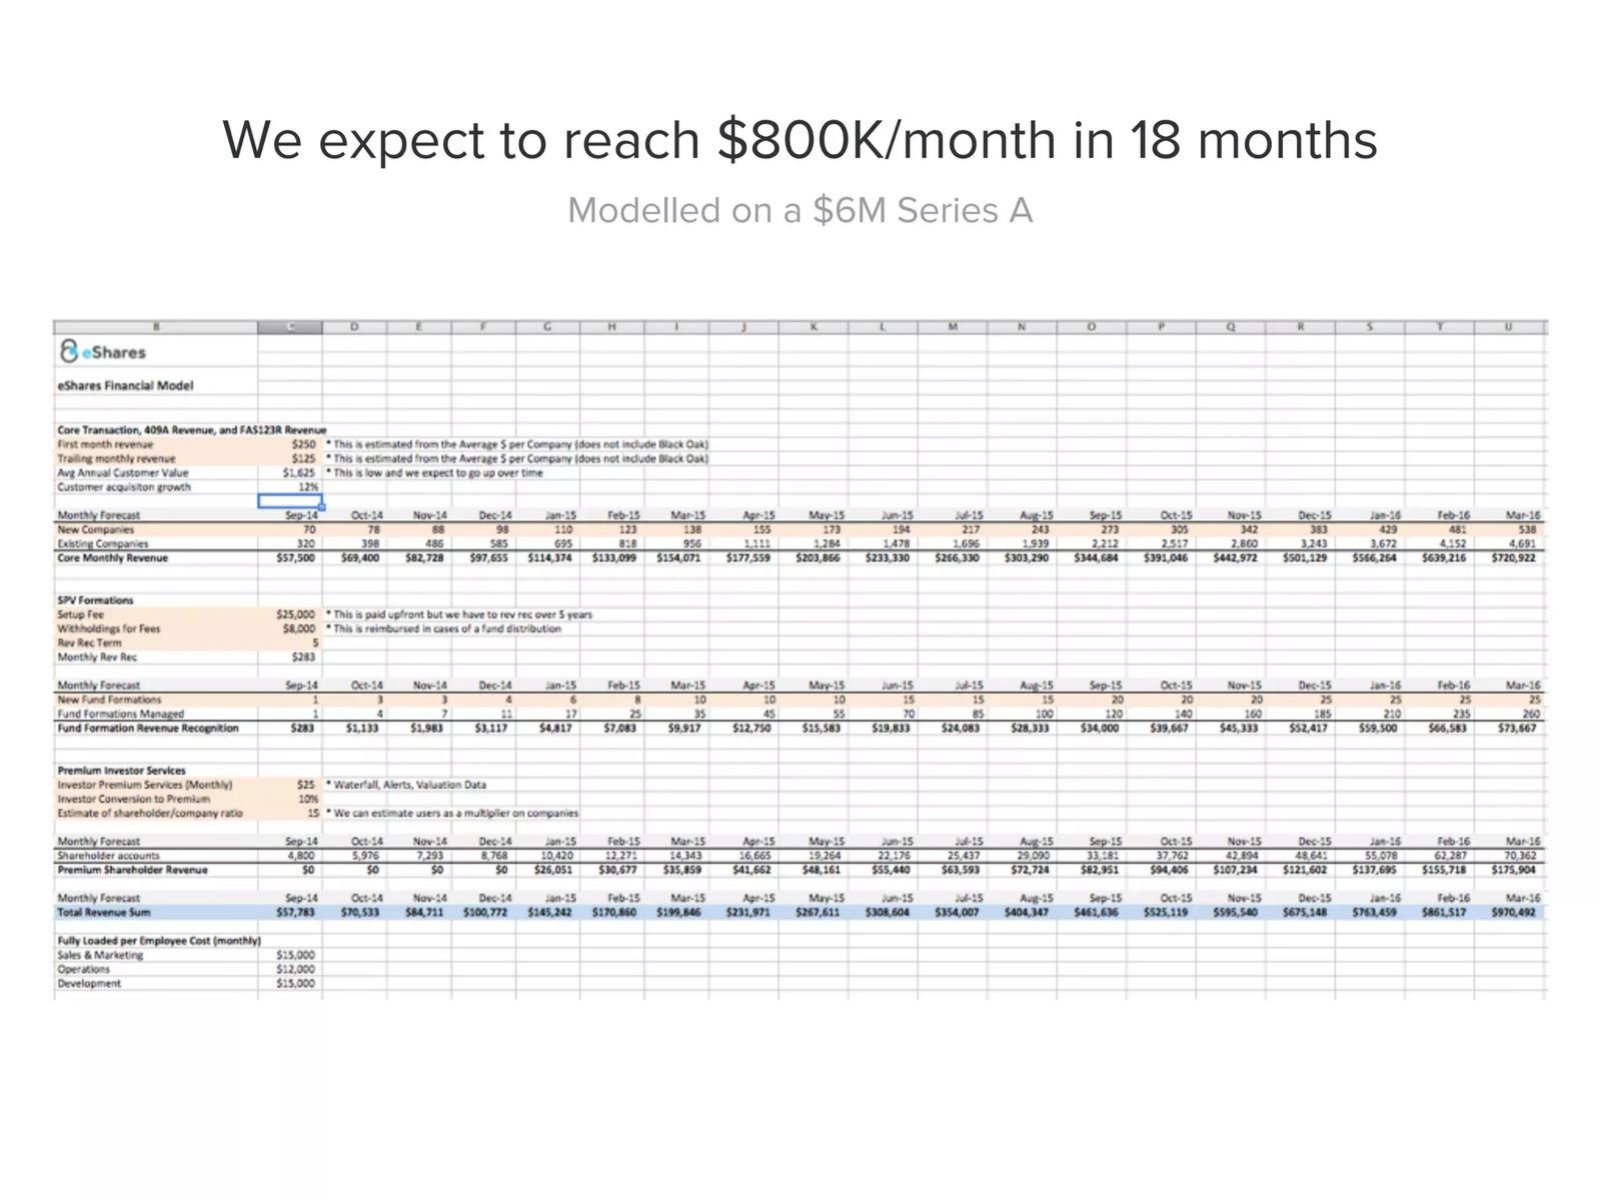
Same deck. 19-month financial model, September 2014 to March 2016.
eShares deck, slide 26. Exact stored slide matched to this analysis.
Our analysis: Assumptions shown and mostly traceable to traction.
Evidence and limitation: Our check: 70 x $250 + 320 x $125 = $57,500, as shown; month 18 total $861,517. Starts below page 21's $70K; 15 shareholders per company vs about 7 on page 21.
What a founder can adapt: Start from your current run rate, or explain why not.
Supporting analysis
What the deck claims: "We expect to reach $800K/month in 18 months", "Modelled on a $6M Series A"; first month $250, trailing $125, annual value $1,625 ("This is low"); growth 12%; premium services $25 at 10% conversion, 15 shareholders per company.
Presentation choice: Investors can rebuild the first month themselves.
When it does not fit: Don't assume a ratio twice what your traction shows.
eShares deck, slide 32. Exact stored slide matched to this analysis.
Our analysis: Shows a good customer's value beside the model average.
Evidence and limitation: Our calculation: about two to two and a half times the model's $1,625 average.
What a founder can adapt: Say how typical the case is, or give the median.
Supporting analysis
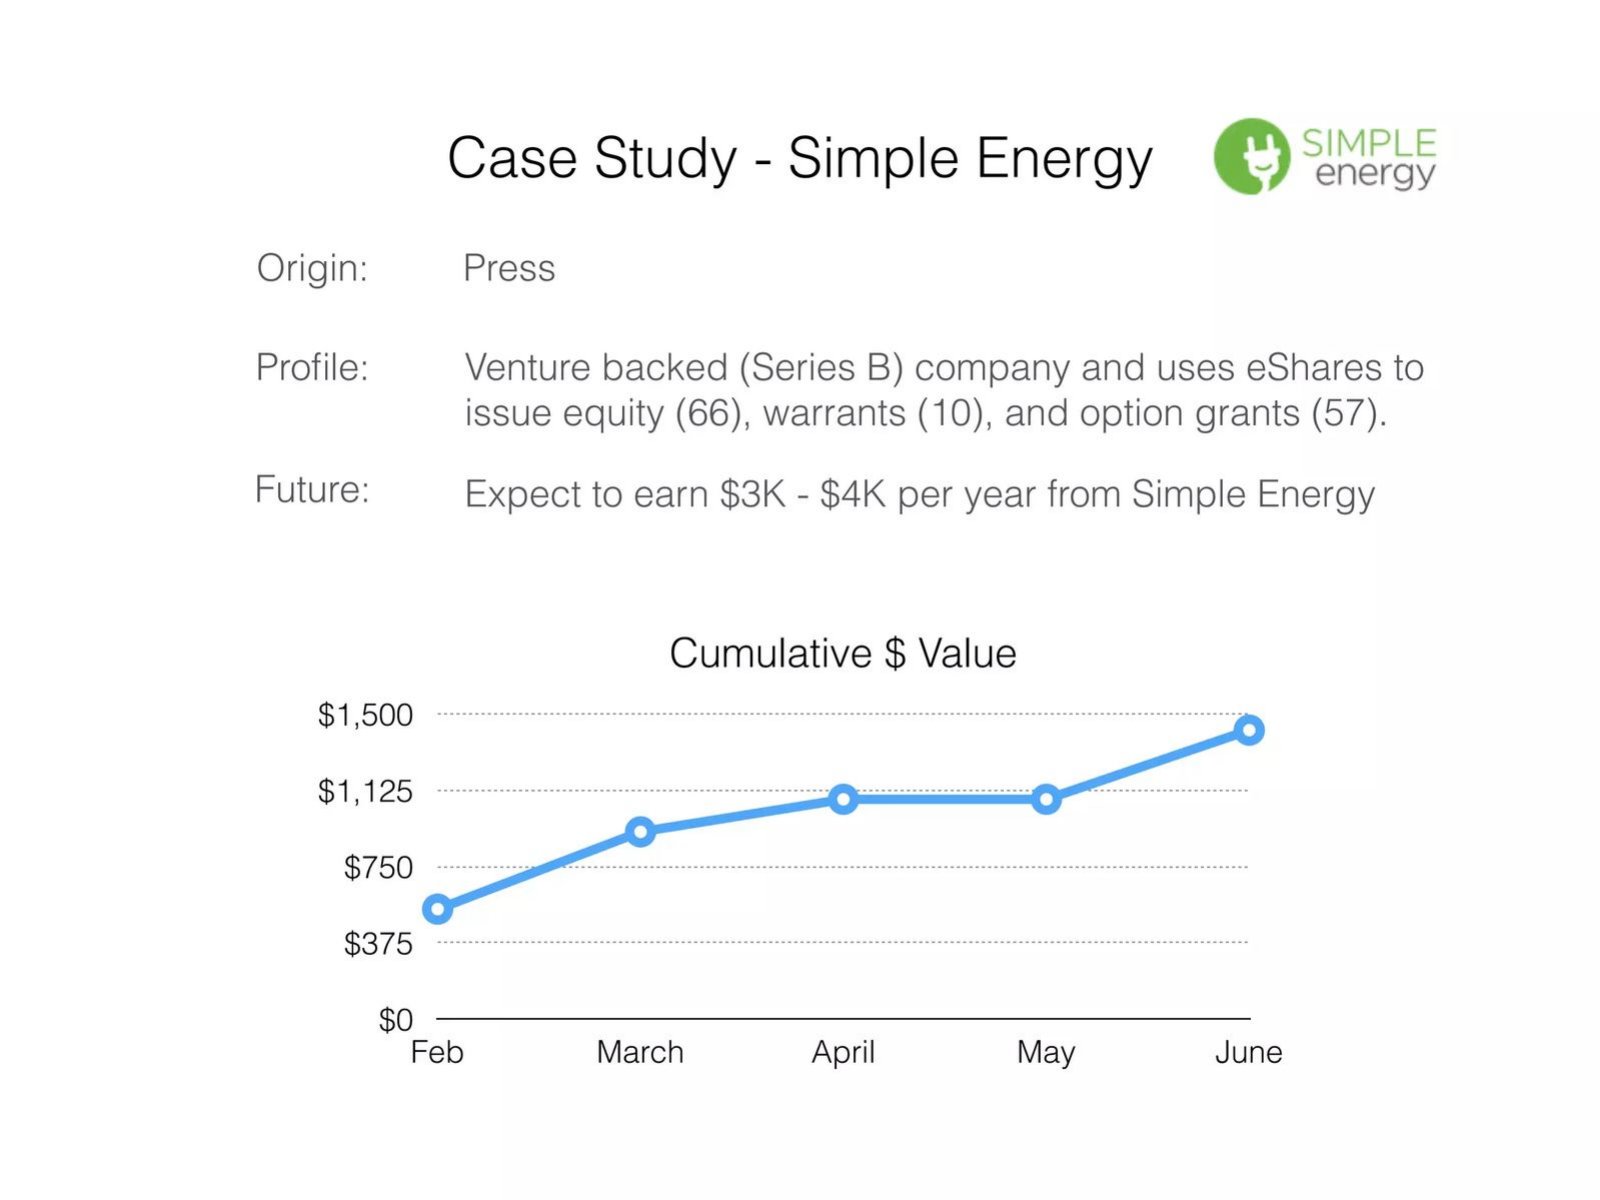
What the deck claims: Origin "Press"; issues "equity (66), warrants (10), and option grants (57)"; "Expect to earn $3K - $4K per year from Simple Energy"; cumulative value about $1,400 by June (read from chart).
Presentation choice: Supports the claim that the model's average is low.
When it does not fit: Don't let a chosen case stand for the average.
eShares deck, slide 34. Exact stored slide matched to this analysis.
Our analysis: Names the acquisition channel and the expected value.
Evidence and limitation: Our calculation: about three to nearly four times the model average. Most value arrived in one month, so the annual figure is a projection.
What a founder can adapt: Mark expected annual value as a projection.
Supporting analysis
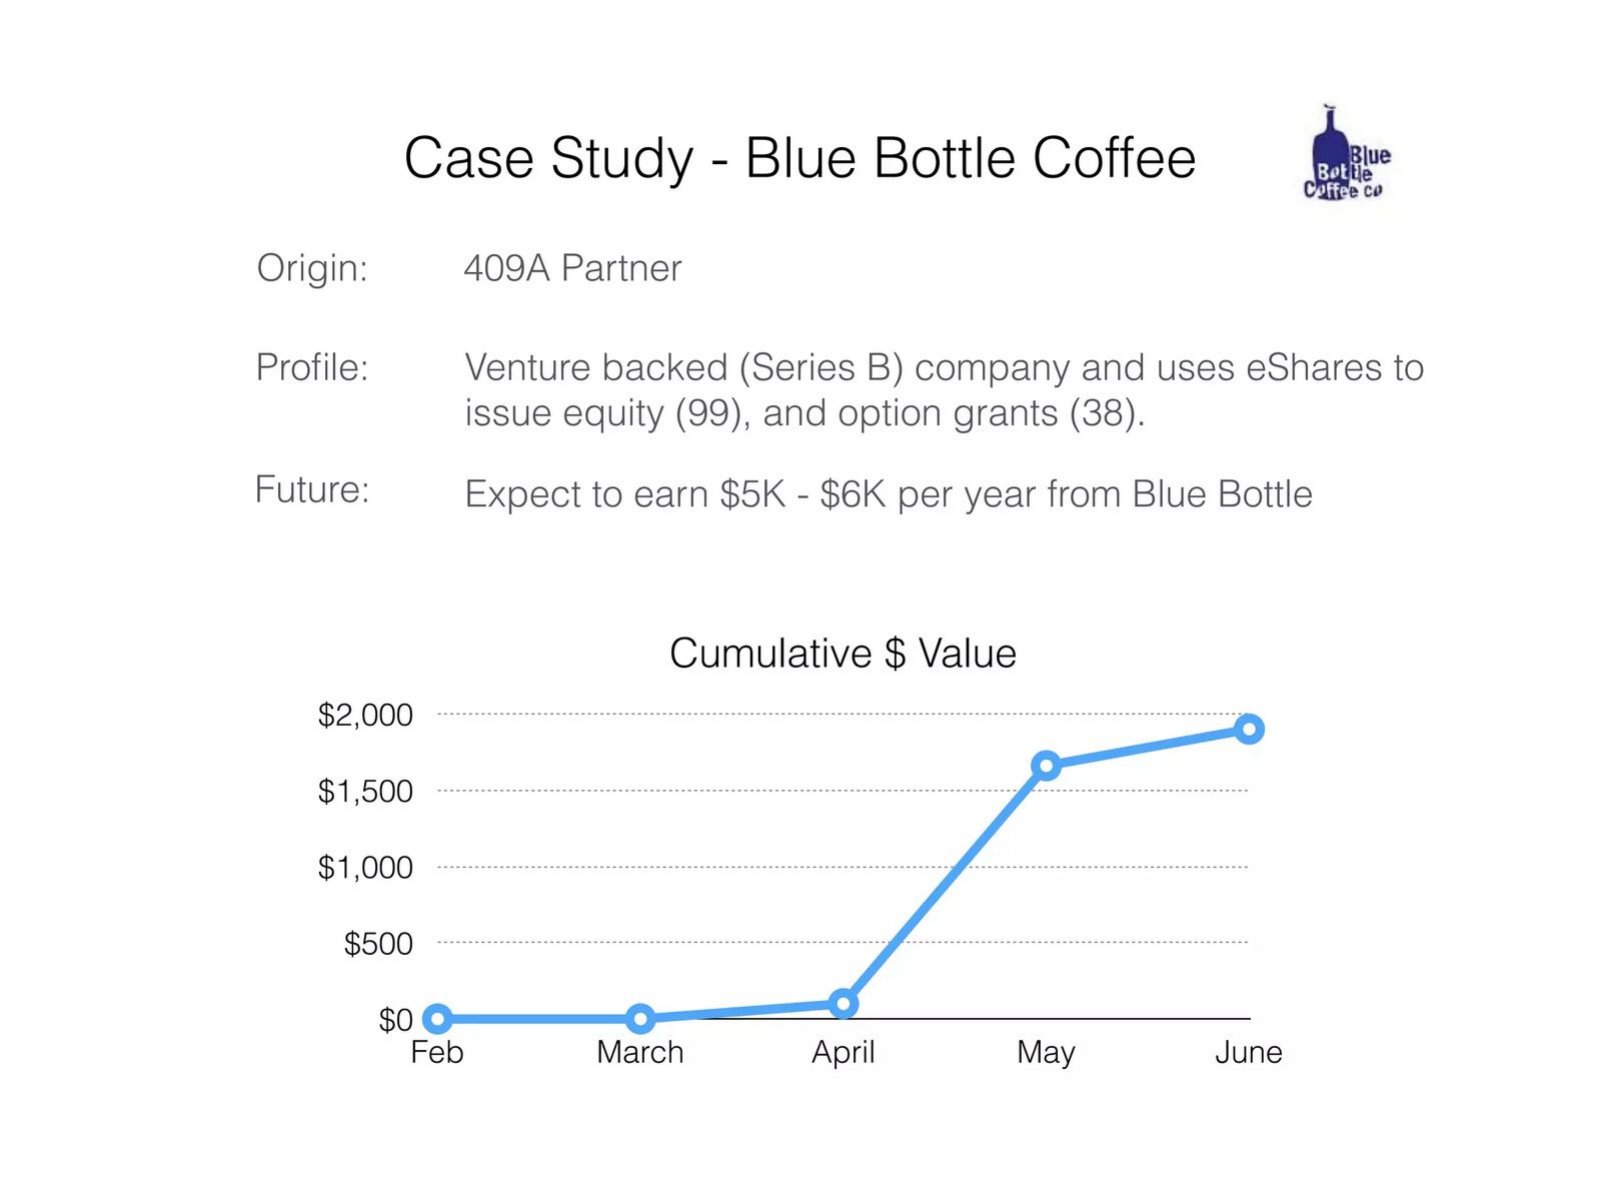
What the deck claims: Origin "409A Partner"; equity (99) and option grants (38); "Expect to earn $5K - $6K per year from Blue Bottle"; cumulative value near zero until April, about $1,900 by June.
Presentation choice: Links a sales channel to revenue per customer.
When it does not fit: Don't annualise one busy month without saying so.
eShares deck, slide 37. Exact stored slide matched to this analysis.
Our analysis: Milestones close to what the model implies.
Evidence and limitation: Our rough extension of page 26 at 12% growth: about 9,000 companies at month 24. 100,000 portfolios sits between the model's 15 and page 21's 7 per company.
What a founder can adapt: Read each milestone off the model at the named date.
Supporting analysis
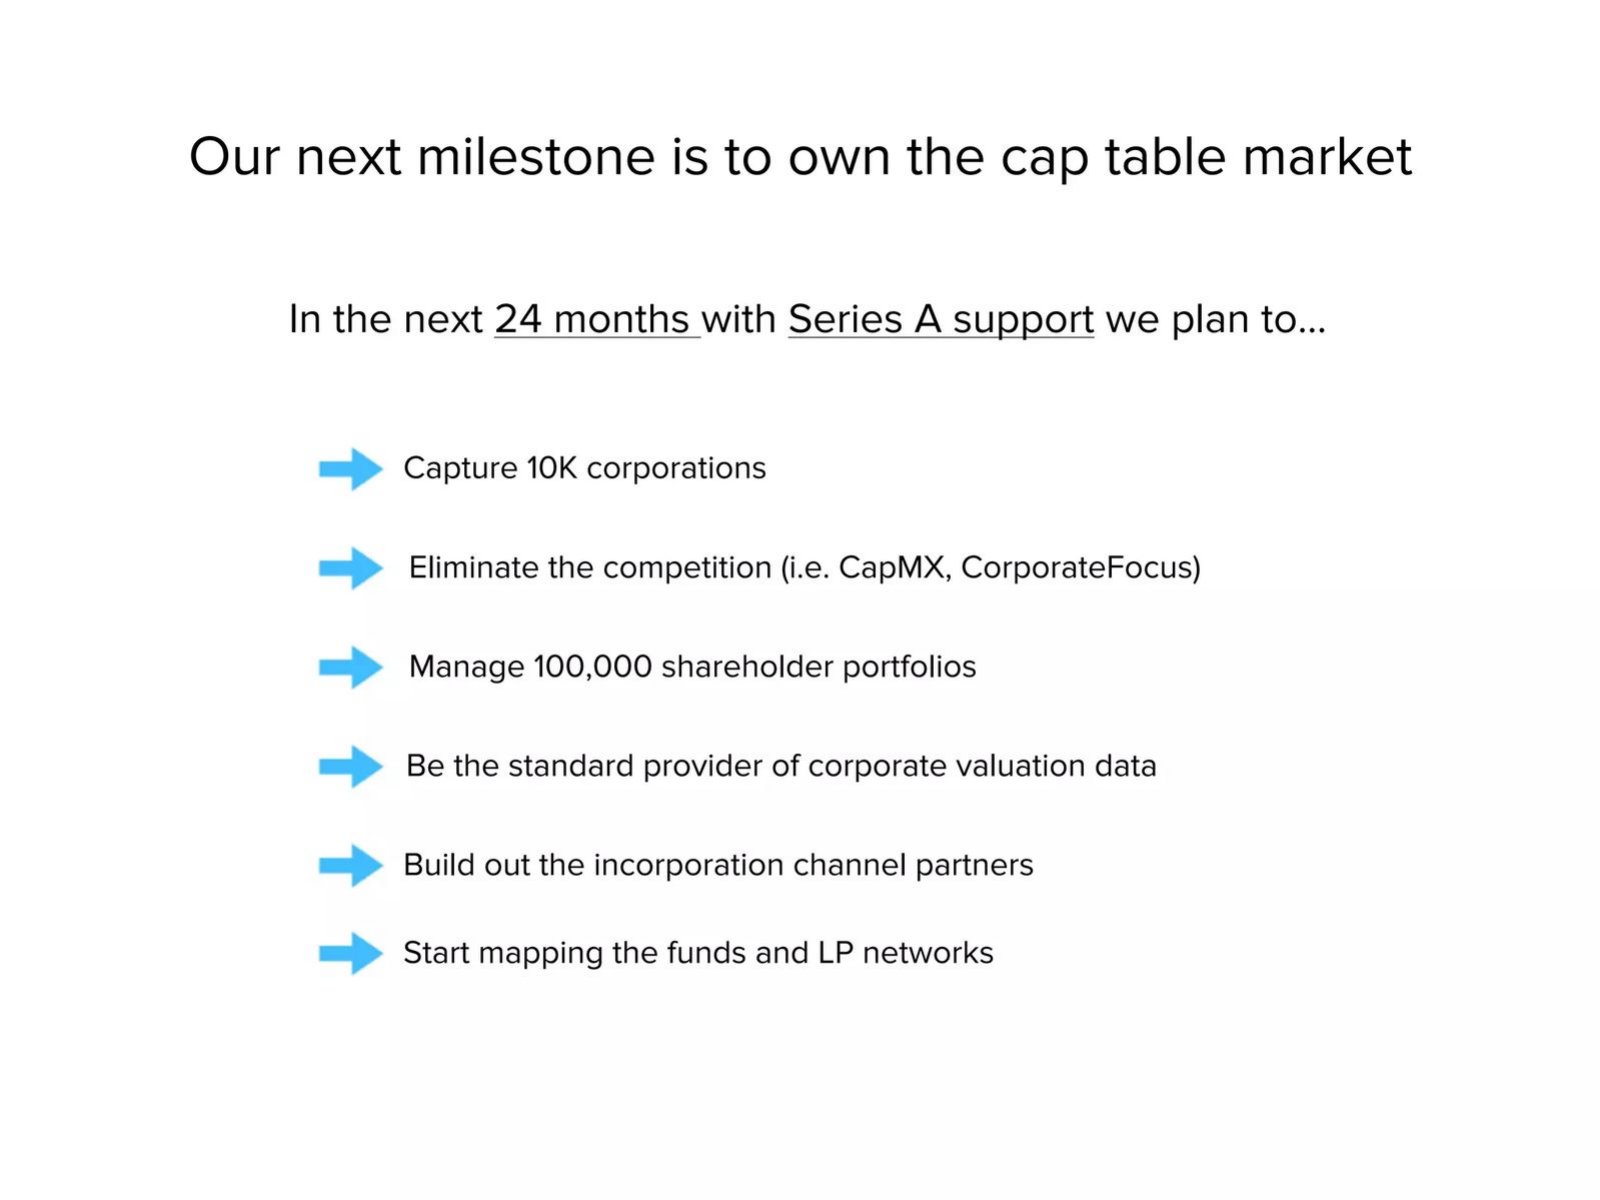
What the deck claims: "In the next 24 months with Series A support we plan to": "Capture 10K corporations", "Manage 100,000 shareholder portfolios", "Eliminate the competition (i.e. CapMX, CorporateFocus)".
Presentation choice: A milestone the model can't produce looks like a guess.
When it does not fit: Don't set a milestone from a different ratio than the model.
Each row is a number that appears on more than one page. Checks are our calculations from the slides.
Number
Where it appears
Values
Reconciles?
Core revenue, first model month
p26
70 x $250 + 320 x $125 = $57,500
Yes
$800K a month in 18 months
p26 headline and table
Month 18 = $861,517
Yes
August revenue
p13 label, p13 table, p21
$71,532; $75,000; $70K
No (estimates differ)
Run rate into the forecast
p21, p26
$70K; $57,783
No (unexplained drop)
Paying companies
p13 sum, p21, p26
327; 360+; 320
Partly (counting not stated)
Shareholders per company
p21, p26
About 7; 15
No
Revenue per customer
p26, p32, p34
$1,625; $3K-$4K; $5K-$6K
Yes, labelled as low
Companies at 24 months
p26 extended, p37
About 9,000; 10K
Roughly
Key Takeaways
Build the forecast's first month from today's customers and revenue per customer, as eShares' page 26 does, and show the arithmetic.
Make the summary page match the detailed pages. eShares' page 21 says $70K a month; its page 13 table sums to $75,000 for August and its forecast starts at $57,783.
Check every chart label against its table. On page 13 the August bar is labelled $71,532 while its two parts add to $75,000 (our calculation).
Label estimates. eShares stars its August figures as estimates, which is the right habit.
Use case studies to test the forecast's average. eShares' cases expect $3K-$6K a year per company; the model assumes $1,625 and says so.
Make milestones a reading of the model. 10K corporations in 24 months is roughly what the model's 12% monthly growth gives, on our rough extension.
Check your deck's numbers
Fill in each line before you send the deck. Every number should have one value, one period and one definition.
Price. Pricing unit and every revenue line it should produce.
Current revenue. Monthly figure on the traction, summary and forecast pages, with the month.
Customers. Paying customers on each page, and how they're counted.
Revenue per customer. Model average, and the median or a typical case.
Ratios. Users, seats or shareholders per customer: actual and modelled.
Milestones. Each milestone and the model's value at that date.
Copyable framework: Today: [revenue] in [month] from [n] paying customers at [revenue per customer]. Forecast month one: [n new] x [first-month price] + [n existing] x [ongoing price] = [total]. Milestone: [target] at month [m]; model shows [value].
Illustrative example 1 — written by us
Before: $70K/month, 360+ customers, growing 40% a month. Target: 10K customers in 24 months.
After: $75K in August (estimate) from 327 paying customers; April to July growth averaged 43% a month. Forecast month one: 70 new x $250 + 320 existing x $125 = $57.5K core revenue, set below August for caution. Target: 10K customers at month 24; model shows about 9,000.
What improved: Our illustrative rewrite using eShares' own figures and our calculations; the reason for starting below August is invented for the example. Each number now has a month, a count method and a link to the forecast.
The question this guide answers
Most of our guides look at one slide type at a time: how to show traction, how to present a forecast, how to price. Investors don't read decks that way. A partner who likes your traction page will flip to the forecast to see whether it starts where traction ends, then to the ask to see whether the money matches the plan. Small mismatches between pages are among the most common reasons a careful reader starts to doubt a deck, because each one forces the question of which number is real.
Our existing guides touch parts of this. The runway guide checks whether the amount raised covers the losses before break-even; the financials guide covers what a forecast should contain; the traction guide covers how to show growth. None follows one set of numbers through a whole deck and shows how to check that the business model, traction, forecast and milestones agree. That is the question here: before you send a deck, which numbers should reconcile across slides, and how do you check them?
How we chose and read the deck
We scanned the extracted text of the deck library for decks in which the same figures recur across several pages, then removed listed companies, funds and decks whose repeated figure was only a round size. eShares' Series A deck stood out: one price ($20 per transaction) and one set of customer and revenue figures run through its pricing, traction, summary, forecast, case study and milestone pages, so its links can be tested.
We rendered seven pages from the original deck file and read them at full size: page 9 (pricing), 13 (monthly revenue and customers), 21 (summary), 26 (financial model), 32 and 34 (two of five customer case studies) and 37 (24-month milestones). We also read the text of pages 22, 23 and 33 for context. eShares was private when the deck was made; its chief executive, Henry Ward, published the deck himself in 2015 with a post saying the company closed a $7M Series A the previous November. The library holds the deck under three entries dated 2014 and 2015; the model's first month is September 2014, so we treat it as a 2014 deck.
Every figure we quote is from the slides. Sums, ratios and extensions labelled "our calculation" are ours. We did not check any figure against eShares' accounts.
Link 1: the price explains the revenue
Page 9 is headed "We charge $20 per transaction", "Including issuance, transfers, and option exercises via ACH." A table lists a $100 "Full Service Conversion" plus issuance, free common certificates, and $20 per certificate for LLC units, preferred shares and convertible notes. On the left, three reasons for choosing transaction pricing: volumes like option exercises increase revenue, "Companies are willing to pay more on a transaction fee model than subscription", and the model "stays consistent when we take companies public".
This page sets the unit a reader will look for later. Page 13 does separate "Transaction revenue" from "Subscription revenue", so a reader can see that transaction fees are the larger part, about 76% of July revenue (our calculation from $38,426 of $50,529). The deck doesn't say what the subscription revenue is for, though page 11 mentions add-on services such as 409A valuations. If your business model page names one pricing unit and your traction page reports another revenue line, say what the second line is.
Link 2: the traction table and its labels
Page 13, "We are growing revenue 40% month/month", "With bigger and better companies", has a chart and a table by month from January to August. New companies run between 77 and 114 a month; new paying companies rise from 8 in January to 63 in June, fall to 47 in July, and are estimated at 60 for August. Transaction revenue rises from $820 to $38,426 in July, and subscription revenue from $0 to $12,103. August figures carry an asterisk: 100, 60, $60,000 and $15,000.
Most bar labels are the sum of the two revenue lines: $3,576, $6,691, $17,362 and $36,523 all add up (our check). Three don't. May's label is $27,181 against parts that sum to $27,081; July's is $50,523 against $50,529; and August's is $71,532 against estimated parts of $75,000 (our calculations). The first two are small, probably typing errors. The August gap is $3,468, and because August is an estimate, the reader can't tell which figure the company believes.
The 40% headline also needs a period. From April to July revenue grew from $17,362 to $50,529, about 43% a month on average; from June to July it was about 38% (our calculations). From February the average is much higher. A growth rate in a headline should say which months it covers, so the reader doesn't compute a different number from your own table.
Link 3: the summary page must match the detail
Page 21, "We are lean and mean", says that "In one year and $1.2M" eShares built the "Best cap table management product in the market", "$70K/month and growing 40% per month", "360+ paying companies and adding 60+/month", "2,500+ portfolios holding $300M+ in private stock" and "Zero sales people (we want to change this)".
Investors often remember a summary page better than the table behind it, so its figures should be the ones the detail supports. $70K a month sits between the August bar label and the August table total, both estimates. 360+ paying companies is higher than the sum of new paying companies from January to August, 327 including the August estimate (our calculation), and higher than the 320 existing companies the forecast starts from. The gap could be companies that paid before January, which the table doesn't show. A footnote saying how 360 is counted would close it.
"Adding 60+/month" matches the August estimate but not the recent actuals: 63 in June and 47 in July. A summary that rounds up to the best month invites the reader to check.
Link 4: the forecast starts from today's numbers
Page 26, "We expect to reach $800K/month in 18 months", "Modelled on a $6M Series A", is a spreadsheet screenshot. Its stated assumptions are the most useful part of the deck for this question: "First month revenue $250" and "Trailing monthly revenue $125", both "estimated from the Average $ per Company (does not include Black Oak)"; "Avg Annual Customer Value $1,625", with the note "This is low and we expect to go up over time"; and "Customer acquisition growth 12%".
The first column reconciles. 70 new companies at $250 plus 320 existing at $125 gives $57,500, the core revenue shown for September 2014, and $250 plus eleven months at $125 gives the $1,625 annual value (our checks). Excluding Black Oak, the $30M wind-farm project profiled on page 35, keeps one atypical customer from inflating the average, and saying so is good practice.
The model also reaches its headline at the stated time. Counting September 2014 as month one, month 18 is February 2016, when total revenue is $861,517; January 2016 is $763,459 (figures from the slide). So "$800K/month in 18 months" is what the model shows.
Two links are weaker. First, the model's September total, $57,783, is below the $70K a month on page 21 and the $75,000 estimated for August on page 13. Starting below the current run rate may be deliberate caution, but the deck doesn't say so, and a reader sees revenue falling between August and September. Second, the new-company line starts at 70 a month, close to the 60 paying companies estimated for August but well below the roughly 100 sign-ups a month on page 13. The deck doesn't say whether "New Companies" in the model means paying companies; if it does, the numbers line up.
Link 5: case studies test the average
Pages 32 to 36 are case studies. Page 32, Simple Energy: origin "Press"; a Series B company that uses eShares "to issue equity (66), warrants (10), and option grants (57)"; "Expect to earn $3K - $4K per year from Simple Energy"; and a chart of cumulative value rising from about $560 in February to about $1,400 in June (read from the chart). Page 34, Blue Bottle Coffee: origin "409A Partner"; equity (99) and option grants (38); "Expect to earn $5K - $6K per year"; cumulative value near zero until April, then about $1,650 in May and $1,900 in June.
These pages do what case studies should do in a deck with a forecast: show what a good customer is worth, next to the average the model uses. $3K-$6K a year is two to nearly four times the model's $1,625 (our calculation), which supports the note on page 26 that the model's average is low. The weakness is that the cases are chosen, not typical; two Series B companies may be among the largest customers. A sentence giving the share of customers at that stage, or the median revenue per company, would let the reader judge how far the average could rise.
Link 6: the other revenue lines need evidence too
Page 26 adds two revenue lines beyond core transactions. "SPV Formations" assumes a $25,000 setup fee recognised over five years, $283 a month per fund, rising from 1 to 235 funds managed by February 2016. "Premium Investor Services" assumes $25 a month, "Investor Conversion to Premium 10%" and 15 shareholders per company, starting in January 2015.
By February 2016 premium investor services are $155,718 of $861,517, about 18% of the total (our calculation), and they rest on a product the model doesn't start charging for until January 2015. The shareholder ratio is also the biggest cross-slide gap in the deck. The model's 4,800 shareholder accounts in September 2014 are 320 companies times 15; page 21 reports 2,500+ portfolios for 360+ companies, about 7 per company (our calculation). Either the definitions differ, or the model doubles the base its premium revenue grows from. When a forecast includes a line with no revenue yet, give its share of the total and the evidence behind each assumption.
Link 7: the milestones are what the model produces
Page 37, "Our next milestone is to own the cap table market", says that "In the next 24 months with Series A support" eShares plans to "Capture 10K corporations", "Eliminate the competition (i.e. CapMX, CorporateFocus)", "Manage 100,000 shareholder portfolios", become "the standard provider of corporate valuation data", build incorporation channel partners and start mapping fund and LP networks.
The model on page 26 shows 4,691 existing and 538 new companies in March 2016, its nineteenth month. Continuing 12% monthly growth in new companies for five more months adds about 3,800, for roughly 9,000 at month 24 (our rough extension). So 10K corporations is close to what the model implies, slightly above it. 100,000 portfolios is below the model's own 15 per company times 10,000, but above what page 21's 7 per company would give. Milestones should come from the model at the stated date, and where they differ, the deck should say why.
The raise is consistent across pages: page 23 says "Raising $6-$8M Series A", page 26 is modelled on $6M, and the company later said it closed $7M. The deck doesn't show headcount or costs over time on the model page, beyond fully loaded monthly costs per employee ($15,000 sales and marketing, $12,000 operations, $15,000 development), so a reader can't check whether $6M pays for the sales hires page 21 says the company wants.
How to check your own deck
List every number that appears on more than one page: price, revenue (monthly or annual), growth rate, customers, revenue per customer, users per customer, the raise, and each milestone. For each, write down the page it comes from, the period and the definition. Any number with two values, or one value and two definitions, needs a fix or a footnote.
Then rebuild the forecast's first month from today's figures, as eShares' page 26 does, and compare it with your traction page. Check that each milestone is what the model shows at that date. Put the case studies next to the average they're meant to support. Finally, add up every chart label from its parts. These checks take an hour and remove the questions that make an investor distrust the rest of the deck.
Common mistakes
Labels that don't sum. Add every chart label from its parts.
Summary rounded up. Use the figures the detailed pages support.
Forecast below today. Start at the current run rate or explain why.
Different ratios. Use the same per-customer ratios in traction and model.
Growth rate without months. Say which period a headline rate covers.
Milestones from nowhere. Read milestones off the model at the date named.
Diagnostic checklist
Every repeated number has one value, period and definition.
Chart labels equal the sum of their parts.
The forecast's first month is rebuilt from current customers and prices.
Case studies sit beside the average they support.
Revenue lines without sales yet show their share of the total.
Each milestone matches the model at its date.
Frequently asked questions
Which numbers should match across a pitch deck?
Price, current revenue, growth rate, customer count, revenue per customer, any per-customer ratio, the raise and each milestone. In eShares' deck the price, forecast start and headline target reconcile; August revenue and shareholders per customer don't.
Should my forecast start from my current revenue?
Yes, or explain the difference. eShares' model starts at $57,783 a month while its summary page says $70K, which a reader sees as a drop.
How do I show that my forecast's assumptions are realistic?
Show the arithmetic of the first month and put real customer cases next to the average. eShares' model says its $1,625 annual value is low, and its case studies expect $3K-$6K.
Do milestones need to come from the financial model?
They should. eShares' 10K corporations in 24 months is close to what its 12% monthly growth gives, about 9,000 on our rough extension, so the milestone reads as a plan rather than a wish.
Is it fine to include estimates for the current month?
Yes, if they're marked and used consistently. eShares stars its August figures but then shows two different August totals, which undoes the benefit.
How we chose these examples
Selection (2026-10-02): we checked the published guides and queued drafts for any page that follows numbers across a whole deck; the runway guide reconciles the raise with losses, and the financials and traction guides cover single slides, so none answers this question. The deck was found by scanning the library's extracted text for figures that recur across four or more pages.
Seven pages from the original deck file were rendered and read at full size: 9, 13, 21, 26, 32, 34 and 37; the text of pages 22, 23 and 33 was read for context. Values read from charts are marked as such. All calculations are ours and labelled. This guide was written with an AI editorial model and checked against the slide images by model review.
Eligibility was judged at the deck's date: eShares was private in 2014. The company's chief executive published the deck in 2015 with a post confirming the $7M Series A closed in November 2014.