The eShares (now Carta) Series A deck from 2014 is a masterclass in identifying a high-friction bottleneck—manual cap table management—and proposing a digital standard. Raising $7M, the company used a transaction-based pricing model ($20 per certificate) to lower the barrier to entry while building a massive 'Ownership Map' of the venture ecosystem. The deck excels by showing, not just telling, through extensive product screenshots and a clear competitive comparison against incumbents like Solium. It strategically positions eShares as the 'base camp' for taking companies public, moving from a…
Key takeaways
- The company explicitly targets a 'sweet spot' of Series A through D companies to ensure high-value, recurring transaction volume (Slide 9).
- eShares utilized a transaction-based pricing model of $20 per issuance/transfer to align revenue with customer activity rather than flat subscriptions (Slide 5).
- The deck highlights a 40% month-over-month revenue growth rate, reaching an estimated $71,532 in August 2014 (Slide 7).
- A direct head-to-head comparison with Solium's CapMX product identifies specific feature gaps, such as the lack of electronic SAFE issuance (Slide 10).
- The 'Ownership Map' visualization in the appendix demonstrates the emerging network effect between funds and companies (Slide 14).
- The funding ask was specifically $6M-$8M to 'converge the private market' and establish a path to the public markets (Slide 12).
- eShares achieved $70K/month in revenue with 'zero sales people,' emphasizing the product-led growth nature of the platform (Slide 11).
- The company identifies 409A valuations as a key wedge service, aiming to offer them at an 80% discount to capture data (Slide 20).
The Foundation of a Fintech Giant
The 2014 eShares Series A deck is more than just a fundraising document; it is a blueprint for how to digitize an entire asset class. At the time, managing a cap table involved physical paper certificates, expensive law firm billable hours, and error-prone spreadsheets. eShares (now known as Carta) proposed a radical shift: making the software the transfer agent. This teardown examines the 21 slides that convinced VCs to bet $7M on a company that was, at its core, a ledger.
The Vision: Capturing the Lifecycle of a Company
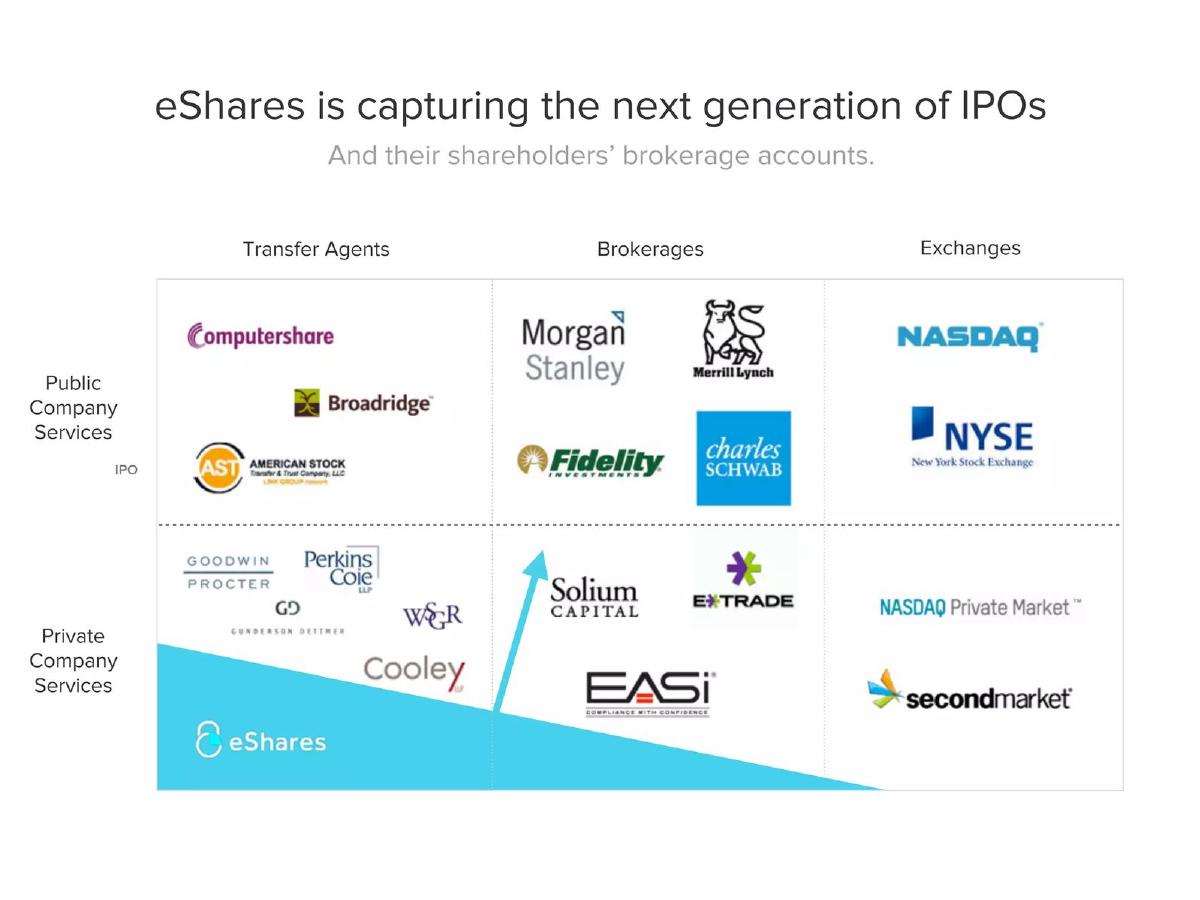
Slide 2 sets the stage with a bold claim: "eShares is capturing the next generation of IPOs." The slide uses a 2x2 matrix to show the transition from private company services to public company services. It positions eShares in the bottom-left quadrant (Private Transfer Agents) but uses a large blue arrow pointing toward the public market incumbents like Computershare and Morgan Stanley. This immediately tells investors that while the current product is for startups, the ambition is to own the entire financial 'food chain.'
Product as the Solution
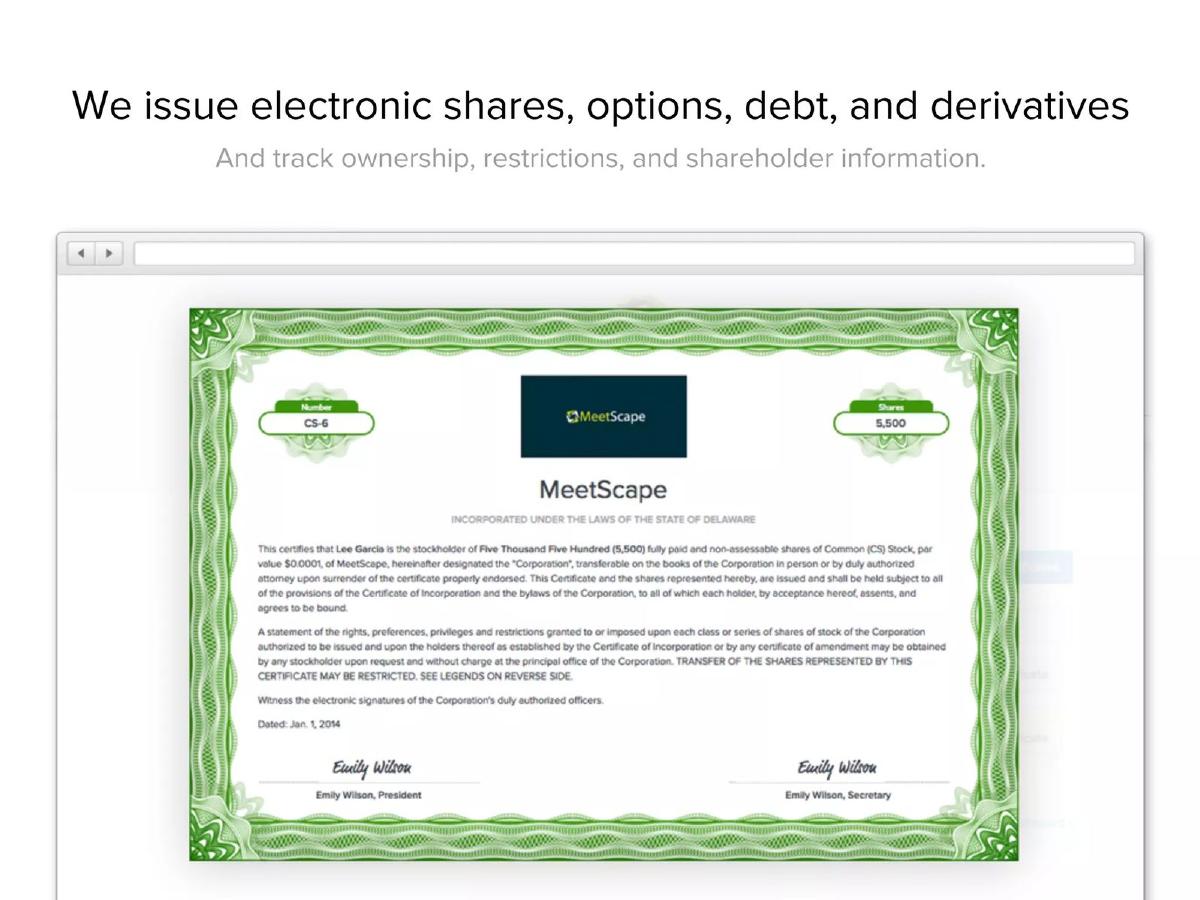
Slide 3 and 4 focus on the tangible product. Slide 3 shows a digital version of a classic green-bordered stock certificate for a fictional company, "MeetScape." The sub-header is functional: "We issue electronic shares, options, debt, and derivatives." Slide 4 moves into the dashboard, showing the "Cap Table" and "Portfolios" views. By showing the UI, eShares proves the product is real and addresses the visual 'mess' of traditional equity management. The inclusion of 409A and reporting tabs in the UI hints at the platform's future extensibility.
Strategic Pricing and Unit Economics
Slide 5 is one of the most important slides for founders to study. eShares explains their transaction-based pricing: $20 per transaction . They provide three reasons for this choice: 1) Increasing volume (like option exercises) increases revenue automatically. 2) Companies are more willing to pay per-transaction than a flat subscription. 3) The model remains consistent even after an IPO. This slide demonstrates a deep understanding of customer psychology and revenue scaling.
Slide 6 introduces the concept of bundling add-on services. They list 409A Compliance-as-a-Service at $159/month and SPV Administration at $25,000/fund. This shows a clear path from a $20 transaction fee to high-margin recurring revenue and large lump-sum fees, diversifying their income streams early on.
Traction and Social Proof
Slide 7 provides the 'money shot' for VCs: a bar chart showing revenue growing 40% month-over-month. The data is granular, showing "New companies" (peaking at 114 in June) and "New paying companies." By August, they projected $71,532 in total revenue , with the majority coming from transactions ($60,000) rather than subscriptions ($15,000). This validated their hypothesis that transaction fees were the primary growth engine.
Slide 8 uses a "Twitter stream" to show customer love. This is a clever way to provide social proof without formal case studies. Quotes from founders and VCs like Bilal Zuberi and Kegan Schouwenburg emphasize the 'magic' of the product. Slide 9 follows this up with a logo wall of "Series A through D" companies, including Life360, Sprout Social, and Blue Bottle Coffee, proving they can move upmarket.
The Competitive Kill-Shot
Slide 10 is a brutal head-to-head comparison with Solium's CapMX. eShares lists eight features—including electronic issuance of SAFEs and autosaving of draft certificates—where they have a checkmark and the competitor has a red 'X.' They explicitly state, "Their product is weak and their customers hate them." This level of aggression is backed by a specific pain point: "CapMX pricing is ridiculous. It costs $3K for a company to access its own cap table." This identifies a clear 'villain' in the market that eShares is rescuing customers from.
Efficiency and the Ask
Slide 11 highlights the company's capital efficiency. "In one year and $1.2M, we built..." followed by a list of achievements including 360+ paying companies and $300M+ in private stock managed. The most striking point is "Zero sales people." This suggests a product so good it sells itself, which is music to a Series A investor's ears.
Slide 12 delivers the ask: $6M-$8M Series A . They repeat the graphic from Slide 2, reinforcing the goal to "converge the private market" and take companies public. This repetition ensures the 'Big Vision' is the last thing the investor remembers before the appendix.
The Appendix: Deep Dives and Data Moats
The appendix (Slides 13-21) contains some of the most strategic thinking in the deck. Slide 14 , the "Ownership Map," is a visual representation of their network effect. It shows a web of funds and companies, proving that as eShares signs one company, they get visibility into all that company's investors, who then bring their other portfolio companies onto the platform.
Slide 15 addresses Risk Factors with refreshing honesty. They acknowledge that a "systemic market downturn in tech" or a "security breach" could derail them. This builds trust with investors by showing the founders are not blind to the fragility of a fintech startup.
Slides 19, 20, and 21 detail their strategy for 409A valuations. They aim to "consolidate valuation services" by using the data they already have on the cap table. Slide 21 shows the math: by valuing a company once and selling "views" into that data to the corporation and its 20+ investors, they can turn a $500 service into $2,500 in revenue while still offering an 80% discount to the end-user. This is the definition of a data moat.
What Makes This Deck Work?
1. Specificity Over Generalization: eShares didn't just say they were better; they listed the exact dollar amounts competitors charged and the exact features they lacked. This specificity makes the argument undeniable.
2. The Network Effect Visualization: The Ownership Map (Slide 14) is a brilliant way to turn a boring cap table into a high-growth network. It shifts the perception of the company from a 'tool' to a 'platform.'
3. Alignment of Incentives: The pricing slide (Slide 5) shows that eShares wins when their customers win (i.e., when they hire more people and issue more options). This alignment is a powerful narrative for investors who want to see scalable, usage-based growth.
What Is Missing?
1. A Dedicated Team Slide: In the 21 slides provided, there is no team slide. While the founders' names appear in screenshots, a dedicated slide highlighting their background in finance or software would have strengthened the 'why us' narrative. (Note: This may have been in the 20 slides not included in this set).
2. Detailed Use of Funds: While they ask for $6M-$8M, they don't provide a breakdown of how that capital will be deployed (e.g., % to engineering vs. % to the new sales team mentioned on Slide 11).
Founder's Guide: What to Copy
The 'Food Chain' Slide: Every startup should have a slide that shows where they are today and the massive incumbents they intend to displace tomorrow. It bridges the gap between a niche product and a venture-scale outcome. · The Competitive Feature Matrix: Don't just use vague bubbles. Use a checklist of specific, technical features that your competitors lack. It proves you have done the work and understand the customer's frustration. · The 'Lean and Mean' Slide: If you have achieved significant traction on a small budget, shout it from the rooftops. It proves you are a good steward of capital, which is a primary concern for Series A investors. · Honest Risk Assessment: Listing your risks doesn't make you look weak; it makes you look prepared. It allows you to control the narrative around those risks rather than letting investors whisper about them behind your back.
Frequently asked questions
- What was the primary problem eShares aimed to solve?
- eShares targeted the 'operational nightmare' of managing equity through paper certificates and manual spreadsheets. By digitizing the issuance of shares, options, and warrants, they aimed to become the central system of record for private company ownership, reducing legal costs and administrative errors.
- How did eShares differentiate its pricing from traditional SaaS?
- Unlike typical monthly subscriptions, eShares initially focused on a transaction model, charging $20 per certificate or note issued. This lowered the initial cost for startups while ensuring that as a company grew and issued more equity to employees, eShares' revenue scaled automatically without requiring a sales upsell.
- What was the 'Ownership Map' mentioned in the deck?
- The Ownership Map was a visualization of the nodes (funds and companies) and edges (investments) within the eShares ecosystem. It served as proof that the platform was becoming a network; as more companies joined, their investors were pulled into the platform, creating a powerful defensible moat.
- Who were the main competitors identified in the 2014 deck?
- The deck specifically names Solium Capital (CapMX) as the primary head-to-head competitor. It also lists 'food chain' incumbents like Computershare and Broadridge, which dominated the public market transfer agent space, as the ultimate targets for eShares to displace.
- What were the key risks eShares disclosed to investors?
- eShares was remarkably transparent about risks, citing four main threats: transaction revenue not meeting forecasts, a systemic market downturn in tech, failure to win over major law firms (who act as gatekeepers), and the potential for a catastrophic security breach.