Ennovate Research Investment & Capital (ERIC) is a quantitative investment firm utilizing mathematical algorithms to generate trading signals across multiple asset classes. The deck highlights a disciplined trend-following strategy designed to maximize returns while diminishing volatility over the long term. With a stated vision of global institutional fund management, the firm presents a mix of backtested data from 2007-2014 and live performance metrics from 2013-2014. The investment structure is defined by a minimum account size of Rs. 10,00,000, a 2-year lock-in period, and a 2% AUM fee. W…
Key takeaways
- The firm utilizes a systematic trend-following program inspired by the U.S. CTA sector (Slide 3).
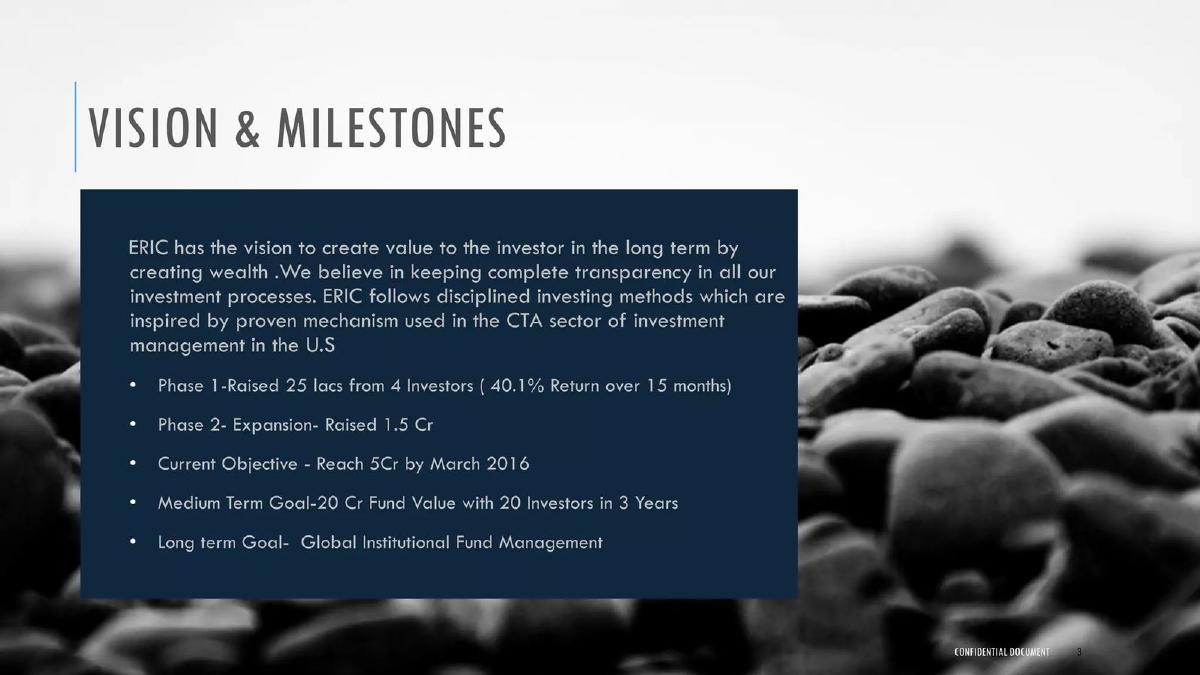
- Phase 1 involved raising 25 lacs from 4 investors, achieving a 40.1% return over 15 months (Slide 3).
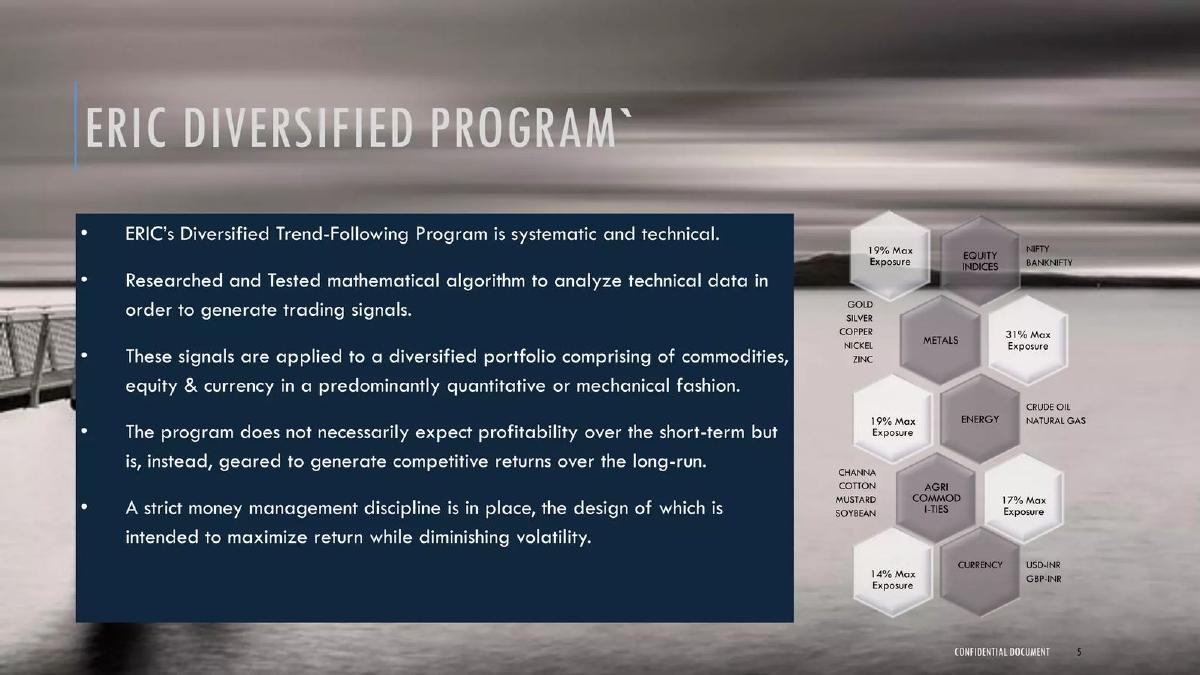
- The portfolio is diversified across Equity Indices (19% max exposure), Metals (31%), Energy (19%), Agri Commodities (17%), and Currency (14%) (Slide 5).
- Backtested performance from 2007 to 2014 shows a post-tax CAGR of 21.7% (Slide 7).
- Live performance data from July 2013 to October 2014 indicates an annual CAGR of 41% (Slide 7).
- Investment terms require a minimum account size of Rs. 10,00,000 with a 2-year lock-in period (Slide 9).
- Risk management is strictly defined, with trading suspended if base capital reduces by Rs. 5,00,000 (Slide 9).
- The deck omits a team slide, competitive landscape analysis, and a specific funding 'ask' for the next phase (General Observation).
Executive Summary: Quantitative Trend Following
Ennovate Research Investment & Capital (ERIC) presents a deck that functions more as a private placement memorandum or a fund prospectus than a traditional startup pitch deck. The presentation focuses heavily on the mechanics of their 'Diversified Trend-Following Program' and the historical performance of their algorithms. The firm positions itself as a systematic, technical alternative to traditional discretionary fund management, drawing direct inspiration from the U.S. CTA (Commodity Trading Advisor) market.
Slide 1: Title Slide
The title slide is minimalist, featuring the company name 'ENNOVATE RESEARCH INVESTMENT & CAPITAL' against a high-contrast black-and-white image of rocks and mist. There is no tagline or immediate value proposition on the cover, establishing a sober, institutional tone from the outset.
Slide 3: Vision & Milestones
This slide establishes the company's trajectory and philosophical foundation. ERIC claims a vision of creating long-term value through transparency and disciplined investing. Notably, they cite the U.S. CTA sector as their primary influence. The milestones are listed as follows:
Phase 1: Raised 25 lacs from 4 investors, achieving a 40.1% return over 15 months. · Phase 2: Expansion phase, having raised 1.5 Cr. · Current Objective: Reach 5Cr by March 2016. · Medium Term Goal: 20 Cr Fund Value with 20 Investors in 3 Years. · Long term Goal: Global Institutional Fund Management.
The progression shows a clear intent to scale from a small private pool to a global institutional player, though the timeline suggests the deck was produced around 2015.
Slide 5: ERIC Diversified Program
This slide details the technical 'how' of the business. The program is described as systematic, technical, and quantitative. The firm uses mathematical algorithms to generate trading signals, which are then applied to a diversified portfolio. A hexagonal graphic on the right side of the slide breaks down the maximum exposure limits for various asset classes:
Metals (Gold, Silver, Copper, Nickel, Zinc): 31% Max Exposure. · Equity Indices (Nifty, Banknifty): 19% Max Exposure. · Energy (Crude Oil, Natural Gas): 19% Max Exposure. · Agri Commodities (Channa, Cotton, Mustard, Soybean): 17% Max Exposure. · Currency (USD-INR, GBP-INR): 14% Max Exposure.
The slide explicitly states that the program is geared for long-run returns rather than short-term profitability, emphasizing a 'mechanical' approach to money management intended to diminish volatility.
Slide 7: Backtested & Live Performance
Slide 7 is the most data-dense portion of the deck, presenting two tables and two corresponding line graphs. The top table shows 'Backtested' performance from 2007 to 2014. It starts with a base of 1,000 (VAAI - Value Added Index) and grows to 3,943 by 2014. The annual returns range from a high of 53.6% in 2008 to a low of 10.2% in 2014, resulting in a post-tax CAGR of 21.7%.
The bottom table shows 'Live' performance from July 2013 to October 2014. This period shows significant volatility, including a 24% gain in Q3 2013 followed by a 13% loss in Q4 2013. Despite the fluctuations, the slide claims an annual CAGR of 41% for the live period. The use of both backtested and live data is a standard requirement for quantitative funds to prove the algorithm's efficacy in different market regimes.
Slide 9: Investment Process
This slide serves as the 'Terms' sheet for potential clients. It outlines the operational requirements for participating in the fund:
Minimum Account Size: Rs. 10,00,000 with Rs. 2,50,000 additional committed capital. · Lock-in Period: 2 years. · Target Return: 25% Post Tax Net Return. · Fees: 2% of AUM (Assets Under Management). · Hurdle Rate: 8% of AUM. · Risk Management: A hard stop is set at a Rs. 5,00,000 loss (40% of committed capital), at which point trading is suspended and funds are returned.
A flow chart on the right illustrates the relationship between the Investor Bank Account, ERIC Advisory Services, and the Investor's Broker Account, suggesting a non-custodial advisory model where trades are ordered by ERIC but executed in the client's own brokerage environment.
Slide 11: Disclaimer
The final slide is a standard legal disclaimer. It clarifies that the presentation is for informational purposes only and does not constitute investment advice or an offer to sell securities. It includes standard language regarding 'forward-looking statements' and the caveat that 'past performance is not a guide to future results.' The company is identified here as 'Ennovate Solutions.'
What Works
The deck is highly specific regarding its strategy and risk parameters. In the world of quantitative finance, vagueness is a red flag; ERIC avoids this by providing exact exposure limits (Slide 5) and a clear 'circuit breaker' for losses (Slide 9). The distinction between backtested and live performance (Slide 7) provides a level of transparency that is necessary for building trust with sophisticated investors. The fee structure and hurdle rates are clearly defined, leaving no ambiguity about the cost of the service.
What is Missing
The most glaring omission is a Team Slide . In fund management, the pedigree of the mathematicians and traders behind the algorithm is paramount. Without knowing who 'Eric' is or the credentials of the research team, an investor cannot assess the 'key man risk' or the intellectual capital of the firm. Additionally, there is no Competitive Analysis . The deck mentions the U.S. CTA sector but does not explain how ERIC competes with other Indian quantitative shops or traditional mutual funds. Finally, there is no Ask for the company itself; the deck focuses on attracting individual client capital rather than venture investment into the management company.
Founder Takeaways
Founders building fintech or investment platforms should note the clarity of the risk management slide (Slide 9). By defining exactly when they will stop trading and return money, they address the investor's greatest fear: a total loss. Furthermore, the asset allocation breakdown (Slide 5) is a great example of how to visualize a complex diversified strategy simply. However, founders should avoid the mistake of omitting the team; even the best algorithm needs a human face to secure significant capital commitments.
Frequently asked questions
- What is the core investment strategy of ERIC?
- ERIC employs a systematic and technical 'Diversified Trend-Following Program.' As detailed on Slide 5, the firm uses researched mathematical algorithms to analyze technical data and generate trading signals. These signals are applied to a portfolio of commodities, equities, and currencies in a quantitative, mechanical fashion intended to maximize returns while minimizing volatility over the long term.
- What are the specific asset class exposure limits?
- According to Slide 5, the program maintains strict exposure caps: Metals are the largest at 31% max exposure, followed by Equity Indices (Nifty/Banknifty) at 19%, Energy (Crude/Natural Gas) at 19%, Agri Commodities (Channa, Cotton, etc.) at 17%, and Currency (USD-INR, GBP-INR) at 14%.
- How has the fund performed historically?
- Slide 7 presents two data sets. Backtested data from 2007-2014 shows a pre-tax CAGR of 30.8% and a post-tax CAGR of 21.7%. Live performance data covering July 2013 to October 2014 shows a higher annual CAGR of 41%, though it includes periods of volatility, such as a -13% return in the quarter ending December 2013.
- What are the entry requirements for new investors?
- Slide 9 outlines the 'Investment Process,' requiring a minimum account size of Rs. 10,00,000 with an additional Rs. 2,50,000 in committed capital. Investors must commit to a minimum 2-year horizon and a 2-year lock-in period. The fee structure includes a 2% AUM fee and an 8% hurdle rate of return.
- What risk mitigation measures are in place?
- The firm utilizes a 'strict money management discipline.' Slide 9 specifies that the maximum risk taken is 40% of committed capital (Rs. 5,00,000). If the base capital reduces by this amount, trading is automatically suspended, and the remaining funds are returned to the investor, providing a hard floor for potential losses.