Equals secured $16M in Series A funding in 2022, led by Andreessen Horowitz, to challenge the business intelligence status quo. Their 21-slide deck (including a 7-slide 'Data Deck' appendix) succeeds by leaning into the familiarity of the spreadsheet rather than trying to reinvent the wheel. The narrative is built on the premise that while the world has changed, Excel has not, creating a friction-filled workflow for modern data analysis. By showcasing a product that looks and feels like a spreadsheet but connects directly to live data sources, Equals presents a low-friction path to adoption.…
Key takeaways
- The deck explicitly positions Equals as a replacement for Excel for analysis, rather than just another BI tool (Slide 5).
- It uses a 'Data Deck' appendix to provide granular transparency on metrics like DAU/WAU and lead-to-customer conversion rates (Data Deck Slides 4-6).
- The founders leverage their Intercom pedigree, highlighting their experience scaling from $1M to $160M+ ARR (Slide 13).
- The product roadmap is clearly bifurcated between what was built in the last 18 months and what is planned for the next 12 (Slides 11-12).
- Equals identifies its primary buyers as Founders, early Finance folks, and CTOs, showing a clear understanding of their initial market wedge (Data Deck Slide 5).
- The deck highlights early customer success with high-profile logos like Notion to validate the product's utility in complex environments (Slide 8).
- The 'Ask' slide is specific, seeking $15M to scale the team to 44 total headcounts across GTM and R&D (Slide 14).
- The narrative starts by validating the spreadsheet as the 'best way to do analysis,' neutralizing the objection that spreadsheets are obsolete (Slide 2).
The Narrative: Embracing the Spreadsheet
The Equals Series A deck is a masterclass in 'Judo' positioning. Instead of fighting against the dominance of Excel, Equals embraces the spreadsheet as the superior interface for analysis. The deck moves quickly from a philosophical stance to a product-led demonstration of how that interface can be modernized for the cloud era. By the time the investor reaches the team and traction slides, the logic of the product feels inevitable.
Slides 1-5: The Philosophical Hook
Slide 1 introduces the company with a simple, bold tagline: "A modern spreadsheet for modern analysis." The aesthetic is clean, using a light purple background that distinguishes it from the traditional green of Excel or blue of Google Sheets.
Slide 2 makes a definitive statement: "The spreadsheet is the best way to do analysis." This is a strategic move. By validating the user's existing behavior, Equals avoids the 'change management' hurdle that plagues most Business Intelligence (BI) tools. They aren't asking users to stop using spreadsheets; they are asking them to use a better one.
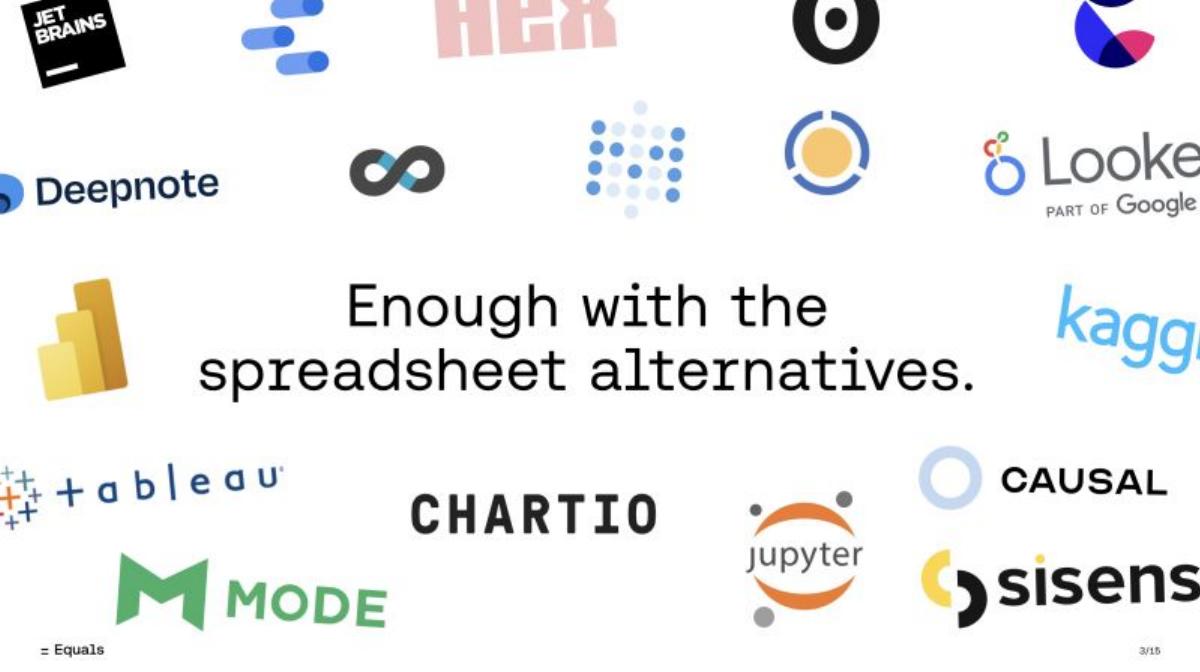
Slide 3 takes a direct shot at the market. Under the header "Enough with the spreadsheet alternatives," the slide displays a chaotic cloud of logos including Tableau, Looker, Mode, and Sisense. This slide communicates that despite decades of BI innovation, the spreadsheet remains the default, and Equals is the only one leaning into that reality.
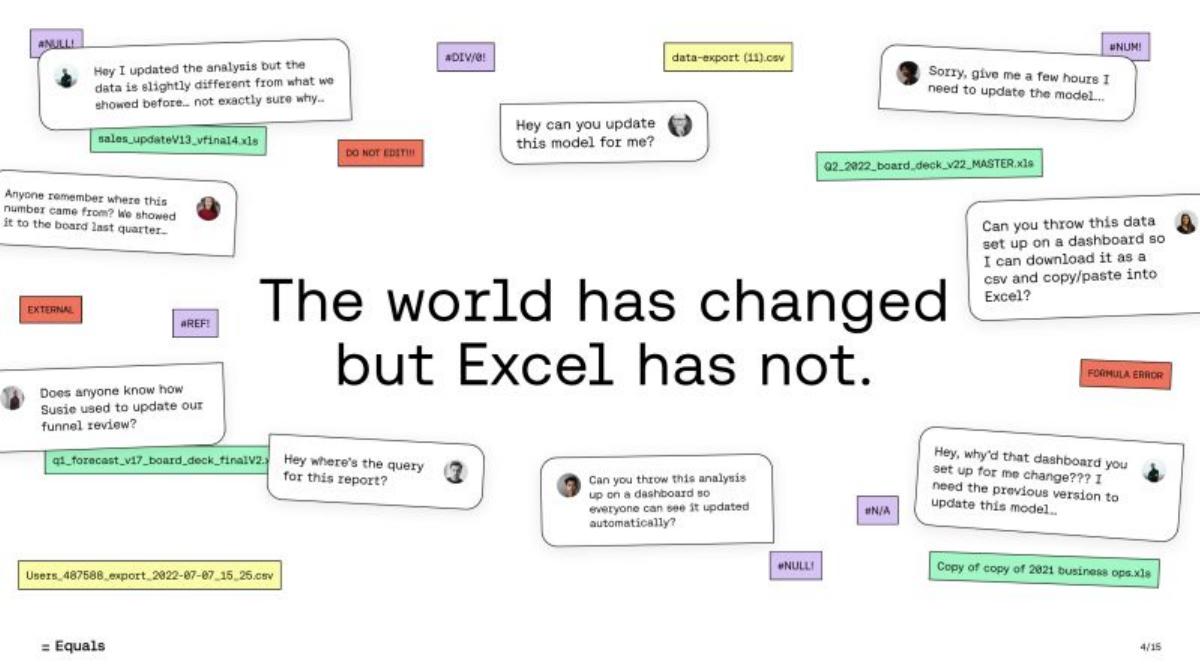
Slide 4 visualizes the pain point. It features a collage of chat bubbles and error messages common in data workflows: "#REF!", "formula error", and "can you update this model for me?" It summarizes the problem in one sentence: "The world has changed but Excel has not." This sets the stage for the mission statement on Slide 5 : "Replace Excel for analysis."
Slides 6-8: The Product and Social Proof
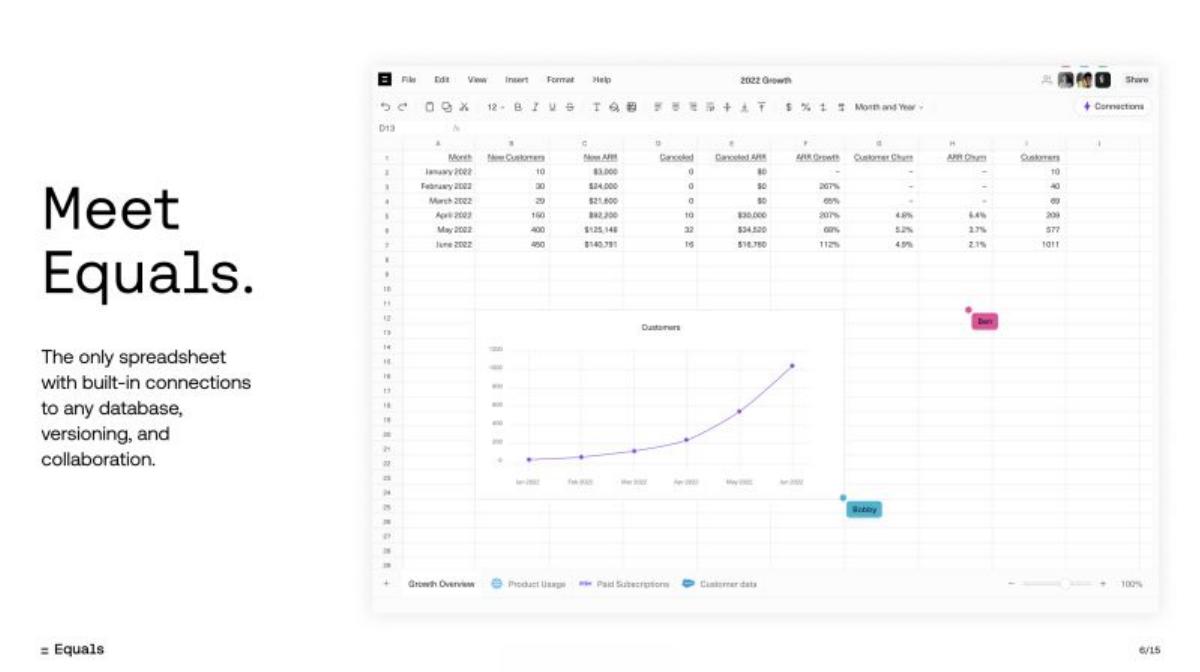
Slide 6 is the first look at the product. It shows a UI that is indistinguishable from a standard spreadsheet at first glance, but the sidebar and 'Connections' button highlight the core value proposition: built-in connections to databases, versioning, and collaboration. The chart in the center shows a growth curve, subtly reinforcing the theme of success.
Slide 7 (omitted in the numbering but implied in the flow) likely detailed features, leading into Slide 8 , which focuses on early success. Equals uses three high-signal testimonials. The most prominent is from Notion, stating they have automated their Revenue Recognition report using Equals. For a Series A company, having a 'productivity darling' like Notion as a power user is a massive validation of the product's sophistication.
Slides 9-12: Traction and Roadmap
Slide 9 and Slide 10 are placeholders for the 'Data Deck' that follows later. They promise "Strong validation of market and product, months after launch," citing a public launch in June 2022. These slides act as a bridge, telling the investor that the following narrative is backed by hard numbers.
Slide 11 provides a retrospective of the last 18 months, categorized into Foundations, Data Connections, Team Workflow, and Automation. It lists technical achievements like a "Calculation engine," "100+ Functions," and "SQL Editor w/ autocomplete." This proves the team can ship complex infrastructure.
Slide 12 looks forward to the next 12 months. New features are highlighted in green, including "Google Sheets importer," "Cross-datasource joins," and "OpenAI for SQL." This roadmap shows a clear path toward removing friction (importer) and adding modern power-user features (AI and cross-source joins).
Slides 13-14: The Team and The Ask
Slide 13 presents the team. The pedigree here is the deck's strongest asset. CEO Bobby Pinero and CPO Ben McRedmond highlight their roles at Intercom, specifically their experience scaling the company to $160M and $50M ARR, respectively. The supporting team is shown with years of experience (ranging from 1 to 18 years), emphasizing a high-seniority engineering culture.
Slide 14 is the 'Ask.' Equals sought "around $15M" for their Series A. The plan is split evenly between GTM and R&D, with a goal of reaching 22 headcounts in each department. The clarity of this slide—stating exactly how many people they intend to hire—demonstrates disciplined operational planning.
The Data Deck: A Deep Dive into Metrics
Starting at Slide 15 , the deck shifts into an appendix titled "Data Deck." This is where the founders provide the 'raw' evidence for their claims. While the charts themselves are simplified for the presentation, the headers tell a compelling story of a healthy SaaS funnel.
Data Deck Slide 2: Claims growth in ARR since the April sneak peek, though specific dollar amounts are redacted in this version. · Data Deck Slide 3: Shows consistent growth in top-of-funnel metrics: Website traffic, Leads, and Demos. · Data Deck Slide 4: Focuses on conversion rates (Visit to Lead, Lead to Demo, Demo to Customer). The text notes these are "all cohorted based on the week the lead first signed up," showing a sophisticated approach to data analysis. · Data Deck Slide 5: Identifies the 'Buyer Distribution.' They sell best to Founders, early Finance folks, and CTOs. It also lists connected datasources like BigQuery, Snowflake, and Salesforce, proving they are integrated into the modern data stack. · Data Deck Slide 6: Reveals engagement: "Paid customers are active around 3 days of the week." For a tool meant for deep analysis (rather than daily communication), 3 days a week is a high frequency. · Data Deck Slide 7: Concludes with a table showing Gross New ARR, Churn, and Net New growth month-over-month from February to August 2022.
What Equals Does Well
The Equals deck succeeds because it avoids the 'feature soup' trap. Instead of listing fifty things the software can do, it focuses on one thing the software is: a spreadsheet that works with live data. By framing the product as the 'modern' version of a tool everyone already knows, they lower the cognitive load for the investor. The inclusion of the 'Data Deck' is also a brilliant move; it signals to investors that the founders are data-driven operators who have nothing to hide.
What is Missing
There are a few notable omissions in the deck. First, there is no explicit Market Size (TAM) slide. While one could argue that the market for 'Excel replacements' is self-evidently massive, most Series A decks still attempt to quantify the opportunity. Second, there is no Pricing or Unit Economics slide. We see that they have paid customers and that retention is 'strong,' but we don't know the Average Contract Value (ACV) or the Customer Acquisition Cost (CAC). Finally, while they mention competitors on Slide 3, they don't provide a Feature Comparison Matrix . They rely on the narrative that their 'interface' is the differentiator, rather than a specific list of technical specs.
Founders: What to Copy
The 'Anti-Alternative' Slide: If you are entering a crowded market, don't just list your competitors. Group them together and explain why the entire category is failing the user, as Equals does on Slide 3. · The Pedigree Highlight: If you have scaled a famous company before, make that the centerpiece of your team slide. Use specific ARR milestones (e.g., "scaled from $1M to $160M") to give the numbers weight. · The Bifurcated Roadmap: Showing what you built (Slide 11) versus what you will build (Slide 12) builds credibility. It proves you can execute before you ask for money to build the future. · The Data Appendix: Don't wait for due diligence to show your cohorts and conversion rates. Including a 'Data Deck' shows confidence and speeds up the investment decision process.
Frequently asked questions
- What is the core problem Equals is solving?
- Equals addresses the 'broken' workflow of modern data analysis in traditional spreadsheets. While data sources have moved to the cloud, Excel remains a static environment requiring manual exports, copy-pasting, and versioning nightmares. Slide 4 illustrates this through a collage of common workplace frustrations like 'formula errors' and 'outdated models,' positioning Equals as the solution that brings live data connections directly into the spreadsheet interface.
- How does Equals differentiate itself from other BI tools?
- Unlike Tableau or Looker, which require learning new interfaces or proprietary languages, Equals leans into the spreadsheet. Slide 3 explicitly says 'Enough with the spreadsheet alternatives,' showing logos of competitors. Equals differentiates by being the 'only spreadsheet with built-in connections to any database, versioning, and collaboration' (Slide 6), essentially keeping the user in a familiar environment while fixing the underlying data plumbing.
- What does the 'Data Deck' appendix reveal about their traction?
- The Data Deck (Slides 15-21) provides a level of transparency rarely seen in public decks. It shows that paid customers are active approximately 3 days a week (Data Deck Slide 6) and tracks the top-of-funnel growth from website traffic to demos (Data Deck Slide 3). It also lists specific data sources being connected, such as BigQuery, Snowflake, and Stripe, proving the product is being used for real-world data stacks.
- Who are the founders and what is their background?
- The team is a significant part of the investment thesis. CEO Bobby Pinero and CPO Ben McRedmond were both early executives at Intercom. Pinero scaled Intercom from $1M to $160M+ ARR over seven years, while McRedmond was the first employee and led growth to $50M ARR (Slide 13). This 'operator-founder' profile suggests they have the experience to scale a high-growth SaaS company.
- What is the planned use of the Series A funds?
- Equals aimed to raise $15M (ultimately raising $16M) to aggressively expand their headcount. Slide 14 outlines a plan to scale the Go-to-market team to 22 people to accelerate content and product launches, and to triple the R&D team to 22 people. This balanced investment in both product development and sales indicates a transition from product-market fit discovery to scaling.