EquityBee addresses a specific, high-pain problem: startup employees losing their equity because they cannot afford the strike price and taxes required to exercise options. The deck effectively uses a marketplace narrative, positioning the company as the bridge between 'Builders' (employees) and 'Investors.' With a concise 12-slide structure, the presentation leans heavily on early traction, citing a 30% month-over-month growth rate and a portfolio of over 100 companies including Uber, Fiverr, and Wework. While the deck lacks a specific 'Ask' slide or detailed unit economics, the strength of…
Key takeaways
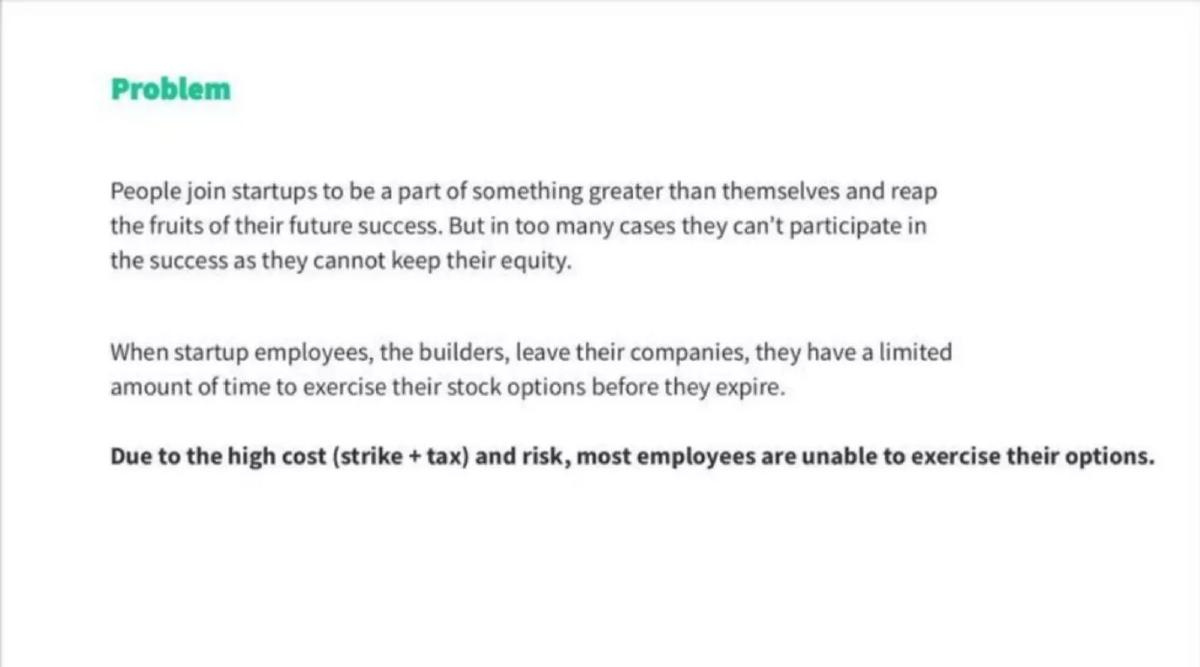
- The problem is framed as a financial barrier: employees cannot participate in success due to the high cost of strike prices and taxes (Slide 2).
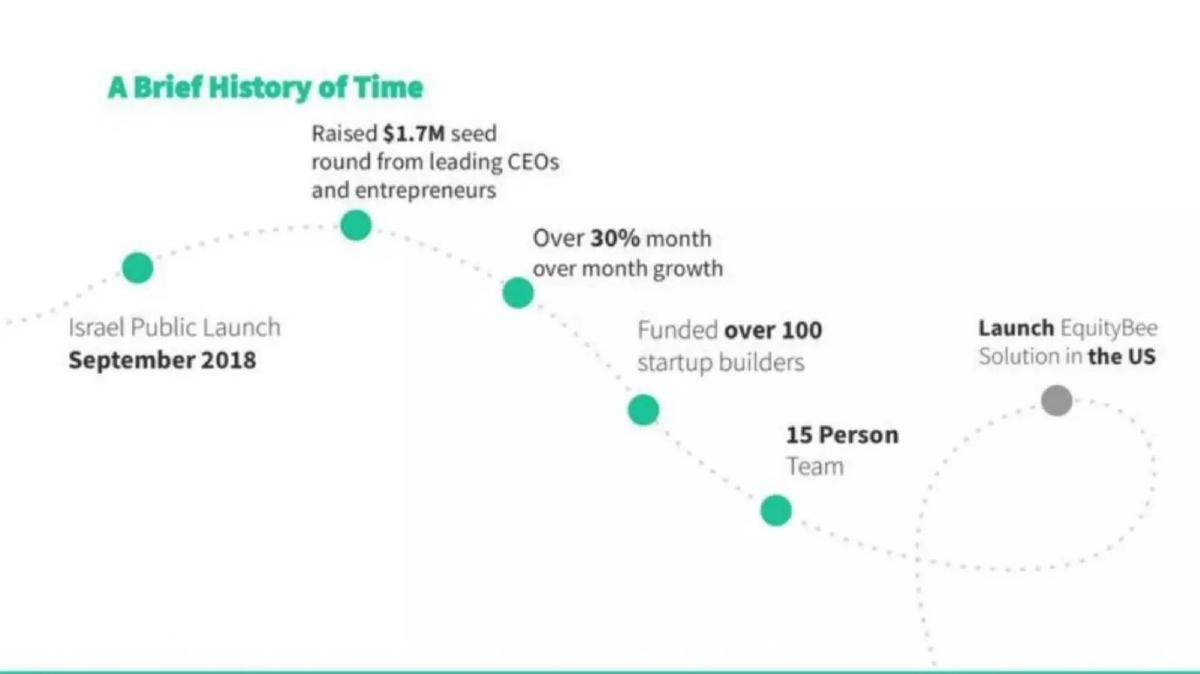
- Traction is demonstrated through a 30% month-over-month growth rate since the September 2018 Israel launch (Slide 4).
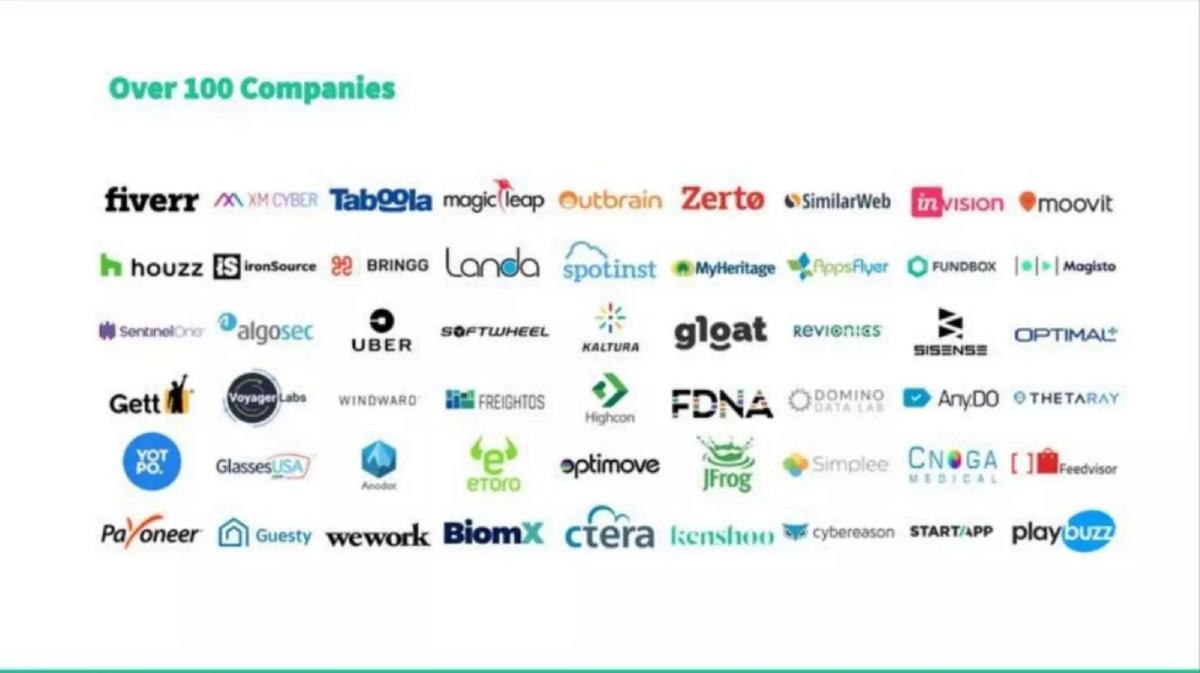
- The company has already funded over 100 startup builders across major tech firms like Uber, Wework, and Magic Leap (Slide 5).
- The revenue model is based on a 5% upfront transaction fee (Slide 9).
- EquityBee calculates its Total Addressable Market (TAM) at $3 billion, derived from a $60 billion total annual exercise cost (Slide 9).
- The marketplace is bifurcated into two value propositions: risk-free capital for employees and discounted startup access for investors (Slides 7 and 8).
- The founding team possesses significant pedigree, including a co-founder whose previous company was acquired by Grubhub for $150M (Slide 11).
- The deck utilizes a competitive landscape matrix that positions EquityBee as the only 'Large Scale P2P' solution for 'Stock Options' (Slide 10).
Executive Summary: The Liquidity Bridge
EquityBee’s pitch deck is a focused, 12-slide presentation that addresses a systemic failure in the startup ecosystem: the inability of employees to realize the value of their vested options. The deck, dated September 2019, follows a classic problem-solution-traction arc. It identifies a $60 billion annual exercise cost and positions itself as the marketplace to capture a 5% fee on that volume. By the time this deck was circulated, the company had already established a foothold in the Israeli market and was signaling a launch into the US market.
Slides 1-3: The Core Thesis
Slide 1: Title Slide The deck opens with the brand name and the tagline: "You Built It, Now Own It." This immediately frames the company as a champion for the employee, rather than just another fintech platform. The date is listed as September 2019.
Slide 2: Problem The problem slide is text-heavy but precise. It identifies that startup employees have a limited window to exercise options after leaving a company. The "high cost (strike + tax) and risk" are cited as the primary reasons most employees are unable to exercise, leading to a loss of equity. This sets the stage for a solution that removes the capital barrier.
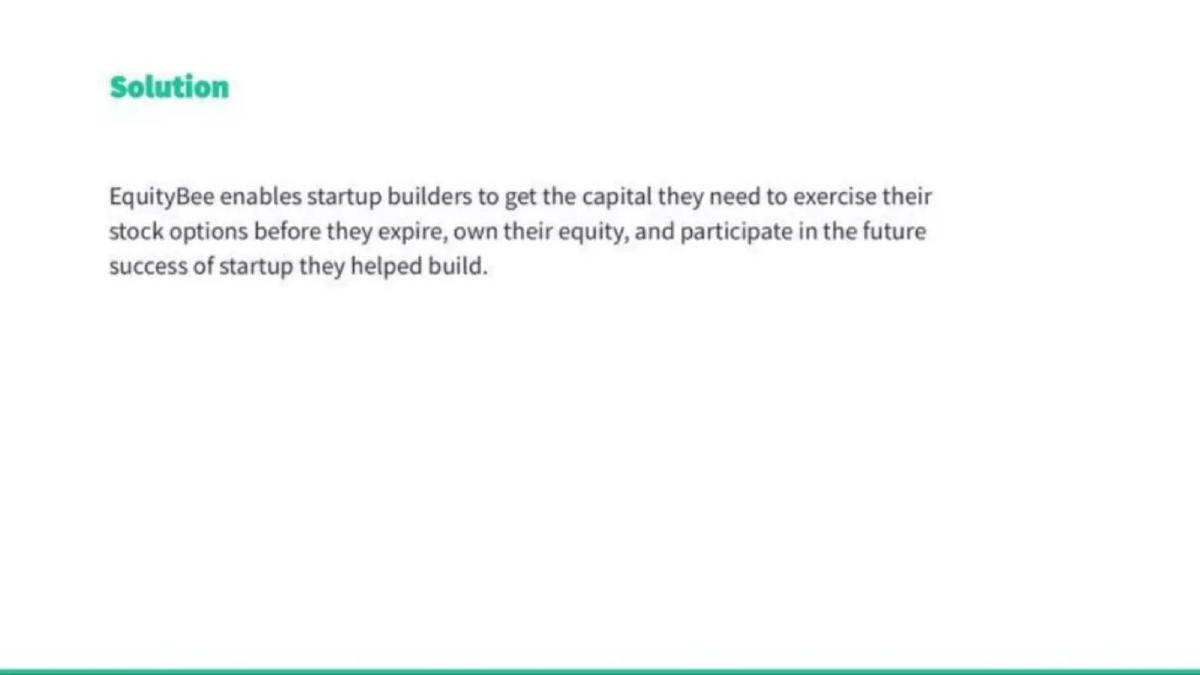
Slide 3: Solution The solution is presented as a direct mirror to the problem. EquityBee enables "startup builders" to get the capital they need to exercise before expiration. The focus remains on the emotional and financial benefit of participating in the "future success of the startup they helped build."
Slides 4-6: Traction and Proof of Concept
Slide 4: A Brief History of Time This timeline slide serves as the primary traction indicator. It notes a September 2018 public launch in Israel, a $1.7M seed round, and a 15-person team. Crucially, it claims "Over 30% month over month growth" and that they have already "Funded over 100 startup builders." The final node on the timeline is the "Launch EquityBee Solution in the US," which likely represents the primary purpose of the funding round this deck supported.
Slide 5: Over 100 Companies This is a logo wall, but unlike most decks that show prospective customers, these are the companies where EquityBee has already facilitated transactions. High-profile names include Uber, Wework, Magic Leap, Fiverr, Taboola, and IronSource. This slide validates that the problem exists across the entire spectrum of the tech industry, from decacorns to mid-stage startups.
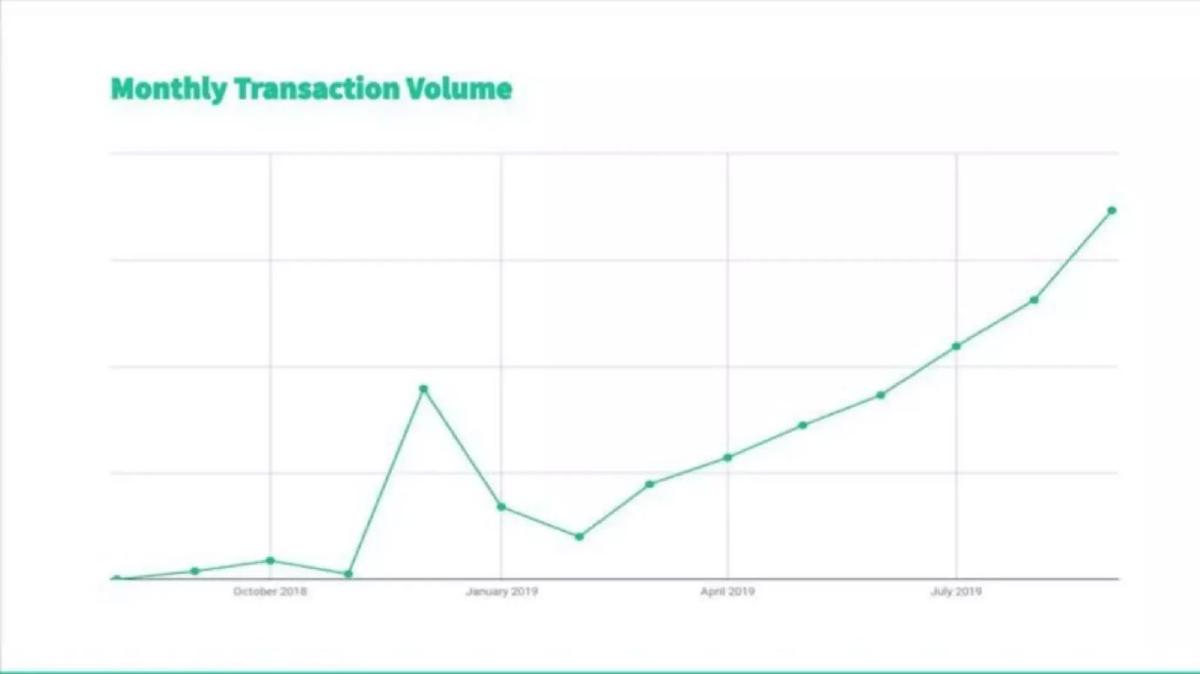
Slide 6: Monthly Transaction Volume The deck includes a line graph showing transaction volume from October 2018 to July 2019. While the Y-axis is not labeled with specific dollar amounts, the trajectory is clearly positive. There is a significant spike in January 2019, followed by a dip and then a steady, steep climb through the summer of 2019. This visualizes the "30% month over month growth" mentioned earlier.
Slides 7-9: The Marketplace Dynamics
Slide 7: Builders (employees) This slide breaks down the value proposition for the supply side of the marketplace. It emphasizes a "Risk free solution with no upfront out of pocket expense." This is a critical distinction for the business model—the employee isn't taking a loan; they are entering a profit-sharing agreement.
Slide 8: Investors The demand side of the marketplace is addressed here. For investors, EquityBee offers access to private companies at a "Discounted price, based on a valuation set in the past." This is a powerful hook for investors who are otherwise locked out of high-growth private companies or forced to pay current-round premiums on secondary markets.
Slide 9: Revenue Model & TAM This is the most data-dense slide in the deck. It calculates a $60B total annual exercise cost based on 6 million tech employees in the private sector with an average $10K annual exercise cost. EquityBee then applies a "5% upfront transaction fee" to arrive at a $3 Billion Total Addressable Market. Footnotes clarify that 70% of options go to non-executives and the average exercise rate is 45%, adding layers of realism to their assumptions.
Slides 10-12: Competition, Team, and Closing
Slide 10: Competitive Landscape The company uses a standard 2x2 matrix. The axes are "Stocks vs. Stock Options" and "Manual Process vs. Large Scale P2P." EquityBee places itself in the top-right quadrant (Large Scale P2P / Stock Options). Other competitors are blurred out, but the visual suggests that most existing solutions are either manual or focused on traditional stock secondaries rather than option exercise funding.
Slide 11: Founding Team The team slide is a strong point for the deck. Oren Barzilai (CEO) is noted as a former co-founder of Tapingo, which was acquired by Grubhub for $150M. Both Barzilai and Oded Golan (CPO) served in the Israeli Army intelligence corps (units 8200 and similar), a common pedigree for high-growth tech founders. Mody Radashkovich (COO) brings institutional weight, having managed a portfolio with 250M Euro in AUM. This combination of successful exits, technical background, and capital markets experience is a significant de-risking factor for Series B investors.
Slide 12: Closing A simple thank you slide with the company URL. Notably, there is no mention of the specific amount being raised or the intended use of funds within these 12 slides.
What Works in the EquityBee Deck
Clear Marketplace Bifurcation: By dedicating separate slides to "Builders" and "Investors," the deck clearly explains how it solves different problems for each side of the transaction. · Logo Authority: Slide 5 is exceptionally strong. By showing they have already operated within the cap tables of companies like Uber and Wework, they bypass the question of whether startup HR departments or legal frameworks will allow their model to function. · TAM Logic: The math on Slide 9 is transparent. Even if an investor disagrees with the $60B starting figure, the 5% fee model is easy to understand and project. · Founder Pedigree: The $150M exit mentioned for the CEO provides immediate evidence that the leadership knows how to build and sell a company.
What is Missing from the EquityBee Deck
The Ask: There is no slide detailing how much capital is being raised or what the specific milestones for the next 18-24 months are. · Unit Economics: While the 5% fee is mentioned, there is no data on the Cost of Customer Acquisition (CAC) or the Lifetime Value (LTV) of an investor or a builder. · Regulatory/Legal Detail: Option exercise funding is a legally complex area involving tax law and securities regulation. The deck avoids these complexities entirely, which might be a deliberate choice for a high-level pitch but would be a major focus of due diligence. · Exit Strategy for Investors: The deck explains how investors get into the deals, but it doesn't explicitly detail the mechanics of how they get out (e.g., at an IPO or M&A event) and how EquityBee manages those payouts.
What Founders Should Copy
The "History of Time" Slide: Using a curved timeline to show the progression from launch to team growth to traction is a visually effective way to demonstrate momentum. · Specific Value Props: Don't just say "we are a marketplace." Use separate slides to define exactly what the "Give" and "Get" is for each participant in your ecosystem. · The 2x2 Matrix with a Twist: EquityBee’s choice of axes ("Large Scale P2P" vs "Manual") is clever because it frames the competition not just as "other companies," but as "inefficient ways of doing things." · Footnoted Assumptions: On the TAM slide, EquityBee uses footnotes to explain where their numbers come from (e.g., "Average exercise rate in the U.S. is 45%"). This builds trust with analytical investors who will inevitably question large market figures.
Frequently asked questions
- How does EquityBee make money according to the deck?
- According to Slide 9, EquityBee operates on a transaction-based revenue model. They charge a 5% upfront transaction fee. This fee is applied to the capital provided to employees for exercising their options. The slide notes that this 5% fee on the $60 billion total annual exercise cost in the tech sector results in their stated $3 billion Total Addressable Market.
- What is the core value proposition for startup employees?
- As detailed on Slide 7, the value proposition for 'Builders' (employees) is twofold. First, it provides a 'risk-free solution with no upfront out of pocket expense' to exercise options. Second, it allows them to retain their equity and participate in the future success of the company they helped build, which they would otherwise lose upon departure.
- What kind of traction did EquityBee show in this deck?
- The deck highlights significant early momentum on Slide 4 and Slide 6. They report over 30% month-over-month growth and have funded over 100 startup builders. Slide 6 shows a 'Monthly Transaction Volume' graph that, while lacking Y-axis denominations, illustrates a consistent upward trend from October 2018 through July 2019, with a notable spike in early 2019.
- Who are the investors EquityBee targets on their platform?
- Slide 8 explains that EquityBee provides investors with 'unique startup investment opportunities.' The benefits listed include access to any startup company, a 'discounted price' based on past valuations, and the ability to achieve wide diversification with reduced risk and zero friction compared to traditional secondary markets.
- Is there a specific funding ask in this 12-slide deck?
- No, the 12 slides provided do not include a specific 'Ask' or 'Use of Funds' slide. While the catalogue listing indicates the company eventually raised $85.3 million and reached a Series B stage, this specific presentation focuses on the problem, solution, traction, and team rather than the financial requirements of the round.