BackLive is a financial technology startup aiming to standardize financial strategy testing and execution. The deck positions the company as a comprehensive solution for backtesting, fundamental analysis, and automated trading, serving a dual market of sophisticated retail investors and small-to-mid-sized fund managers. With a product already live at backlive.io, the company seeks a $300,000 investment in exchange for a 20% preferred equity share. The deck relies heavily on detailed financial projections, forecasting a leap from $14,695 in revenue in FY 2014 to over $23 million by FY 2019. Wh…
Key takeaways
- The company defines its mission as commercializing software-based financial trading on slide 1.
- BackLive identifies two primary customer segments: sophisticated retail investors (primarily male, 20s-40s) and small-to-mid-sized fund managers on slide 5.
- The product is positioned as a 'standard in financial strategy testing & execution' with expansion plans into sports betting on slide 2.
- A competitive matrix on slide 6 claims BackLive is the only provider offering a combination of macro-economic testing, custom indicators, and an intuitive commercial website.
- Financial projections on slide 7 forecast a significant revenue jump from $361,792 in FY 2015 to $4,116,854 in FY 2016.
- The company is seeking $300,000 for a 20% preferred equity stake, implying a $1.5 million post-money valuation on slide 8.
- The deck projects an 82.5x Multiple of Money (MoM) and a 142% IRR for investors by FY 2019 on slide 8.
- Product screenshots on slides 3 and 4 demonstrate functional research and strategy modules, including fundamental comparative charting and built-in analytics.
Executive Summary: The Quantitative Trading Vision
BackLive presents itself as a sophisticated tool for the modern investor, bridging the gap between retail trading and professional-grade quantitative analysis. The deck is structured as a traditional business case, moving from vision to product, then to market positioning and finally to a detailed financial ask. The central thesis is that both retail and professional investors lack an integrated, intuitive system for testing and executing financial strategies across multiple asset classes.
Slide 1: Title and Mission
The opening slide establishes the brand identity with a clean logo and a clear subtitle: "Commercializing Software-Based Financial Trading." The background features a multi-colored line chart, likely representing different financial instruments or strategies, which immediately signals the company's focus on data-driven market analysis. The branding is consistent, using a dark palette with orange accents that persists throughout the deck.
Slide 2: The Bigger Vision
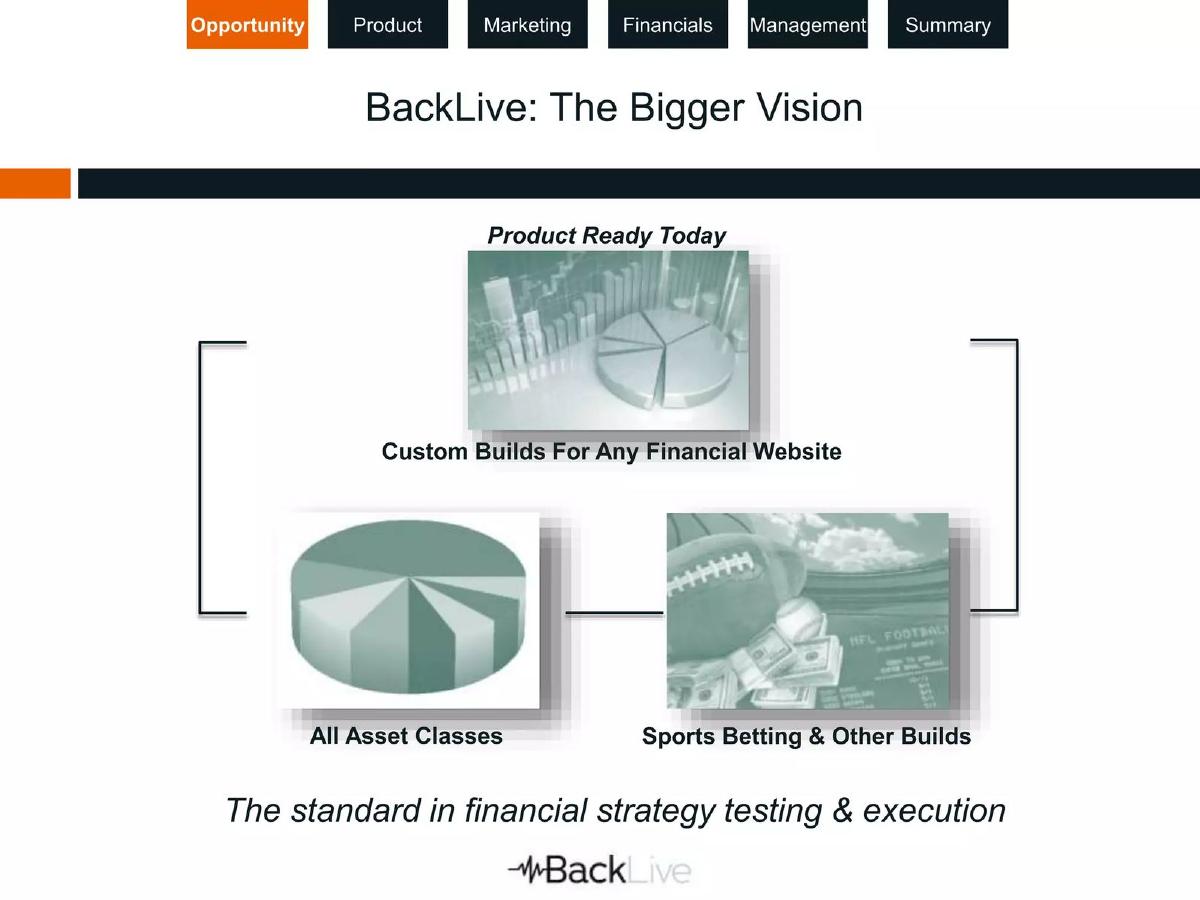
Slide 2 outlines the scope of the product. It claims the "Product Ready Today" and highlights three key areas of focus: "Custom Builds For Any Financial Website," "All Asset Classes," and "Sports Betting & Other Builds." The slide positions BackLive as "The standard in financial strategy testing & execution." This slide is crucial because it suggests the technology is modular and extensible beyond traditional stock markets, potentially opening up a larger Total Addressable Market (TAM) in the gambling and B2B white-label sectors.
Slide 3: Research and Comparative Charting
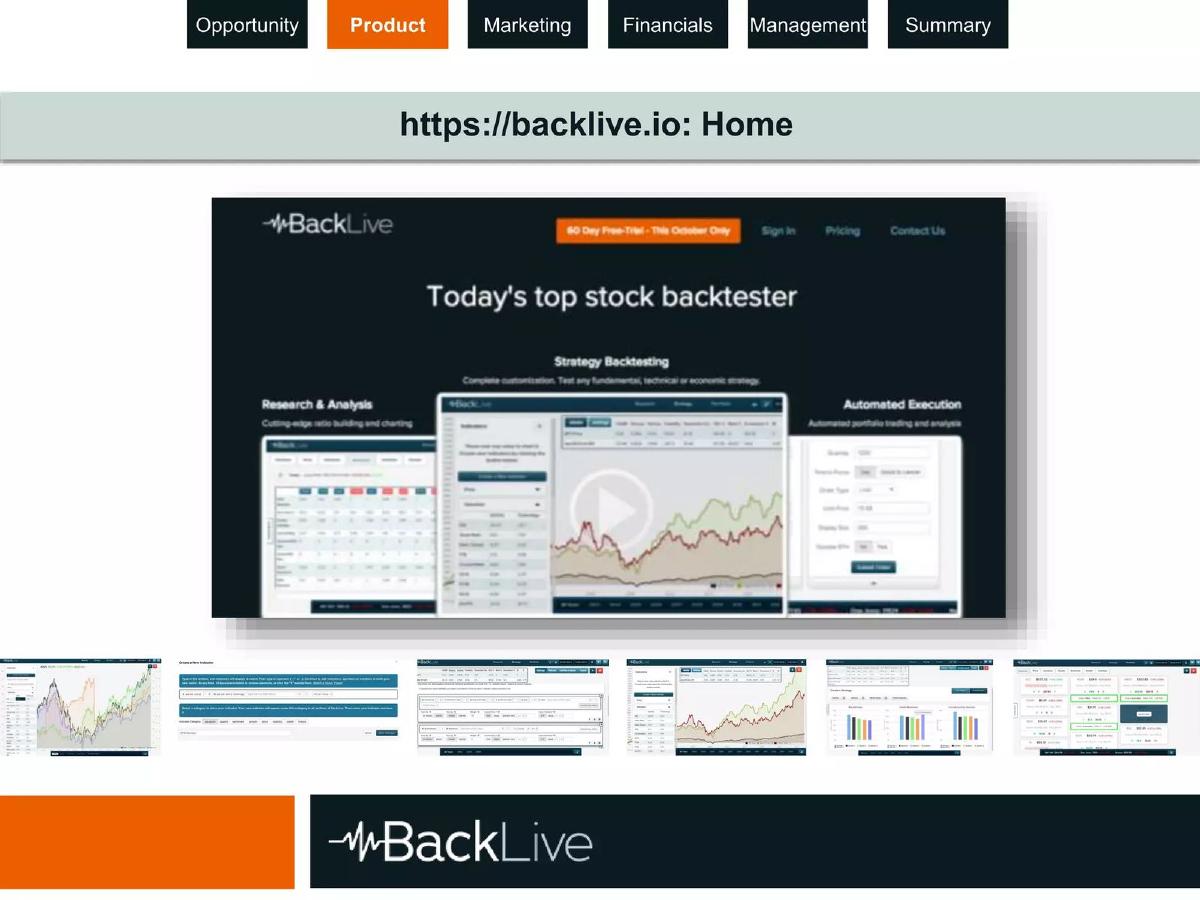
This slide provides a direct look at the platform interface via the URL backlive.io . The focus here is "Research - Fundamental Comparative Charting." The screenshot shows a detailed dashboard for Apple Inc. (AAPL), displaying indicators such as P/E, Quick Ratio, Debt/Equity, and P/B. Below the main chart, a series of thumbnails suggest a deep feature set including various views and data visualizations. This slide serves to prove the product's existence and its ability to handle complex fundamental data points alongside price action.
Slide 4: Strategy and Analytics
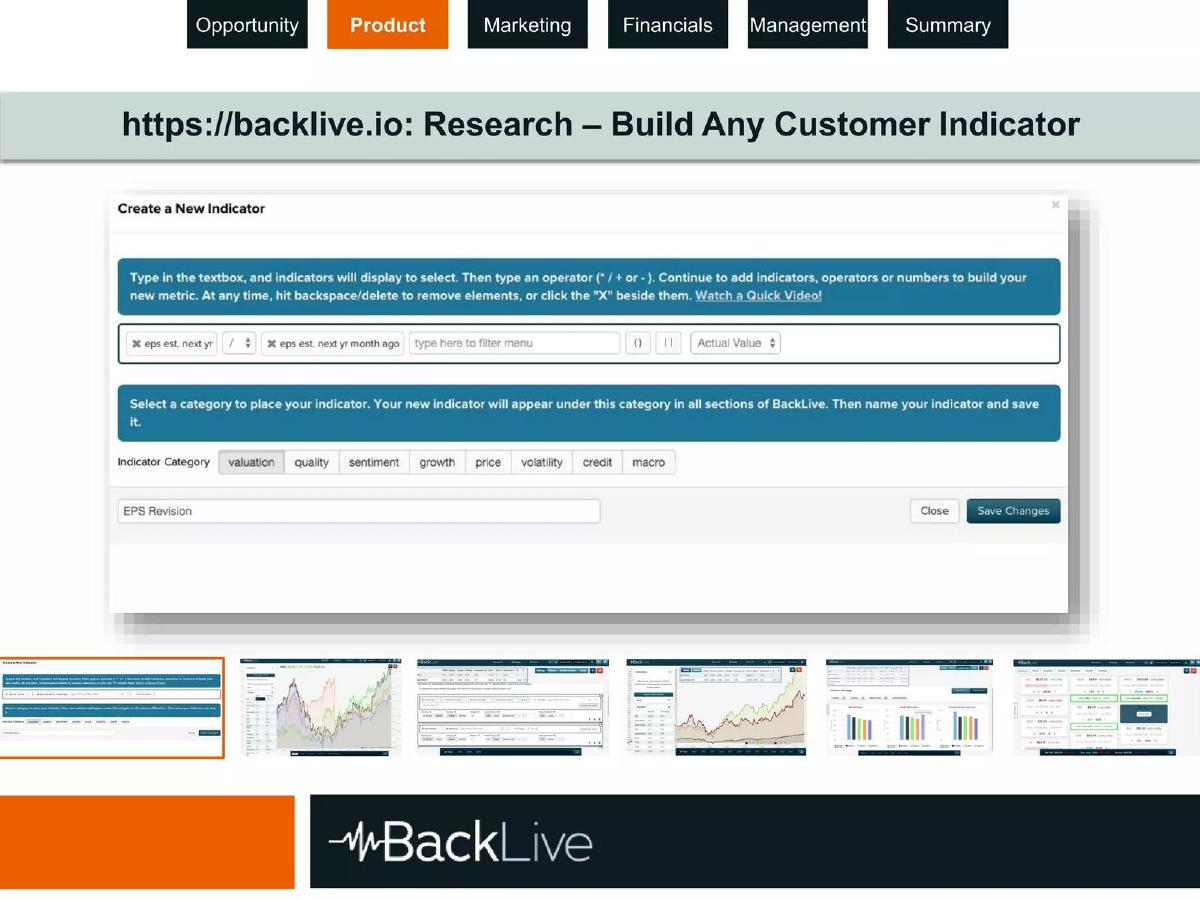
Continuing the product walkthrough, slide 4 focuses on "Strategy – Numerous Built-In Analytics." The interface shown allows users to "Create a Strategy" by selecting a universe, indicators, market timing, and portfolio selection. It features a backtesting engine, as evidenced by the "RUN BACKTEST" button. The visualizations include bar charts comparing different strategy iterations (e.g., "Blended Value," "Simple Momentum"). This slide targets the core value proposition: allowing users to validate their investment hypotheses with historical data.
Slide 5: Target Customer Profile
Slide 5 defines the target audience. The "BackLive Customer" is described as an avid investor, "primarily male," in their "20’s, 30’s, 40’s." The text notes that these individuals likely have finance degrees and substantial portfolios. However, the slide also identifies a "professional side" opportunity, citing "Thousands of funds and asset managers" who need agile systems. This dual-track approach—targeting both high-net-worth retail and small-to-mid-sized funds—is a common strategy for fintech platforms seeking to build a user base while chasing higher-value enterprise contracts.
Slide 6: Competitive Landscape
The "Limited Direct Competition" slide uses a matrix to compare BackLive against Portfolio123, Zack’s IRW, VectorVest, and Quantopian. BackLive claims a clean sweep of features, including:
Stock Backtesting · Macro-Economic Testing · Fundamental Testing · Custom Indicators · Trade Execution · Automated Trading · Intuitive Commercial Website
The pricing row is particularly notable, listing BackLive at "$20-200," which positions it as a more affordable alternative to Zack’s IRW ($150-250) and Portfolio123 ($99-199), while offering more features than the free Quantopian (which focused primarily on algorithmic trading).
Slide 7: Financial Projections
Slide 7 presents a detailed table of "Projected Fiscal Year" data from 2014 to 2019. The growth targets are extremely aggressive:
FY 2014: $14,695 Net Revenue · FY 2015: $361,792 Net Revenue (84.1% Gross Margin) · FY 2016: $4,116,854 Net Revenue (1,037.9% Growth Rate) · FY 2019: $23,903,831 Net Revenue (94.3% Gross Margin)
The table also projects a Net Income of $11,523,556 by FY 2019. These figures suggest a highly scalable software model with very low marginal costs, as COGS remains a small fraction of revenue throughout the projection period.
Slide 8: The Investment Ask
The final slide in this set details the funding request: "$300,000 in exchange for 20% preferred equity share." This implies a pre-money valuation of $1.2 million and a post-money valuation of $1.5 million. The use of funds is listed as product development, sales force, marketing, and salaries. The slide includes a "Return" calculation based on an 11X multiple of FY 2019 EBITDA, projecting a Total equity to be distributed of $99,013,149. For the investor, this is calculated as a 142% IRR and an 82.5x MoM.
What Works in the BackLive Deck
The deck excels at demonstrating product readiness. By including high-resolution screenshots of a functional platform and a live URL, the founders remove the "vaporware" risk often associated with early-stage fintech. The competitive matrix is also well-constructed, clearly identifying the feature gaps in the market that BackLive intends to fill. The pricing strategy is clearly defined, showing a tiered model that allows for low-friction entry for retail users while maintaining upside for professional accounts.
What is Missing from the BackLive Deck
The most glaring omission in the provided slides is the Team Slide. While the navigation bar mentions "Management," no details are provided about who is building this complex financial engine. In fintech, the pedigree of the founders (e.g., former hedge fund quants, experienced software architects) is often as important as the product itself. Additionally, there is a lack of Traction Metrics. While the projections are detailed, there is no mention of current active users, churn rates, or customer acquisition costs (CAC) for the $14,695 in revenue reported for FY 2014. Finally, the Regulatory/Compliance aspect is ignored; a platform offering trade execution and automated trading typically faces significant legal hurdles that investors would want to see addressed.
Founder Takeaways: Lessons from BackLive
Founders should emulate BackLive's clear product-market fit demonstration. The screenshots are not just pretty pictures; they show specific data points (P/E ratios, backtest results) that prove the platform understands its users' needs. However, founders should be cautious with overly aggressive financial projections. Forecasting a 1,000% revenue jump in a single year without explaining the specific marketing or sales catalyst can lead to skepticism during due diligence. When presenting an investment return (Slide 8), it is better to show a range of outcomes rather than a single, highly optimistic 82.5x multiple, which can appear unrealistic to seasoned investors.
Frequently asked questions
- What is the core product offering of BackLive?
- BackLive offers a software platform for financial strategy testing and execution. According to slides 3 and 4, the platform includes tools for fundamental comparative charting, research, and strategy building with built-in analytics. It aims to provide quantitative answers for investors who want to look past pricing trends into company fundamentals.
- Who are the primary competitors identified by BackLive?
- Slide 6 lists four main competitors: Portfolio123, Zack’s IRW, VectorVest, and Quantopian. BackLive differentiates itself by claiming to offer features that these competitors lack, such as macro-economic testing and a more intuitive commercial website, while maintaining a competitive price point of $20-$200.
- What are the financial requirements and terms of the investment?
- As stated on slide 8, BackLive is seeking a $300,000 investment. In exchange, the investor receives a 20% preferred equity share. The capital is intended for product development, sales force and marketing, and salaries.
- What is the projected growth trajectory for the company?
- The company projects aggressive growth on slide 7. Starting from a net revenue of $14,695 in FY 2014, it forecasts reaching $23,903,831 by FY 2019. This includes a projected 1,037.9% revenue growth rate between FY 2015 and FY 2016.
- Does the deck provide information about the founding team?
- No. The provided slides do not include a management or team slide. While the navigation bar at the top of several slides includes a 'Management' section, no specific details regarding the founders' backgrounds, experience, or names are present in the analyzed pages.