Selling as an Employee Benefit on a Pitch Deck: Show What
When employers buy and employees use, investors need proof from both sides. Three real decks show how to present an employee-benefit channel: employer price.
Selling as an Employee Benefit on a Pitch Deck: Show What Employers Pay and How Many Employees Use It
A growing number of consumer products reach people through their job: a sports pass, a salary advance, a benefits card, a coaching app. The employer signs the contract and often pays; the employee decides whether to use it. That split is attractive, because one sale brings in hundreds of users, and risky, because an employer can buy a benefit that almost nobody uses and then cancel it at renewal. This guide looks at three companies outside healthcare that sell this way, SportID, Rosaly and Ben, and at which numbers on their slides answer the investor's two questions: what does the employer pay, and do employees actually use it?
TL;DR
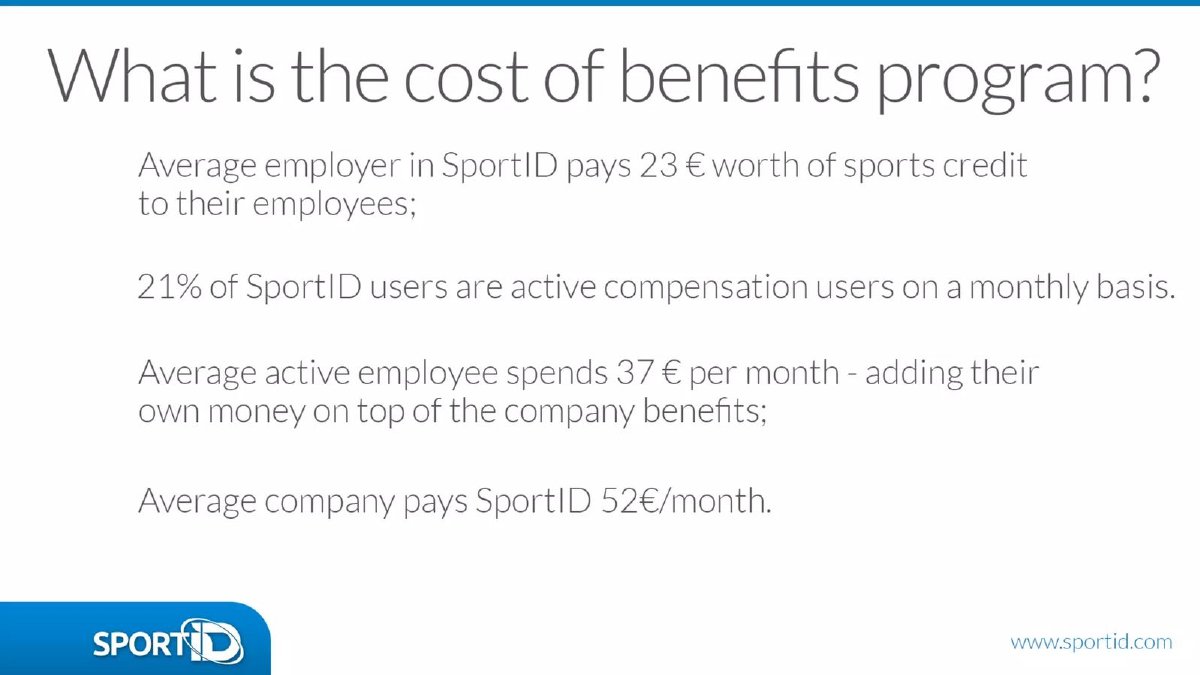
Put one employer number and one employee number side by side. The employer number is what an average company pays you per month or per employee. The employee number is the share of eligible staff who sign up and the share who use it each month. SportID's slide does this in four lines: 'Average company pays SportID 52€/month', '21% of SportID users are active compensation users on a monthly basis', and employees spend '37 € per month - adding their own money on top of the company benefits'. Rosaly gives sign-up and use: '70% of the employees have signed up, and >20% of them use our services each month'. Then say how many employers you have and how you reach them.
Three slides that present an employee-benefit channel
Each slide is read at full size. Quotes are exact.
SportID go to market slide — slide 14
Corporate sports and wellness benefit in the Baltics. Benefits cost slide (undated).
SportID deck, slide 14. Exact stored slide matched to this analysis.
Our analysis: The most complete two-sided slide in the set.
Evidence and limitation: Employer budget, employer fee, monthly use and employee top-up given; credit period, user base and revenue from spending not stated.
What a founder can adapt: State the period of each amount and the base of the percentage.
Supporting analysis
What the deck claims: "Average employer in SportID pays 23 € worth of sports credit to their employees"; "21% of SportID users are active compensation users on a monthly basis"; active employees spend "37 € per month - adding their own money"; "Average company pays SportID 52€/month".
Presentation choice: Shows employer price and employee spending together, including employees' own money.
When it does not fit: 'Users' without saying registered or eligible.
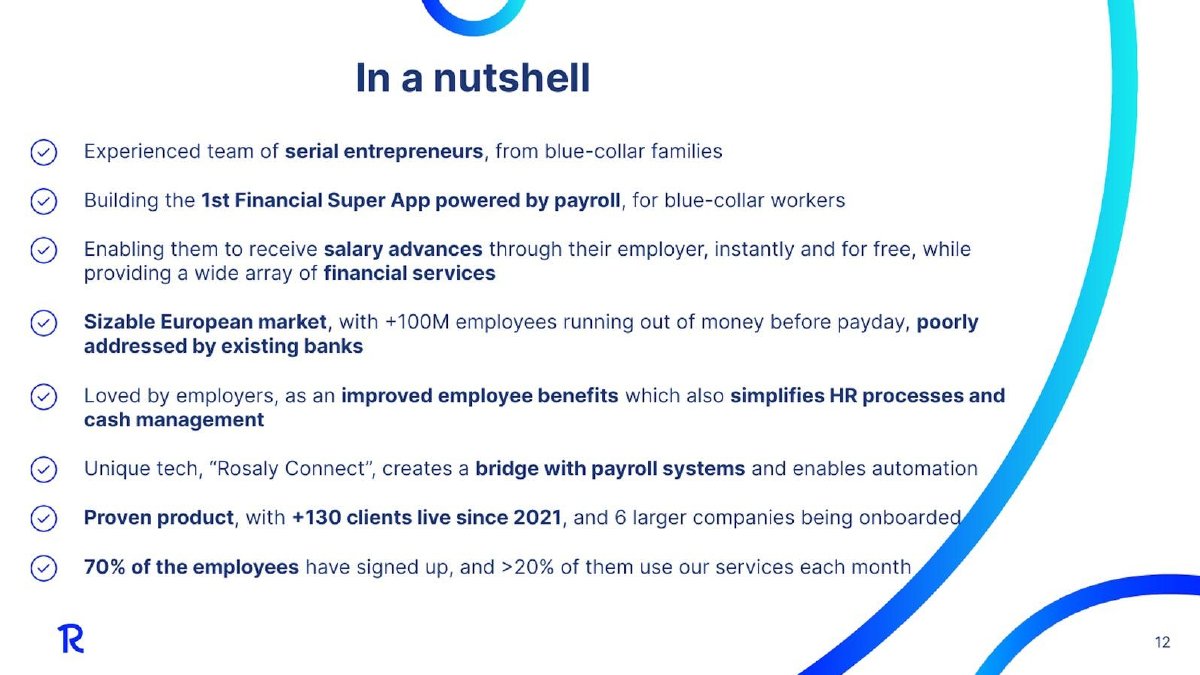
Salary advances and financial services for blue-collar workers through their employer. Summary slide (undated).
Rosaly deck, slide 12. Exact stored slide matched to this analysis.
Our analysis: A clean adoption funnel with the employer economics missing.
Evidence and limitation: Employer count and two-step sign-up and use funnel; no employer price, revenue model or renewal figure.
What a founder can adapt: Add what an average employer pays and how many renewed.
Supporting analysis
What the deck claims: "+130 clients live since 2021, and 6 larger companies being onboarded"; "70% of the employees have signed up, and >20% of them use our services each month"; payroll link 'Rosaly Connect'.
Presentation choice: Shows sign-up and monthly use in one sentence with the base clear.
When it does not fit: 'Loved by employers' with no supporting figure.
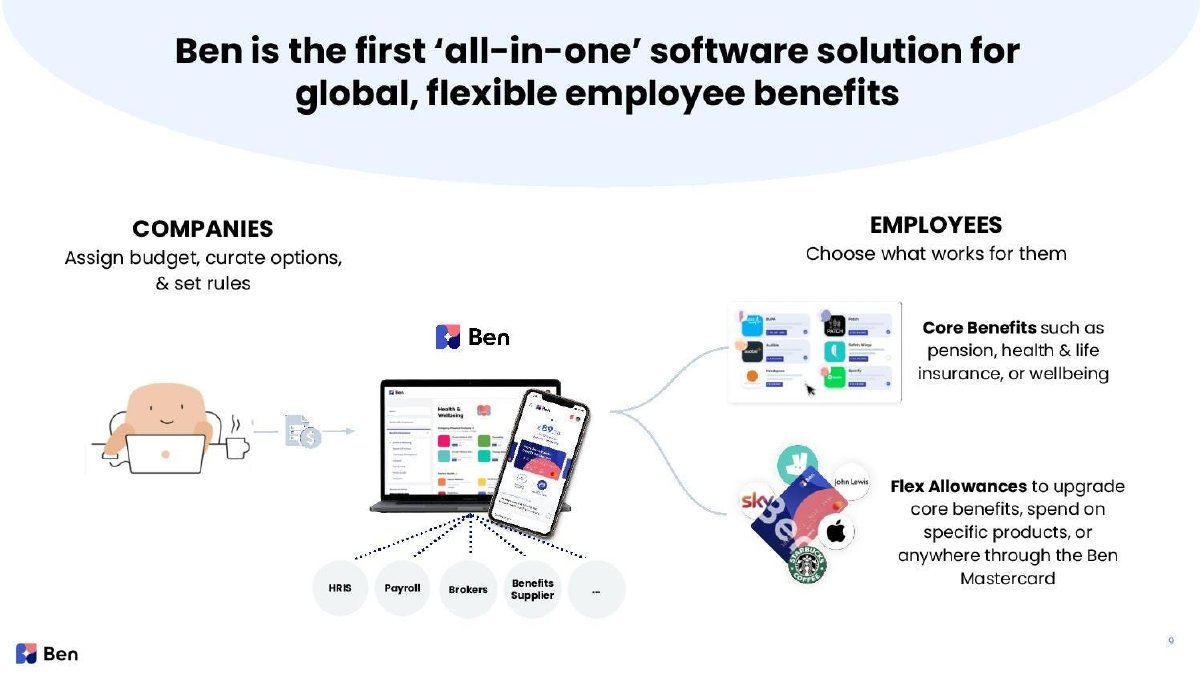
Employee benefits software and payment card. Product slide (undated).
Ben deck, slide 9. Exact stored slide matched to this analysis.
Our analysis: A clear two-sided structure without evidence.
Evidence and limitation: Two users and their jobs drawn apart; intermediaries named; no figures.
What a founder can adapt: Add one number to each side: companies live and share of staff active.
Supporting analysis
What the deck claims: 'COMPANIES: Assign budget, curate options, & set rules'; 'EMPLOYEES: Choose what works for them'; core benefits and flex allowances on the Ben Mastercard; connections to HRIS, Payroll, Brokers, Benefits Supplier.
Presentation choice: Shows that the product must win the employer and the employee.
When it does not fit: A structure slide standing in for traction.
Employer price, employer count, sign-up, active use and employee spending.
Example
Employer price
Employer count
Sign-up rate
Monthly use
Employee spending
SportID
52€/month per company
No
No
21% of users (base unclear)
37€/month, including own money
Rosaly
No
130+ live, 6 onboarding
70% of employees
More than 20% of those signed up
No
Ben
No
No
No
No
Card spending shown, no figure
Key Takeaways
Show the employer side: what an average company pays you.
Show the employee side: sign-up rate and monthly use.
State the base for each percentage: eligible staff, or signed-up users.
If employees add their own money, show it; it is a strong usage signal.
Give the employer count and how employers are reached.
Say what the employer gains, in their own terms.
Prepare your employee-benefit slide
Answer these before writing the slide.
Employer price. What does an average employer pay, per month or per employee?
Employers. How many are live, onboarding and renewed?
Sign-up. What share of eligible employees register?
Use. What share use it in a month, and of which base?
Own money. Do employees spend beyond the employer's budget? How much?
Route. Do employers come direct or through brokers, payroll or benefit platforms?
Copyable framework: "[n] employers pay [amount]/[period]; [x]% of eligible staff signed up, [y]% of them active monthly."
Illustrative example 1 — written by us
Before: "21% of SportID users are active compensation users on a monthly basis."
After: "21% of [registered / eligible] employees use their sports credit each month."
What improved: Our illustrative rewrite of SportID's line. The bracketed base is not stated on the slide.
The question this guide answers
This guide answers one founder question: our product is used by employees but bought by their employer as a benefit. What should the deck show so investors believe the channel works?
Our healthcare go-to-market guide covers health products where employers and insurers pay, and focuses on naming the payer and their cost saving. Our channel partners draft covers resellers and distributors who sell your product on your behalf. Neither answers what evidence proves an employee-benefit channel outside healthcare: which employer numbers and which employee numbers to show, and how to stop a reader confusing contracts signed with people using the product. That is this guide's subject.
How we chose and read the examples
We searched extracted text across the library for 'employee benefit', 'through employers' and similar phrases, and kept slides where a private company described employers as the way it reaches its users. Many matches came from health products, which our healthcare guide already covers, or from listed companies' financial statements mentioning employee benefit costs; we set those aside. We also set aside HealthCaters' B2B2C slide, which our healthcare guide already uses for the same point.
We kept three slides with distinct approaches: SportID's 'What is the cost of benefits program?' slide (employer price, employer budget, employee use and employee top-up), Rosaly's 'In a nutshell' summary slide (employer count, sign-up rate and monthly use) and Ben's product slide (the two sides drawn as separate users with separate jobs). None of the three slides shows a date. Each was rendered from the source deck and read at full size. Any calculations are ours. We did not check any claim against outside sources.
Why investors probe this channel
It changes who you have to convince. The employer is the customer on the invoice, but the employer only renews if staff use the benefit. A deck that shows only employer logos proves the first sale, not the second.
It hides low use easily. A company with 500 staff that buys a benefit can be reported as 500 users, even if 30 people ever open it. Investors have seen that trick, so they look for the share of eligible employees who sign up and the share who use it regularly.
It shapes the economics. Revenue usually comes per employer or per employee per month, sometimes with a share of what employees spend. Each model rewards a different kind of usage, and the slide should say which applies.
It decides the sales motion. Benefits are bought by HR or finance, often through brokers, payroll providers or benefits platforms. Investors want to know whether you sell to each employer directly or through someone who already reaches many of them.
Both sides with numbers: SportID
SportID, a corporate sports and wellness benefit company in the Baltics, has a slide headed 'What is the cost of benefits program?'. It has four lines: 'Average employer in SportID pays 23 € worth of sports credit to their employees;', '21% of SportID users are active compensation users on a monthly basis.', 'Average active employee spends 37 € per month - adding their own money on top of the company benefits;' and 'Average company pays SportID 52€/month.'
This is the most complete example in the set because it separates three flows of money. The employer funds a benefit budget for staff (23 euros of sports credit). The employer pays SportID a fee (52 euros a month). And active employees spend more than the credit they receive (37 euros a month), which means they add their own money. That last figure is the strongest usage signal on the slide: people who top up a benefit with their own cash value it. The 21% monthly figure tells the reader that only about one in five users draw on the benefit in a given month.
Some bases are unclear. The 23 euros has no period, so a reader can't tell whether it is per month, per year or per employee. '21% of SportID users' doesn't say whether 'users' means every eligible employee or only those who registered, which changes the meaning a lot. And the 52 euros a month per company is a small fee next to the sums employees spend, so the slide implies SportID also earns from spending, but it doesn't say how. Stating the period, the base and the revenue source would make the four lines into a complete model.
Sign-up and use from employer clients: Rosaly
Rosaly, a French company offering salary advances and financial services to blue-collar workers through their employer, has a summary slide headed 'In a nutshell'. Among its bullets: 'Enabling them to receive salary advances through their employer, instantly and for free, while providing a wide array of financial services', 'Loved by employers, as an improved employee benefits which also simplifies HR processes and cash management', 'Unique tech, "Rosaly Connect", creates a bridge with payroll systems and enables automation', 'Proven product, with +130 clients live since 2021, and 6 larger companies being onboarded' and '70% of the employees have signed up, and >20% of them use our services each month'.
The last bullet is the two-step funnel investors want: of eligible employees, 70% sign up; of those, more than 20% use the service in a month. By our arithmetic that is roughly one in seven eligible employees using it monthly. Putting both percentages in one sentence, with the second clearly a share of the first, avoids the common confusion between sign-up and use. The employer count ('+130 clients live since 2021') and pipeline ('6 larger companies being onboarded') give the employer side, and the payroll link explains why employers can switch it on with little effort.
What's missing is the employer price and the revenue model. The salary advance is described as 'free' for employees, so a reader needs to know whether employers pay, financial services earn the money, or both. The slide says employers love it but gives no renewal or churn figure for them. One more line, such as what an average employer pays and how many have renewed, would complete the picture. Because this is a summary slide, the deck may answer these elsewhere; we judge only what this slide shows.
Two users, two jobs: Ben
Ben, a European employee benefits software company, has a product slide headed "Ben is the first 'all-in-one' software solution for global, flexible employee benefits". The left side, 'COMPANIES', reads 'Assign budget, curate options, & set rules'. The right side, 'EMPLOYEES', reads 'Choose what works for them', with two branches: 'Core Benefits such as pension, health & life insurance, or wellbeing' and 'Flex Allowances to upgrade core benefits, spend on specific products, or anywhere through the Ben Mastercard'. Below the product image are connection points labelled HRIS, Payroll, Brokers and Benefits Supplier.
The useful part is the structure. Ben draws the employer and the employee as different users with different jobs: one sets budgets and rules, the other chooses and spends. That makes it obvious that the product has to win twice, and it tells the reader where revenue can come from: software sold to companies and payments made on a card. The connection row shows the systems and intermediaries the product sits beside, which hints at the channels that can bring in employers, such as brokers and payroll providers.
It is a product slide, not evidence. It shows no employer count, no employee sign-up and no spending figure. A founder copying it should keep the two-sided layout and attach one number to each side: companies live, and the share of their employees who use the benefit.
What to put on an employee-benefit slide
Employer price. What an average company pays you, per month or per employee, and what it buys.
Employer count and source. How many employers are live, how many are in onboarding, and whether they came from direct sales, brokers, payroll providers or benefits platforms.
Sign-up rate. Share of eligible employees who register, with 'eligible' defined.
Active use. Share of registered or eligible employees who use it in a month, with the base stated.
Employee money. If employees add their own spending, show it; it proves value better than any survey.
Employer gain. Why HR or finance buys it, in their terms: cost, retention, administration time. Give a figure only if you measured it.
Renewal. Share of employers who renewed, once you have a renewal cycle.
Common traps
Counting every eligible employee as a user. Report eligible, registered and active separately.
A percentage with no base. '21% of users' can mean 21% of everyone or 21% of the keen minority who registered.
Employer logos with no usage. Logos prove contracts, not adoption.
No revenue model. If the benefit is free to employees, say who pays.
Employer benefits stated as fact. 'Loved by employers' needs renewals or a quote to support it.
Where this belongs in the deck
The channel itself goes on the go-to-market slide: who buys, through which route, at what price. The sign-up and use figures go on the traction slide beside the employer count, as Rosaly does in its summary. If you show both on one slide, as SportID does, keep employer and employee numbers visibly apart.
A template you can adapt
Headline: '[n] employers, [x]% of their staff signed up, [y]% of those active monthly.'
Employer side: 'Average employer pays [amount] per [month / employee]; [z]% renewed.'
Employee side: 'Active employees spend [amount] a month, including [amount] of their own money.'
These three slides show how founders presented an employee-benefit channel. They can't show whether the figures held up, whether employers renewed, or whether the businesses succeeded. We did not check any figure against outside sources.
Treat them as patterns. SportID shows money from both sides but leaves bases unclear. Rosaly gives a clean sign-up and use funnel but no employer price. Ben draws the two-sided structure with no numbers. Combine the three and you have a complete slide.
Common mistakes
Eligible counted as users. Every employee at a client reported as a user.
Percentage without a base. Use rates with no statement of registered or eligible.
Logos only. Employer names with no employee adoption.
Unclear payer. A benefit free to employees with no word on who pays.
Unsupported employer love. Employer satisfaction claimed without renewals or quotes.
Diagnostic checklist
Employer price stated.
Employer count and route stated.
Sign-up rate with base.
Monthly use with base.
Employee spending, if any.
Frequently asked questions
Is a low monthly use rate a problem?
Not always. Some benefits, such as salary advances, are needed only occasionally. Say what normal use looks like for your product and show whether employers renew.
Should I count employees or employers as customers?
Employers are the customers on your invoice; employees are users. Report both, separately, and never add them together.
How we chose these examples
Corpus: published pitch deck teardowns on StartupFundraising.com. Founder-uploaded private decks are excluded.
Selection (2026-10-01): we searched extracted text for employee benefit and employer-channel phrases; set aside health products (covered by the healthcare guide), listed-company financial statements and HealthCaters' slide (already used); kept three private-company slides with distinct approaches.
Review: the three slides were rendered from the source decks on 2026-10-01 and read in full at full size against company, deck and page number (editorial model review, with AI assistance in drafting; not human-reviewed). No claim was checked against outside sources.