How to Show Hardware Reliability in a Pitch Deck: Field
Two real robotics and climate-hardware slides show how to present field exposure, measured uptime and usage volume without turning unlike evidence.
How to Show Hardware Field Reliability in a Pitch Deck
A prototype working once is not the same as hardware working repeatedly in customers' operations. Investors need to know how much real-world exposure the product has had, what happened during that exposure and why the result matters to customers. This guide answers one founder question: how do you present field reliability without making the evidence say more than it does? Mojave reports operating hours and uptime from field-test units. Chef Robotics reports a large usage total and calls its performance high-uptime. Read together, the slides show the difference between exposure, a quantified result and an unquantified claim. The distinction matters before any scale claim is made.
TL;DR
Present hardware field reliability as an evidence chain: define the tested population, state the exposure in a unit that fits the product, report a measured outcome with its denominator and method, explain what counted as an interruption or failure, and connect the result to a customer consequence. Mojave says field-test units had accumulated more than 6,000 operating hours with 95% uptime. The slide does not say how many units contributed, whether 6,000 hours is a fleet total, how uptime was calculated, what counted as up or down, or whether both figures share the same denominator. Chef Robotics says its robots made more than 44 million servings in commercial settings and describes their performance as high uptime. Servings demonstrate usage volume, but the slide gives no uptime percentage, period, unit count, intervention rate or failure definition. Neither slide supports a cross-company ranking. A founder should show exposure and measured reliability separately, then make their relationship explicit only when the underlying records justify it.
Two hardware slides, read by evidence type
Both pages were read at full size from their original deck PDFs. The examples separate what the slide reports from what remains unknown; no company ranking is made.
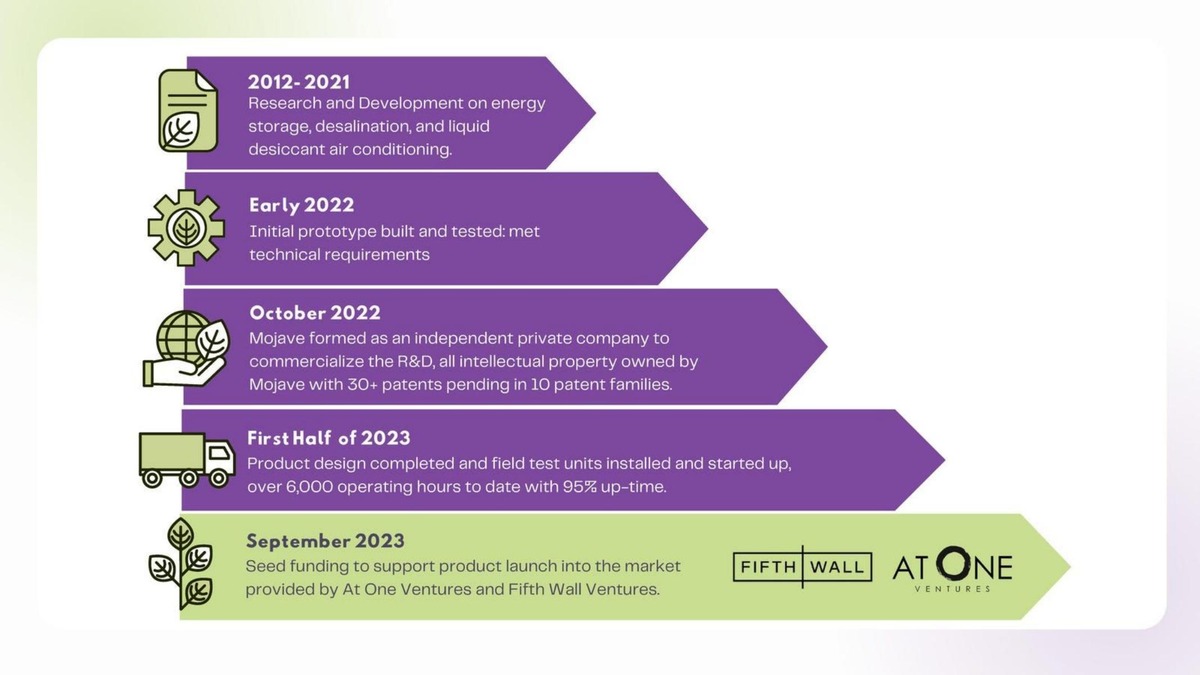
Mojave product slide — slide 6
Liquid-desiccant air conditioning. Timeline page; first-half 2023 field-test milestone.
Mojave deck, slide 6. Exact stored slide matched to this analysis.
Our analysis: A quantified field result whose scope and calculation cannot be reconstructed from the slide.
Evidence and limitation: Company-reported exposure and uptime. Unit count, dates, fleet-versus-unit basis, denominator, method and downtime definition are not stated.
What a founder can adapt: Add units, sites, dates, fleet-total basis, uptime formula and event definition.
Supporting analysis
What the deck claims: 'Field test units installed and started up, over 6,000 operating hours to date with 95% up-time.'
Presentation choice: Shows why exposure and uptime need a shared, stated basis.
When it does not fit: Do not infer downtime hours unless both figures demonstrably share a denominator.
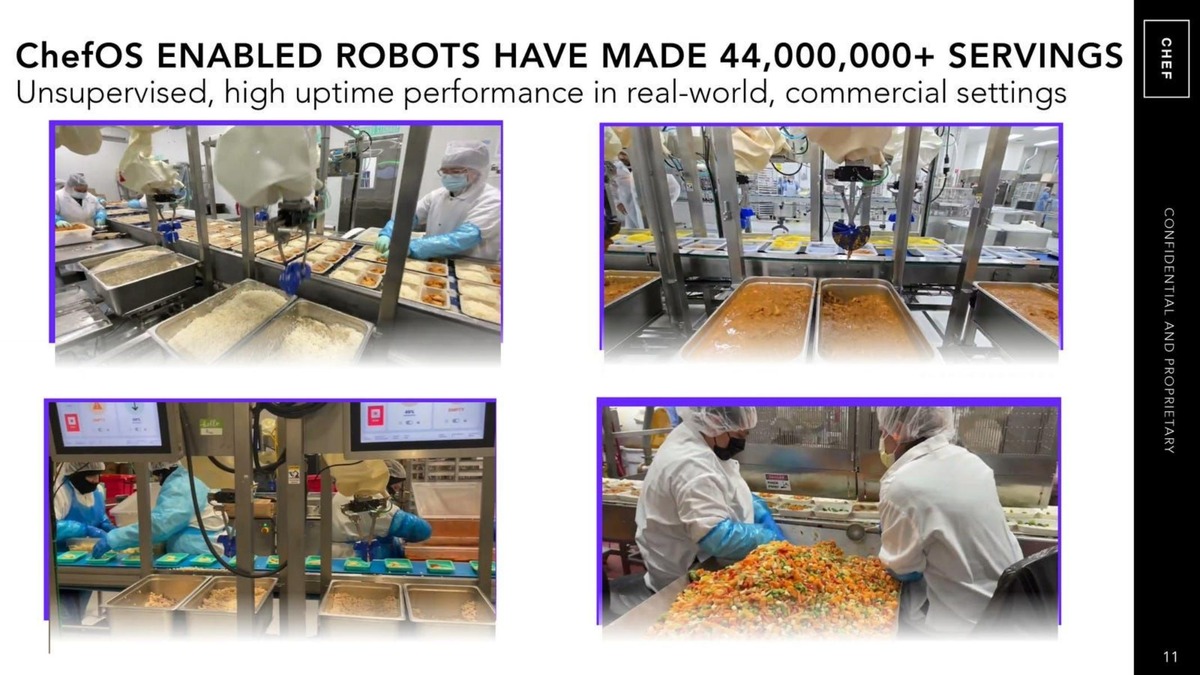
Food-assembly robotics. Commercial-use page with four photographs of deployed production lines.
Chef Robotics deck, slide 11. Exact stored slide matched to this analysis.
Our analysis: Strong evidence of exposure; an unquantified reliability claim.
Evidence and limitation: Company-reported usage volume. No robot count, period, uptime value, intervention rate, failure definition or measurement method is stated.
What a founder can adapt: Keep servings as exposure, then add robot-hours and measured interruptions per stated denominator.
Supporting analysis
What the deck claims: 'ChefOS enabled robots have made 44,000,000+ servings'; 'Unsupervised, high uptime performance in real-world, commercial settings.'
Presentation choice: Shows that a large output count is not a failure rate.
When it does not fit: Do not translate servings or 'high uptime' into an invented reliability percentage.
The rows describe the evidence present on each page, not relative company performance.
Example
Exposure
Measured reliability
Scope and method
What remains unknown
Mojave p6
>6,000 operating hours
95% uptime
Not stated
Units, dates, denominator, events, monitoring
Chef Robotics p11
>44m servings
No; 'high uptime' claim
Commercial settings; method not stated
Robots, dates, uptime, interventions, failures
Key Takeaways
Operating hours measure exposure; they do not by themselves measure reliability.
State whether hours are a fleet total, per unit or elapsed calendar time.
Give uptime's period, population, denominator, method and definition of downtime.
Do not derive downtime hours unless operating hours and uptime demonstrably use the same denominator.
Usage volume such as servings shows work performed, not a failure rate.
Label phrases such as 'high uptime' as company claims when no number or method is supplied.
Explain why the measure matters to customers: lost production, service calls, labour or revenue.
Build a field-reliability evidence line
Use records from the same defined population and period. Keep unknowns visible.
Population. Which product version, how many units and how many sites are included?
Period. What exact start and end dates do the records cover?
Exposure. Are the hours, cycles or outputs fleet totals, per-unit values or elapsed time?
Events. What counts as a failure, unplanned stop or human intervention?
Result. What measured rate follows from those events and that denominator?
Method. Which logs or monitor produced the result, and how is planned maintenance treated?
Customer relevance. What customer cost, labour or production outcome does reliability protect?
Limits. Which conditions, sites or versions are not represented?
Copyable framework: Measured [dates]: [number] [version] units at [sites] accumulated [fleet-total exposure]. We recorded [events] under [definition], equal to [rate] using [denominator/method]. Planned maintenance [treatment]. Customer relevance: [effect]. Limitation: [boundary].
Illustrative example 1 — written by us
Before: Over 6,000 operating hours to date with 95% uptime.
After: Measured [start]–[end]: [N] [version] field-test units at [N] sites accumulated 6,000+ fleet operating hours. Availability was 95% of [defined scheduled hours], from [monitor]; planned maintenance [included/excluded]. Limitation: [conditions not represented].
What improved: Our illustrative rewrite of Mojave p6. Every bracketed item is missing from the slide and must be replaced with verified company records.
The question this guide answers
Hardware founders often move from a lab demonstration to pilots and then to commercial deployments. At each step, the question changes. First an investor asks whether the product works at all. Later the investor asks whether it keeps working under real operating conditions, across enough units and enough time to support a business.
This guide is about that later question: what evidence belongs on a pitch-deck slide when a founder wants to show that physical equipment performs reliably in the field? It is distinct from the hardware milestones guide, which maps prototype, certification and production stages to a raise. It is also distinct from the software uptime guide, which separates measured service availability from contractual SLAs. Physical hardware can require human interventions, component replacements and maintenance while continuing to deliver output; its evidence needs a population, exposure and event definition, not just a service percentage.
The practical outcome is a slide whose result can be traced back to operating records and interpreted in the customer's setting.
Demand note: the site's recent search data showed no query specifically about hardware reliability in a pitch deck. The topic is therefore an editorial hypothesis based on a recurring diligence question for deployed hardware, not a claim of measured search demand. No search-volume estimate is made.
Three layers of evidence: exposure, events and customer effect
Start with exposure. Operating hours, cycles, miles, units processed or servings produced tell a reader how much work the equipment has attempted. Exposure matters because a result after one hour says less than the same result after thousands of hours. But exposure is not the outcome. Six thousand operating hours can include frequent interventions; 44 million servings can come from many machines with unknown service needs.
Next report the events observed during that exposure. Depending on the product, this could be unplanned stops, failures, service calls, human interventions, parts replaced or time unavailable. Define the event. A robot paused for scheduled cleaning is different from a motor failure; a human topping up ingredients may be normal operation rather than an intervention caused by a fault. Give both the count and the basis: for example, interventions per 1,000 operating hours across a stated number of deployed units during stated dates.
Then connect the result to a customer effect. Reliability matters because a stopped machine can halt production, require labour, waste material, delay service or lose revenue. Choose the customer consequence that the product is meant to improve and report it separately. Do not silently turn customer downtime saved into the startup's own uptime, or usage volume into a failure rate.
Mojave: measured-looking evidence with an undefined basis
Mojave develops liquid-desiccant air-conditioning equipment. Page 6 is a timeline. Under 'First Half of 2023' it says: 'Product design completed and field test units installed and started up, over 6,000 operating hours to date with 95% up-time.' This is stronger than saying only that units were tested. It gives a volume of exposure, places the work in field-test units and adds a quantified result.
The slide does not provide the basis needed to reproduce either number. It does not say how many field-test units contributed to the 6,000 hours, whether that figure is the sum across a fleet, elapsed calendar time since installation or another measure. It does not give the dates covered beyond the broad timeline, the monitoring source, the uptime formula, or what conditions counted as downtime. The hyphenated 'up-time' is quoted as printed; no technical definition appears on the page.
The two figures should therefore remain separate in the analysis. It would be tempting to take 5% of 6,000 hours and infer 300 downtime hours. The slide does not establish that the uptime percentage uses those operating hours as its denominator. Uptime may instead use scheduled service hours, calendar hours or another period. Without a shared denominator, the multiplication is not justified and is not made here.
A stronger version of Mojave's line would retain the exposure and percentage but add the missing basis: number and version of units; installation sites or operating conditions; exact start and end dates; whether hours are fleet-total; the definition of available time; planned-maintenance treatment; and the source of the records. It should also say why 95% is acceptable for the customer's cooling operation and what improved after any stoppages.
Chef Robotics: usage volume plus an unquantified claim
Chef Robotics' page 11 is headed 'ChefOS enabled robots have made 44,000,000+ servings'. Below it, the slide says: 'Unsupervised, high uptime performance in real-world, commercial settings.' Four photographs show robots operating on food-production lines. The page makes the commercial setting visible and reports a large amount of work performed.
The servings total is useful exposure evidence. It indicates the system has done far more than a short laboratory demonstration. But servings are units of output, not time, failures or availability. A machine can make many servings and still need frequent human intervention; many machines can produce the total over an unknown period; and a serving count does not reveal how often a robot was unavailable. The page does not state how many robots produced the total, over which dates, how a serving is counted, or whether repeated or rejected servings are included.
'High uptime' is an unquantified company claim on this slide. There is no percentage, denominator, period, event count or method beside it. 'Unsupervised' is also not defined: the photographs include people working around the lines, but the images do not establish whether those people operate the robots, handle food, clean equipment or perform another normal task. The page therefore cannot support a measured intervention rate from what is shown.
Chef's page would become reliability evidence if it kept the servings figure and added a separate measured line such as robot-hours, units deployed, interventions per thousand robot-hours, unplanned stops and time to restore service, all over dated periods with definitions. The number should describe the records the company actually has; this guide does not supply or estimate one.
Why the two slides should not be ranked
Mojave reports hours and a percentage. Chef reports servings and an adjective. Those measures have different units, populations, products and operating environments. A percentage is not automatically stronger because it looks more precise, and a larger usage number is not automatically stronger because it is larger. The useful comparison is structural: which parts of a reliability claim each slide supplies and which it leaves unknown.
Mojave supplies quantified exposure and a quantified result, but leaves their scope and relationship undefined. Chef supplies quantified output in commercial settings, but leaves reliability unquantified. Neither page states a failure definition, intervention count, unit population, monitoring method or dated measurement window. Those gaps tell founders what to add; they do not establish which company had more reliable equipment.
A practical structure for your reliability slide
Use one headline for the measured conclusion, then a compact evidence line. First name the population: product version, number of units and number of sites. Second state the exposure: fleet-total operating hours or cycles between exact dates. Third give the outcome: uptime, unplanned stops, interventions or failures, with the formula and treatment of planned maintenance. Fourth show the distribution where possible, because an average can hide one troubled unit. Fifth add the customer consequence: production maintained, labour avoided or service restored.
Put limitations on the page rather than waiting for diligence. If the test covers two prototypes at one site, say so. If the result is internally monitored, say so. If operating conditions were narrower than customers will use, name them. A candid boundary makes a measured result more credible; it also tells the investor what the next funded test will prove.
Where reliability is still a target, label it as a target and show the test plan. Do not style a target like a measured result. Where the only evidence is usage volume, present it as exposure and add the reliability measure you will start recording. A slide can be useful before the data is mature as long as it keeps observed results, company claims and future targets visibly separate.
Common mistakes
Exposure presented as reliability. Hours, cycles and servings show use, not failures or availability.
Fleet basis omitted. Say whether exposure is summed across units, per unit or elapsed time.
Undefined uptime. Give the denominator, period, scope, event definition and method.
Downtime inferred. Do not multiply hours by the unavailable share unless both use the same denominator.
Claim treated as measurement. Label 'high uptime' as a claim when no quantified record is shown.
Unlike measures ranked. Do not compare servings, operating hours and uptime as one reliability scale.
Customer relevance missing. Explain what an interruption costs or prevents for the customer.
Diagnostic checklist
Product version, unit count and sites stated.
Measurement dates stated.
Exposure labelled fleet total, per unit or elapsed time.
Failure, stop or intervention defined.
Rate denominator and monitoring method stated.
Planned maintenance treatment stated.
Observed results, claims and targets visibly separated.
No downtime inferred from unmatched figures.
Customer consequence explained.
Test limitations stated on the slide.
Frequently asked questions
Do operating hours prove hardware reliability?
No. They show exposure. Pair them with defined failures, stops or interventions over the same population and period.
Can I calculate downtime from operating hours and uptime?
Only when the slide or source records establish that both figures use the same denominator. Mojave's page does not establish that, so this guide does not infer downtime hours.
Are units produced or servings delivered a reliability metric?
They are usage-volume metrics. They become part of reliability evidence when paired with unit count, time and defined interruption or failure records.
What if I only have pilot data?
Use it, but state the unit count, sites, dates and operating conditions. Name what the pilot does not represent and what the next test will cover.
Should reliability have its own slide?
Only when field performance is central to customer value or investment risk. Otherwise, place one evidence line on the product, traction or customer-results page.
How we chose these examples
Corpus: published pitch deck teardowns on StartupFundraising.com. Founder-uploaded private decks and listed-company presentations are excluded.
Question qualification (2026-10-03): the closest guides were read before drafting. The hardware-milestones guide covers stage and production readiness; the software-uptime guide covers service availability and SLAs and explicitly excludes hardware. Neither teaches how to state a physical product's field exposure, event rate and customer relevance.
Selection: Mojave p6 was kept as measured-looking field evidence because it reports operating hours and uptime; Chef Robotics p11 was kept as a contrast because it reports commercial usage volume and an unquantified high-uptime claim. Chef's servings are not treated as a failure rate. The examples are not ranked.
Review: both original deck PDFs were rendered at 200 dpi and the pages read at full size on 2026-10-03 (editorial model review, with AI assistance; not human-reviewed). Claims are reported as the companies present them and were not checked against equipment logs. No downtime hours are inferred. Existing eligibility and removal-request checks from the saved 2026-10-02 qualification were reused because their inputs were unchanged; no matching removal record was found then.
Demand: the saved search check found no relevant site query, so demand remains an editorial hypothesis. No search volume is estimated.