Org Chart in a Pitch Deck: When to Show One and What It
Should your pitch deck include an org chart? Four real slides show when a chart helps, how to keep headcounts consistent, how to mark open roles.
Org Chart Slide: Show Who Leads Each Area, Mark What Is Open, and Make the Counts Add Up
Some founders replace or follow the team slide with an org chart: boxes for each role and lines showing who reports to whom. Done well, it shows an investor that every important area has an owner and where the gaps are. Done badly, it fills a slide with job titles and no information, or makes the company look bigger than its numbers say. This guide uses four real slides to show when an org chart earns its place and what it has to show.
TL;DR
Use an org chart only when the structure says something the team slide cannot: who owns each area, how many people sit under each leader, and which roles are still open. Make the headline counts match the boxes, mark open roles clearly, and keep it to leaders plus team sizes. For a small team, a link to a detailed chart, as micro1 uses beneath "18 incredible people", is often enough.
Four org chart slides, read in full
Each slide was rendered from the original deck at full size and read in full. Box counts on the SARC MedIQ chart are our own; we did not check staff numbers against outside sources.
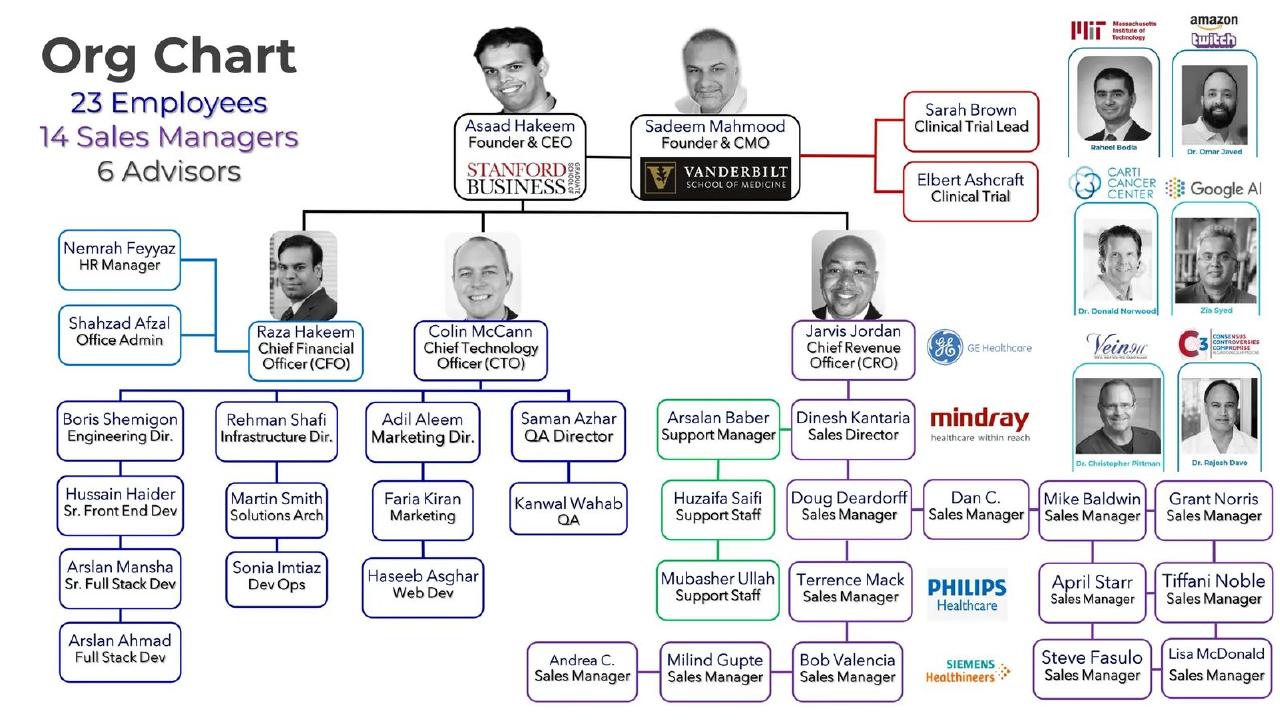
SARC MedIQ team slide — slide 22
Health technology company. Org chart slide.
SARC MedIQ deck, slide 22. Exact stored slide matched to this analysis.
Our analysis: The most informative chart, with counts that need explaining.
Evidence and limitation: Named leader for every area; we count 37 named people and 12 sales manager boxes.
What a founder can adapt: State how sales managers are employed and label what the logos mean.
Supporting analysis
What the deck claims: "Org Chart"; "23 Employees", "14 Sales Managers", "6 Advisors"; founders, CFO, CTO and CRO with named reports; unexplained GE Healthcare, Mindray, Philips Healthcare and Siemens Healthineers logos beside sales.
Presentation choice: Shows the depth of each area, and how unexplained counts invite questions.
When it does not fit: Headline counts that do not match the boxes.
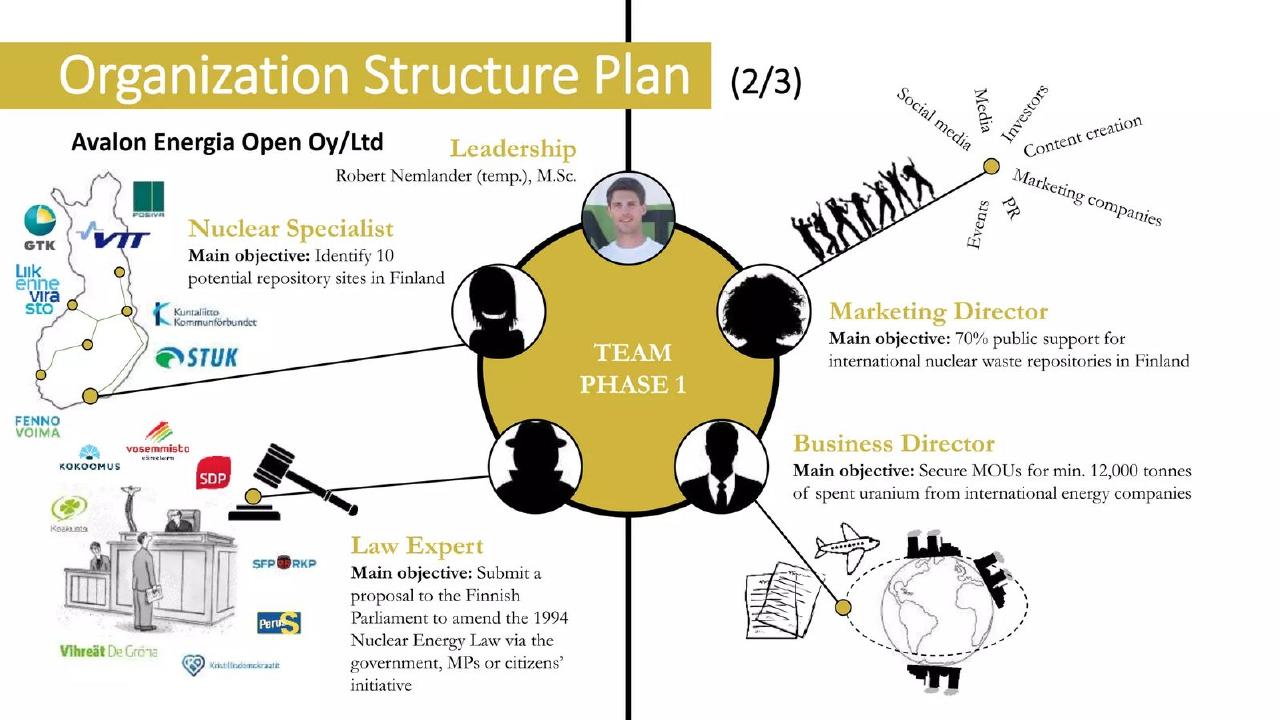
Nuclear waste repository venture in Finland. Organization structure plan slide.
Avalon Energia deck, slide 48. Exact stored slide matched to this analysis.
Our analysis: Honest about what is empty, but the chart cannot carry the pitch.
Evidence and limitation: One temporary leader; four open roles each with a measurable objective.
What a founder can adapt: Title it as roles to hire, and pair it with a founder and hiring plan story.
Supporting analysis
What the deck claims: "Organization Structure Plan (2/3)"; "Leadership: Robert Nemlander (temp.), M.Sc."; four silhouetted roles with objectives, such as "Secure MOUs for min. 12,000 tonnes of spent uranium".
Presentation choice: Shows how to mark open roles and give each one a purpose.
When it does not fit: Calling a hiring wish list an organisation structure.
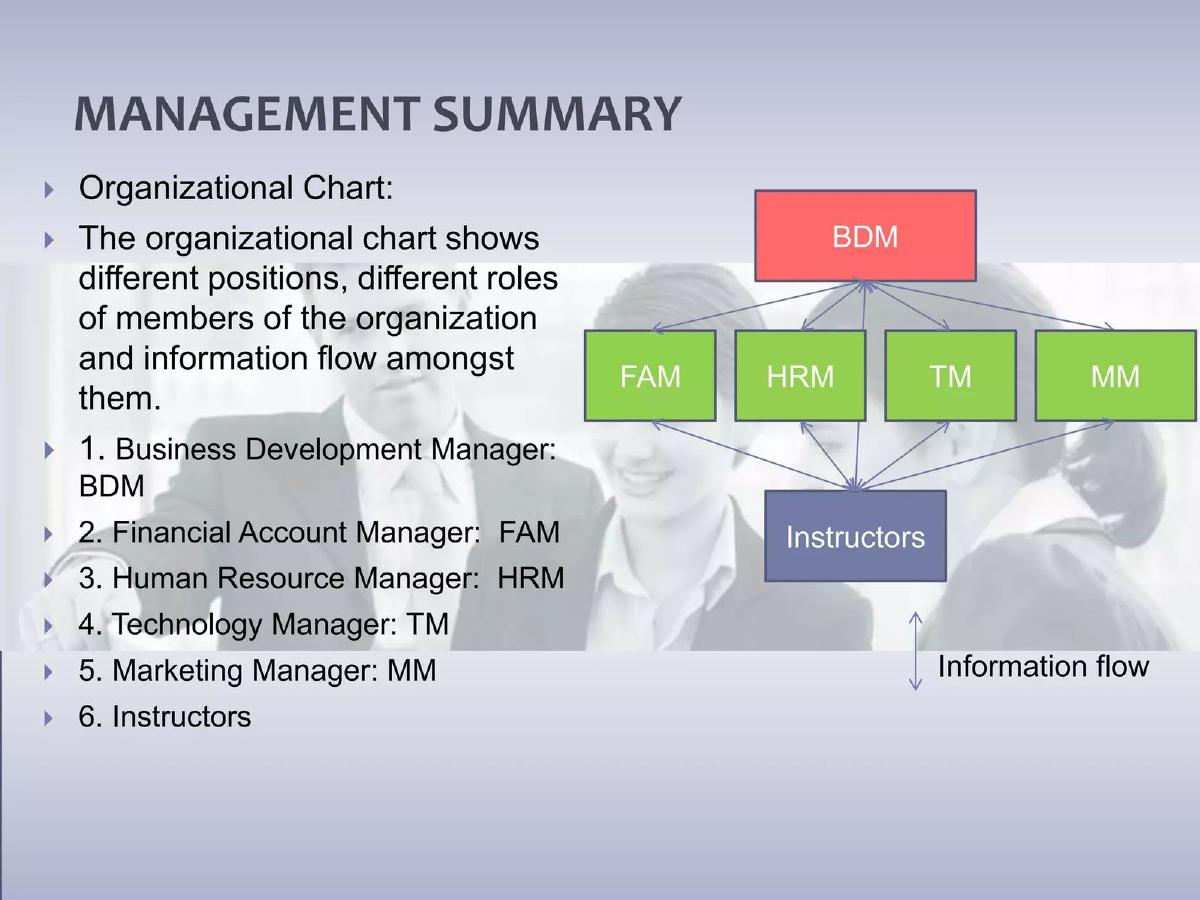
Cereus Edtech deck, slide 5. Exact stored slide matched to this analysis.
Our analysis: A warning: a chart that tells the investor nothing.
Evidence and limitation: Role abbreviations and arrows; no names, team sizes or open roles.
What a founder can adapt: Name people, or mark roles as open with an objective.
Supporting analysis
What the deck claims: "MANAGEMENT SUMMARY"; "The organizational chart shows different positions, different roles of members of the organization and information flow amongst them."; BDM, FAM, HRM, TM, MM and Instructors.
Presentation choice: Shows what a chart of titles without people leaves out.
When it does not fit: Explaining what an org chart is instead of what yours shows.
Whether each slide names people, gives team sizes, marks open roles and keeps its counts consistent.
Example
People named
Team sizes
Open roles marked
Counts consistent
SARC MedIQ
Yes, all
Visible from boxes
No
Not without explanation
micro1
Leaders only
Total only
No
Not checkable
Avalon Energia
One, temporary
No
Yes, with objectives
Not applicable
Cereus Edtech
No
No
No
Not applicable
Key Takeaways
Show an org chart only when structure adds information.
Name who leads each area, with team sizes beneath.
Make the headline headcount match the boxes.
Mark open roles and planned hires clearly.
For small teams, link to the chart or move it to the appendix.
Decide whether you need an org chart
Answer each prompt before drawing a chart.
Size. How many people do you have, and how do they split by area?
Leaders. Who leads each area, by name?
Open roles. Which roles are open, when will you fill them, and what is each for?
Counts. Does your headline count match the boxes? Are any people contractors or part time?
Placement. Does the structure add to your argument, or can it go in the appendix?
Copyable framework: [Total] people: [n] [area] led by [name], [n] [area] led by [name]. Open: [role], hiring [quarter], to [objective]. [Contractors or part-time noted.]
Illustrative example 1 — written by us
Before: "Org Chart" with six abbreviated titles and no names.
After: "14 people: 7 engineering (led by Priya Shah, CTO), 4 sales (led by Tom Reyes), 3 operations. Open: Head of Finance, Q2, to run the audit."
What improved: Our illustrative rewrite; names and figures are invented for the example. It gives leaders, team sizes and one open role with a purpose.
The question this guide answers
Founders ask whether an org chart belongs in a pitch deck, and if so, how to draw it. Our team guides cover who the founders are and why they fit the problem. Our hiring plan guide covers which roles the round will pay for. Neither covers the chart itself: how to show the shape of the current team, how many people report to whom, and how to show open roles inside that shape. Two existing guides mention org charts only in passing, as a list of roles without experience.
An org chart answers a narrower question than a team slide: does every important part of the business have someone responsible for it, and is the team built for the plan? That is a useful question for investors once a company has more than a handful of people. Before that, it usually adds little.
How we chose and read the examples
We searched saved slide text in the teardown library for "org chart", "organizational chart", "organization structure" and "reporting structure". We left out listed companies, funds, mining, energy and property-trust presentations, charts of legal entities rather than people, and product screens that mention org charts as a feature. Four slides from four startup decks remained, covering the range: a detailed chart for a growing company, a team slide that links out to a chart, a chart of roles still to be filled, and a chart with no names at all.
The four are SARC MedIQ (a health technology company), micro1 (AI-assisted engineering hiring), Avalon Energia (a Finnish nuclear waste repository venture) and Cereus Edtech (an education business). Each slide was rendered from the original deck at full size and read in full. Quotes are the slides' own. We counted boxes on the SARC MedIQ chart ourselves. We did not check any company's staff numbers against outside sources.
A detailed chart whose numbers need to add up
SARC MedIQ titles its slide "Org Chart", with three counts beneath: "23 Employees", "14 Sales Managers" and "6 Advisors". At the top are two founders: Asaad Hakeem, "Founder & CEO", with a Stanford Business logo, and Sadeem Mahmood, "Founder & CMO", with a Vanderbilt School of Medicine logo. Below them are a Chief Financial Officer, a Chief Technology Officer and a Chief Revenue Officer, each with named reports: engineering, infrastructure, marketing and quality directors under the technology chief; an HR manager and office admin beside the finance chief; a sales director, a support manager and many sales managers under the revenue chief. Two clinical trial roles hang off the CMO. Six advisors with photos and logos fill the right edge.
This is the most informative chart in the set. Every area has a named leader, the reader can see where the team is deep (engineering, sales) and where it is thin (finance has an HR manager and an office admin), and the clinical trial roles show the company is set up for medical studies.
But the counts do not match the chart without explanation. We count 37 named people in the boxes, excluding advisors, and 12 boxes titled "Sales Manager", not 14. Since 23 plus 14 is 37, the sales managers may be counted separately from employees, perhaps as contractors or commission-only staff, but the slide does not say. An investor who counts the boxes will ask. The logos of GE Healthcare, Mindray, Philips Healthcare and Siemens Healthineers beside the sales team are also unexplained: they could be where the sales staff used to work, or partners, or customers. Saying "23 employees plus 14 contract sales managers" and labelling the logos would remove both questions.
A small team that links out instead
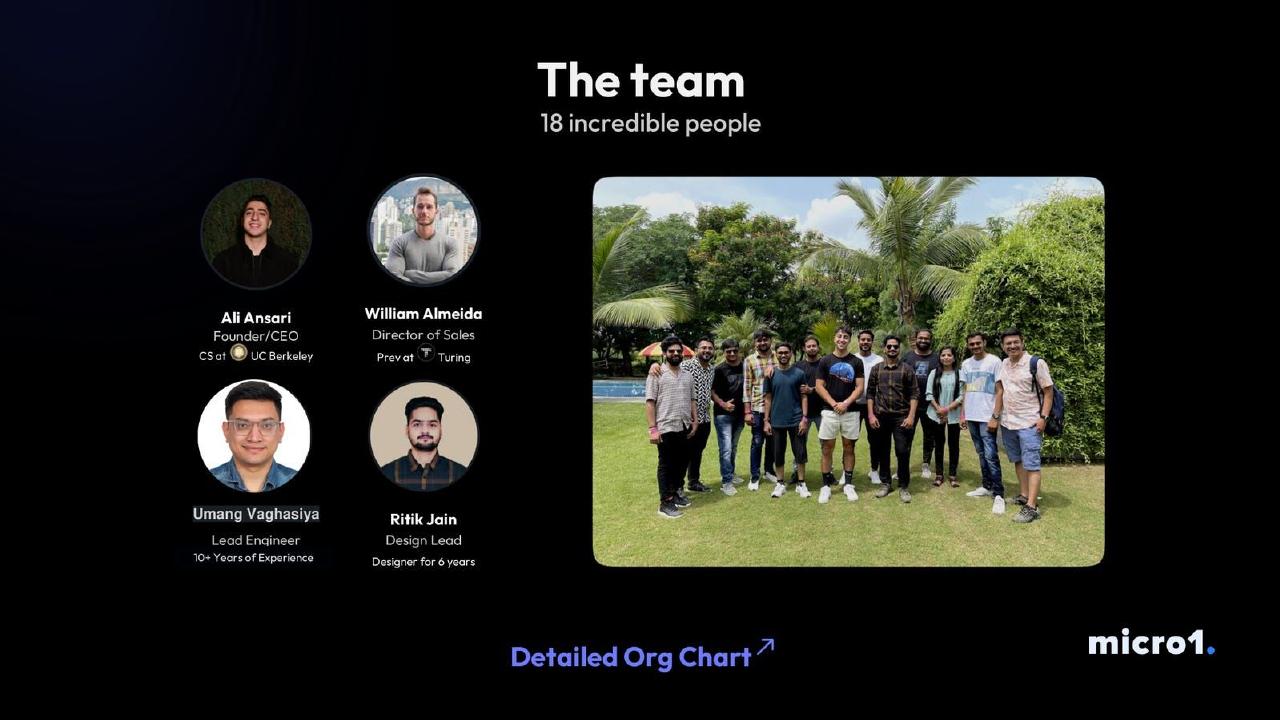
micro1 does not put an org chart in the main deck. Its slide is titled "The team" with "18 incredible people" beneath. Four people are shown with photos and one line each: Ali Ansari, "Founder/CEO", "CS at UC Berkeley"; William Almeida, "Director of Sales", "Prev at Turing"; Umang Vaghasiya, "Lead Engineer", "10+ Years of Experience"; Ritik Jain, "Design Lead", "Designer for 6 years". A group photo shows the wider team, and a link at the bottom reads "Detailed Org Chart".
For an 18-person company this is a sensible split. The main slide shows the leaders an investor will meet and gives the headcount; the full structure is one click away for anyone who wants it. It keeps the deck short without hiding anything.
The weakness is that the slide does not say how the 18 divide between areas, which is the one fact an org chart would add. A short line such as "10 engineering, 4 sales, 2 design, 2 operations" would give the reader the shape of the team without opening the link. And a link only works if the deck is read on screen and the link still opens; a printed or flattened PDF loses it.
A chart of roles still to fill
Avalon Energia titles its slide "Organization Structure Plan (2/3)" and draws "TEAM PHASE 1" as a circle. One person has a photo: "Leadership: Robert Nemlander (temp.), M.Sc." The other four positions show silhouettes, each with a main objective: "Nuclear Specialist: Identify 10 potential repository sites in Finland"; "Marketing Director: 70% public support for international nuclear waste repositories in Finland"; "Business Director: Secure MOUs for min. 12,000 tonnes of spent uranium from international energy companies"; and "Law Expert: Submit a proposal to the Finnish Parliament to amend the 1994 Nuclear Energy Law via the government, MPs or citizens' initiative".
Two things work well. The slide is honest: the silhouettes make it obvious that four of five positions are empty, and even the leader is marked as temporary. And each role comes with a measurable objective, so the reader knows what the hire is for, not just the title.
But it tells the investor that the company is, today, one temporary leader. That is not a reason to hide it, but the chart cannot carry the pitch alone. The deck needs to say elsewhere who the founder is, why the plan can attract these four people, and what the round pays for. Labelling the slide "Roles to hire in phase 1" rather than "Organization Structure" would also set expectations more accurately.
Warning: a chart with no people in it
Cereus Edtech puts its chart on a slide titled "MANAGEMENT SUMMARY". The text explains: "The organizational chart shows different positions, different roles of members of the organization and information flow amongst them." It then lists six roles: "Business Development Manager: BDM", "Financial Account Manager: FAM", "Human Resource Manager: HRM", "Technology Manager: TM", "Marketing Manager: MM" and "Instructors". The chart draws BDM at the top, the four managers beneath, and instructors at the bottom, with two-way arrows labelled "Information flow".
The slide gives an investor almost nothing. There are no names, so the reader cannot tell which roles are filled. There are no team sizes, so "Instructors" could be two people or two hundred. The text describes what an org chart is rather than what this one shows. And the abbreviations make the reader cross-reference the list to read the chart.
If you only have roles, not people, use Avalon Energia's approach instead: say which are open and what each is for. If you have people, name them. Either way, cut the explanation of what an org chart is.
When an org chart belongs in the deck
Use a full chart in the main deck when structure is part of the argument: for example, when you have built out a sales team, when a regulated business needs named people for compliance or clinical work, or when investors will want to see who owns each area before a larger round. SARC MedIQ's chart serves this purpose.
For a team under about 20, show the leaders on the team slide and give the headcount by area in one line, with the full chart in the appendix or behind a link, as micro1 does.
Before you have a team, a chart of open roles can help if each role comes with an objective and the slide is honest about what is empty, as Avalon Energia's is. Otherwise, skip it and use a hiring plan slide.
What a good chart shows
Keep it to the leaders and the size of each team. Put the founders at the top, then one box per area with the leader's name, title and the number of people beneath. Mark open roles in a different style, such as a dashed outline, with the hire date. Keep advisors and board members off the reporting lines, or in a clearly separate block. Make the headline count match the boxes, and if some people are contractors or part time, say so.
Common mistakes
Titles without names. Name who holds each role or mark it as open.
Counts that do not match. Reconcile headline numbers with the boxes.
Unexplained logos. Say whether logos are past employers, partners or customers.
Open roles hidden. Mark them clearly with a hire date and purpose.
Explaining the format. Say what your chart shows, not what charts are.
Diagnostic checklist
Chart only when structure adds information.
Leaders named, team sizes shown.
Open roles marked with date and purpose.
Headline counts match the boxes.
Contractors and part-time staff noted.
Frequently asked questions
Should I include an org chart in my pitch deck?
Only when structure adds something the team slide cannot, usually once you have more than about 20 people or a regulated area needing named owners. Otherwise, give headcount by area in one line.
How do I show roles I have not hired yet?
Mark them in a different style, with a hire date and a one-line objective for each, as Avalon Energia does.
Should advisors be on the org chart?
Keep them off the reporting lines. Show them in a separate block or on their own slide.
What if some people are contractors?
Say so next to the headcount, so the reader's count of boxes matches yours.
How we chose these examples
Corpus: published pitch deck teardowns on StartupFundraising.com. Founder-uploaded private decks are excluded.
Selection (2026-10-01): we searched extracted slide text for org chart and organisation structure phrases, excluded listed-company, fund, mining, energy and property-trust presentations, legal-entity charts and product screens, and kept four slides from four startup decks.
Review: all four slides were rendered from the source decks at full size on 2026-10-01 and read in full against company, deck and page number (editorial model review, with AI assistance in drafting). Box counts on the SARC MedIQ chart were made by us from the slide. No person has yet completed a human review. No staff numbers were checked against outside sources.