What We Learned Slide Examples: How to Present Early Tests
How to present what your early tests taught you: what you expected, what happened, how you know, and what you changed as a result.
What We Learned Slide: Show What You Expected, What Happened and What You Changed
Early-stage founders often have more lessons than results. They have run ads, interviewed customers, sold to a few accounts or launched in one city, and the most honest thing they can show is what those tests taught them. A "what we learned" slide can be persuasive, because it shows a team that tests ideas and changes course on evidence. It can also be filler: a list of maxims that any founder could write without having done anything. This guide uses seven slides from six decks to show the difference, from a two-column "what we thought, what we learned" table to a slide whose figures were blacked out before it was shared.
TL;DR
A useful lessons slide pairs each lesson with three things: what you believed before, the test that changed your mind (with its size and date), and the decision you made because of it. Blossom's "Week 1-3 learnings" table puts the before and after side by side: parents do not want every detail of the day, they want to hear about anything unusual. FreeSpot ties its lessons to a result (2,000+ users in under six months with no ad spend). The weakest slides give general advice with no test behind it (Blossom's later "Collective Learning" slide) or hide the numbers that would make the lesson credible (SIQ Basketball). Onda shows a different method: lessons drawn from competitors' results rather than its own.
Seven lessons slides, read in full
Each example quotes the slide, separates what the slide claims from what it shows, and notes what to copy and what to avoid.
Blossom traction slide — slide 4
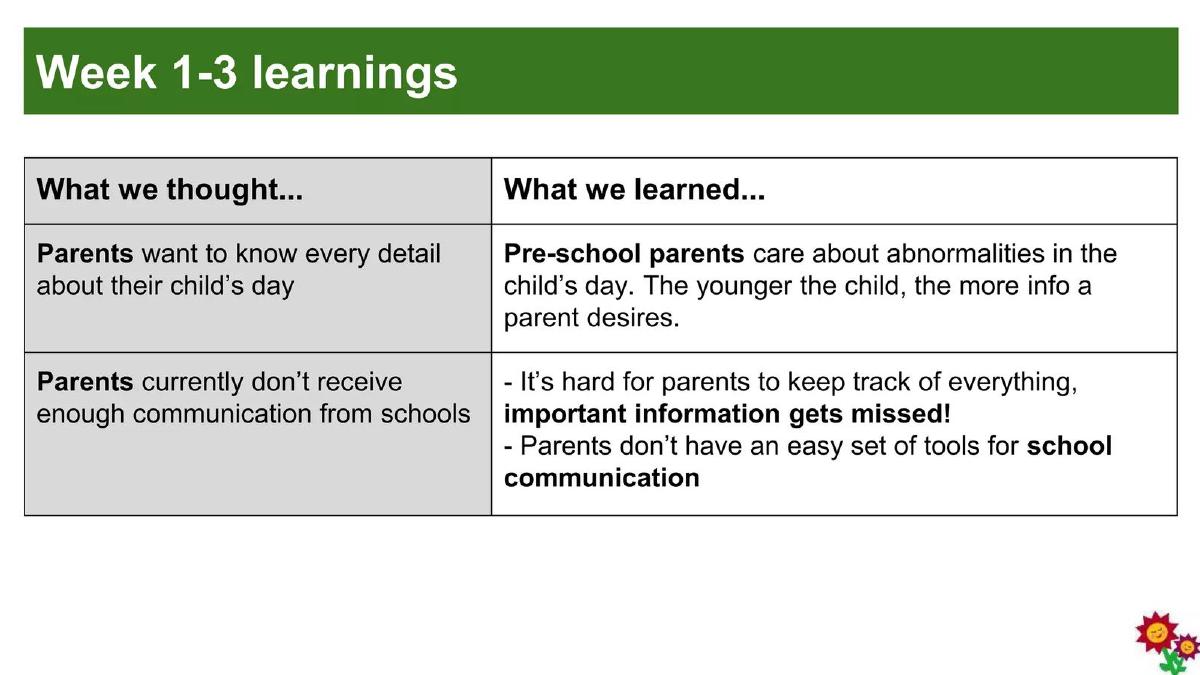
Preschool-to-parent communication app, apparently from a university startup course. Slide titled "Week 1-3 learnings".
Blossom deck, slide 4. Exact stored slide matched to this analysis.
Our analysis: The first row changes what the product should do: flag the unusual, scale detail by age.
Evidence and limitation: Time frame given; number and type of interviews not given.
What a founder can adapt: Add how many parents or schools you spoke to and what you built differently.
Supporting analysis
What the deck claims: "What we thought... Parents want to know every detail about their child's day" / "What we learned... Pre-school parents care about abnormalities in the child's day. The younger the child, the more info a parent desires." Second row: communication gaps; "important information gets missed!"
Presentation choice: Shows a change of mind, not a statement of the obvious.
When it does not fit: Lessons with no stated test behind them.
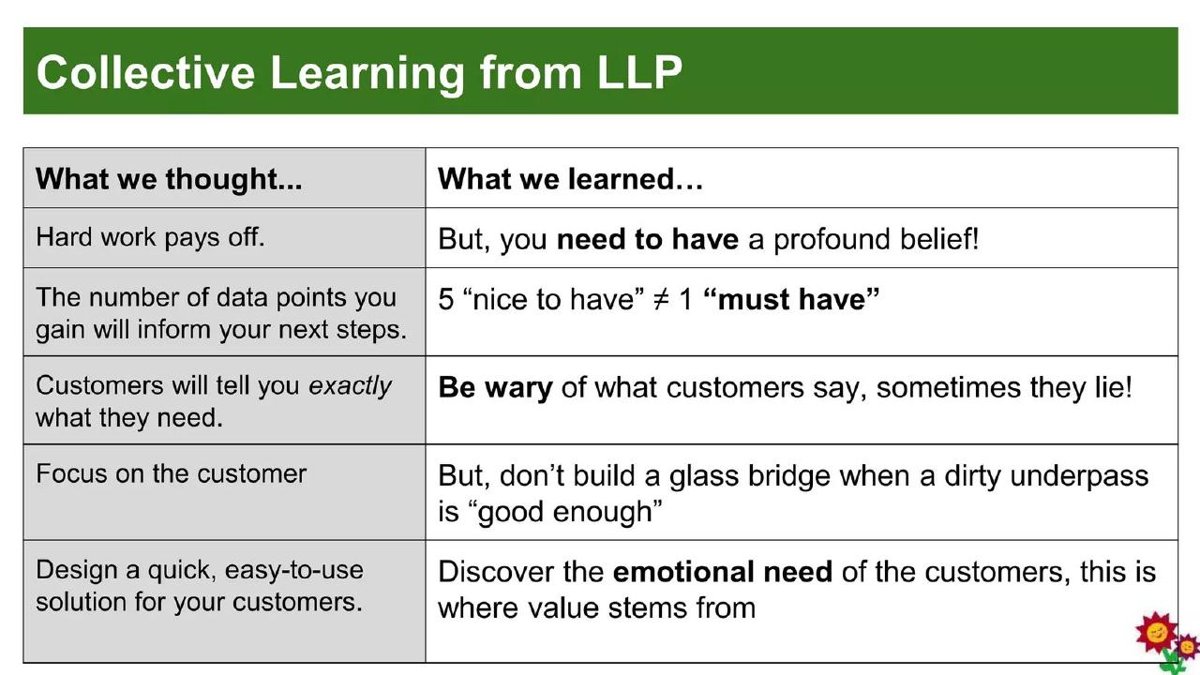
Same deck. Slide titled "Collective Learning from LLP".
Blossom deck, slide 17. Exact stored slide matched to this analysis.
Our analysis: Most lines could be written by any team in the same course.
Evidence and limitation: General advice; no customer or market finding.
What a founder can adapt: Keep only lessons that came from your own customers.
Supporting analysis
What the deck claims: "Hard work pays off" / "But, you need to have a profound belief!"; "Customers will tell you exactly what they need" / "Be wary of what customers say, sometimes they lie!"; "5 'nice to have' ≠ 1 'must have'".
Presentation choice: A warning example: same format as the stronger slide, but no company-specific substance.
When it does not fit: Maxims presented as findings.
FreeSpot deck, slide 5. Exact stored slide matched to this analysis.
Our analysis: The third lesson rests on what users did, which is stronger than what they said.
Evidence and limitation: User count undefined; lessons partly from observed behaviour.
What a founder can adapt: Define "users" and say what you changed because of each lesson.
Supporting analysis
What the deck claims: "2,000+ Users in Less than 6 Months with $0 Ad Spend and 0 Press Coverage!" "What We Learned:" users loyal to outcomes not platforms; logistics problems everywhere; "Low Income / Homeless Customers are Underserved" (users posting requests for food and essentials).
Presentation choice: Lessons sit under a result, so the reader knows they come from real users.
When it does not fit: Lessons with no resulting decision.
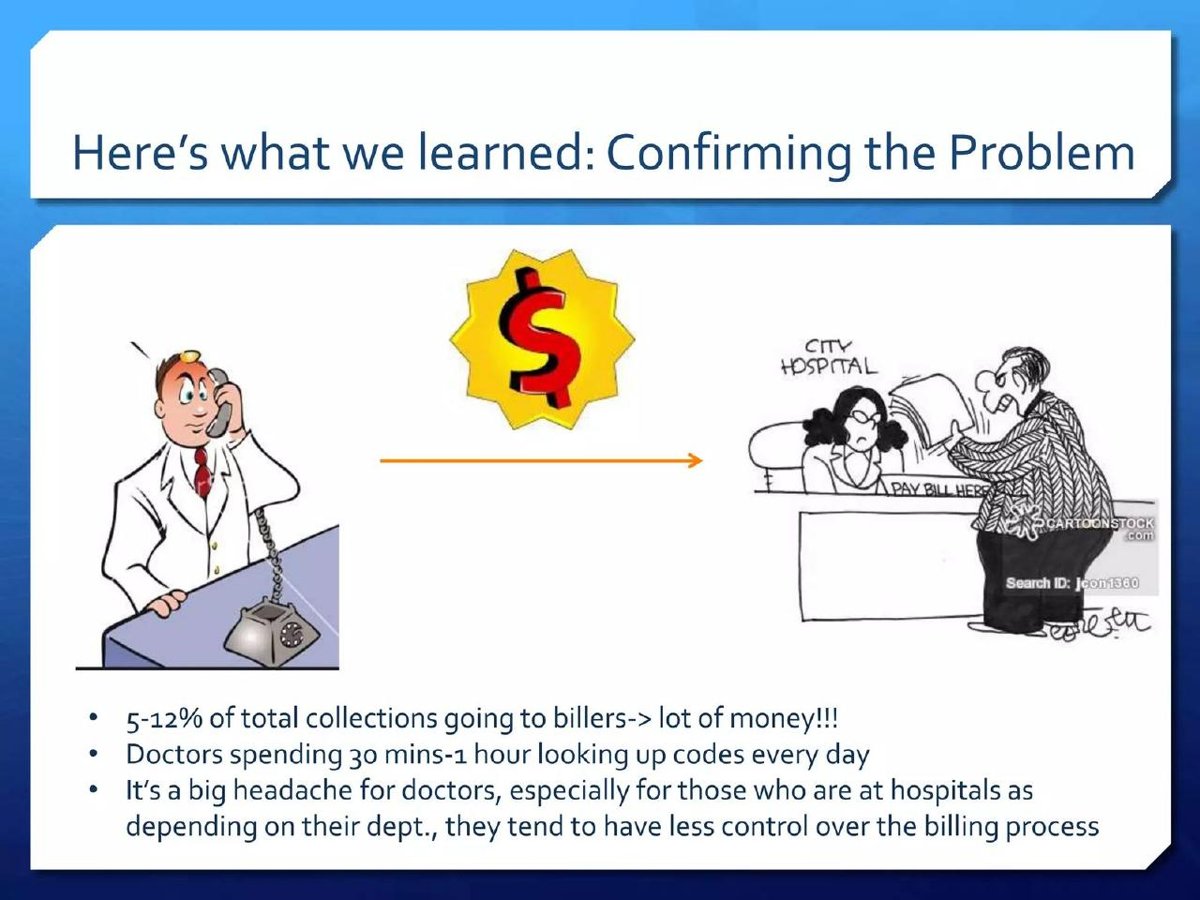
Medical billing code tool, apparently from a university startup course. Slide titled "Here's what we learned: Confirming the Problem".
Rubix Health deck, slide 7. Exact stored slide matched to this analysis.
Our analysis: Field findings expressed as figures, plus a segment insight.
Evidence and limitation: Figures without a stated source or interview count.
What a founder can adapt: State how many people you interviewed and who they were.
Supporting analysis
What the deck claims: "5-12% of total collections going to billers-> lot of money!!!"; "Doctors spending 30 mins-1 hour looking up codes every day"; hospital-based doctors "tend to have less control over the billing process".
Presentation choice: Turns discovery into numbers rather than adjectives.
When it does not fit: Unsourced ranges that read as research.
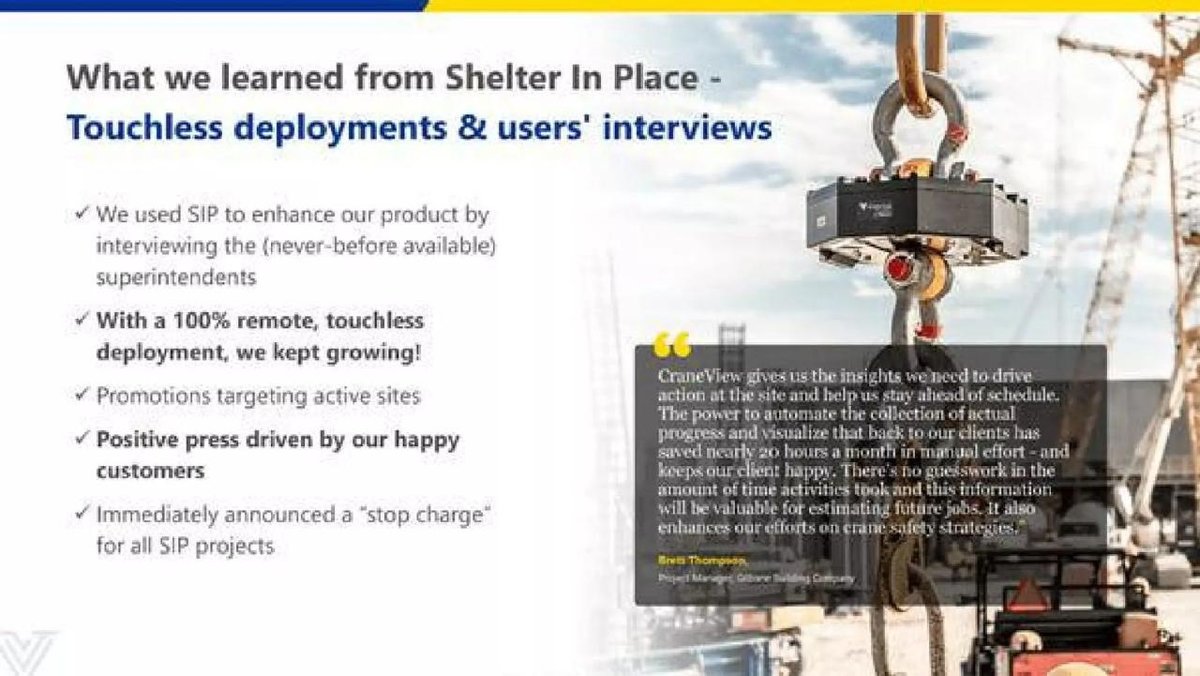
Construction crane sensor and software (CraneView). Slide titled "What we learned from Shelter In Place - Touchless deployments & users' interviews".
Versatile deck, slide 12. Exact stored slide matched to this analysis.
Our analysis: Names the event, what the team did and a customer-facing decision.
Evidence and limitation: Actions and a decision stated; growth not quantified.
What a founder can adapt: Give the growth figure and number of remote installs.
Supporting analysis
What the deck claims: Interviewed superintendents; "With a 100% remote, touchless deployment, we kept growing!"; promotions targeting active sites; "Immediately announced a 'stop charge' for all SIP projects"; customer quote: "saved nearly 20 hours a month in manual effort".
Presentation choice: Closest to the full belief-test-change pattern.
When it does not fit: "We kept growing" without a number.
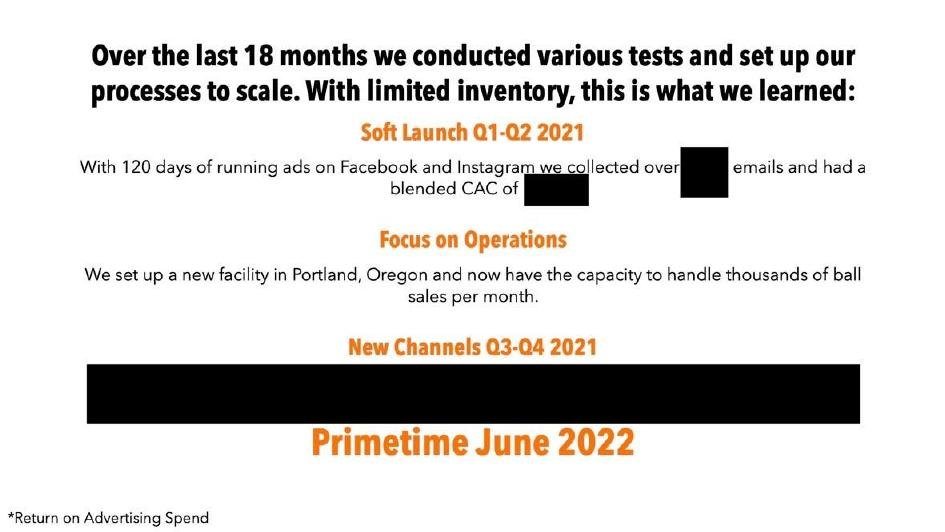
Smart basketball maker. Slide opening "Over the last 18 months we conducted various tests...".
SIQ Basketball deck, slide 7. Exact stored slide matched to this analysis.
Our analysis: Right structure and measures, but the lesson itself is not visible.
Evidence and limitation: Key figures redacted in the library copy.
What a founder can adapt: If figures are sensitive, give a range or a ratio instead of removing them.
Supporting analysis
What the deck claims: "Soft Launch Q1-Q2 2021": 120 days of Facebook and Instagram ads, "collected over [blacked out] emails", "blended CAC of [blacked out]"; Portland facility can "handle thousands of ball sales per month"; "New Channels Q3-Q4 2021" blacked out; "Primetime June 2022".
Presentation choice: A warning example: dated tests with the results removed.
When it does not fit: Claiming a lesson while hiding the number behind it.
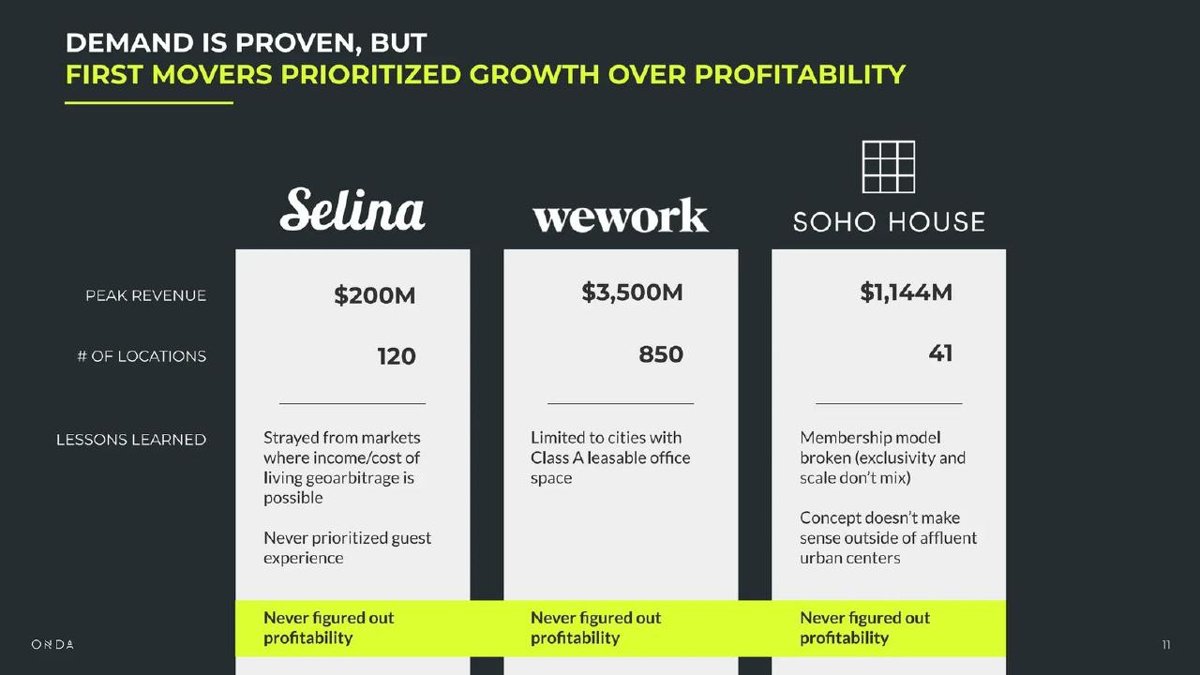
Planned clubhouses for remote workers. Slide titled "Demand is proven, but first movers prioritized growth over profitability".
Onda deck, slide 11. Exact stored slide matched to this analysis.
Our analysis: Lessons borrowed from competitors, each implying a choice Onda will make differently.
Evidence and limitation: Competitor figures with no source or date.
What a founder can adapt: Cite the figures and say how you will test each lesson in your first sites.
Supporting analysis
What the deck claims: Selina $200M peak revenue, 120 locations; WeWork $3,500M, 850; Soho House $1,144M, 41. Lessons learned for each (e.g. "Membership model broken (exclusivity and scale don't mix)"); each marked "Never figured out profitability".
Presentation choice: Shows judgment before the company has its own results.
When it does not fit: Treating others' lessons as proof your plan works.
Whether each slide states the prior belief, the test, a result and the change made.
Example
Prior belief
Test named
Result
Change made
Blossom (weeks 1-3)
Yes
Time frame only
No
Implied
Blossom (collective)
Yes
No
No
No
FreeSpot
No
Platform use
2,000+ users
No
Rubix Health
No
Not stated
Figures, unsourced
No
Versatile
No
Shelter in place
"Kept growing"
Yes (stop charge)
SIQ Basketball
No
120 days of ads
Redacted
Facility
Onda
No
Competitors
Competitor figures
Implied
Key Takeaways
Put the old belief next to the new one.
Name the test behind each lesson: what, how many, when.
Say what you changed because of it.
Prefer lessons only your company could have learned.
Lessons from competitors need their figures and a source.
Build your lessons slide
Answer these for each lesson before it goes on a slide.
Belief. What did you believe before the test?
Test. What did you do, with how many customers or how much spend, and when?
Finding. What happened, as a number or an observed behaviour?
Change. What did you change in the product, pricing or plan because of it?
Ownership. Could another company have written this lesson without doing your work?
Copyable framework: We believed [belief]. We tested it by [test, size, dates]. We found [finding]. So we [change].
Illustrative example 1 — written by us
Before: Lessons learned: customers value simplicity; free trials work; focus is key.
After: We believed a 30-day free trial would convert. Across 140 trials from March to May, 9% of trials without card details converted against 31% with them. We now ask for card details at sign-up.
What improved: Our illustrative rewrite; all figures are invented for the example. It states the belief, the test size and dates, the finding as a number, and the decision that followed.
The question this guide answers
Founders ask how to show progress when the numbers are still small. One honest answer is to show what the early work taught you. Other guides in this library cover nearby questions. The market validation guide covers evidence that people already spend time or money on the problem. The pivot guide covers changing the whole business and showing results since the change. The conversion funnel guide covers rates at each sales step. None of them covers the slide where a team reports what its tests taught it, short of a pivot, and how it changed the plan.
Investors read this kind of slide for two things. The first is the substance of each lesson: does it tell them something true about the customer or the market that they did not know? The second is the team: does it run real tests, notice when it was wrong, and act on it? A slide can pass the second test even with small numbers, as long as each lesson is specific and visibly came from something the team did.
How we chose and read the examples
We searched the extracted text of the slide library for phrases such as "what we learned" and "lessons learned", then removed slides from public companies, investment funds, research reports and slides where the phrase appeared in passing. We viewed the remaining candidates and kept seven slides from six decks, each showing a different way of presenting lessons. The two slides with small print, FreeSpot and Onda, were rendered again at a larger size to confirm the wording. Two of the decks, Blossom and Rubix Health, appear to come from university startup courses; we use them because their slide structure is instructive, not because of any fundraising outcome.
We quote what is visible on each slide. We have not checked any company's claims against other sources, and we make no claim that any slide affected a fundraising result. Where a slide leaves something out, we say so and say what it would take to fill the gap.
Put the old belief next to the new one
Blossom, an app that helps preschools keep parents informed, titles one slide "Week 1-3 learnings". It is a two-column table headed "What we thought..." and "What we learned...". The first row reads: thought, "Parents want to know every detail about their child's day"; learned, "Pre-school parents care about abnormalities in the child's day. The younger the child, the more info a parent desires." The second row reads: thought, "Parents currently don't receive enough communication from schools"; learned, "It's hard for parents to keep track of everything, important information gets missed!" and "Parents don't have an easy set of tools for school communication".
The format does most of the work. By showing the belief the team started with, the slide makes the lesson visible as a change of mind, not a statement of the obvious. The first row is the stronger one: it changes what the product should do. A product built on the first belief sends parents a stream of updates; a product built on the second flags what is unusual and adjusts by the child's age. That is a design decision an investor can follow.
What the slide leaves out is the test. "Week 1-3" gives a time frame but not how many parents or schools the team spoke to, or how. One added line, such as the number of interviews and where they came from, would turn a plausible lesson into evidence. The slide also stops at the lesson; a third column saying what the team built or changed as a result would close the loop.
General advice is not a lesson
A later Blossom slide, titled "Collective Learning from LLP", uses the same two columns for broader lessons. Its rows include: thought, "Hard work pays off"; learned, "But, you need to have a profound belief!"; thought, "Customers will tell you exactly what they need"; learned, "Be wary of what customers say, sometimes they lie!"; and thought, "The number of data points you gain will inform your next steps"; learned, "5 'nice to have' ≠ 1 'must have'".
Several of these are sensible, and the "nice to have" line is a good rule. But almost none of them is about Blossom's customers or market. Any team that has been through a startup course could write the same slide. That is the test to apply to every line on a lessons slide: could another company have written it without doing your work? If yes, it tells an investor about the course, not about the business. In an investor deck, keep the lessons that came from your own customers and drop the general advice, or move it to the appendix.
Tie lessons to a result
FreeSpot, a marketplace where people give away and request free items, puts its lessons on its traction slide. The headline reads "2,000+ Users in Less than 6 Months with $0 Ad Spend and 0 Press Coverage!". Below it, under "What We Learned:", are three points: "Users are loyal to outcomes not platforms. People are willing to have multiple marketplace apps as long as they provide value."; "Marketplace logistics problems exist everywhere! Users from across the US struggle with transporting the items they find on second-hand marketplaces."; and "Low Income / Homeless Customers are Underserved. Our users are posting requests for food and essential items while sharing their housing status with other users."
Putting the lessons under a result is a good choice: the reader knows the lessons come from real users, and roughly how many. The third lesson is the most useful, because it comes from what users actually did on the platform (posting requests and sharing their housing status) rather than what they said. That kind of observed behaviour is harder to dispute than an interview answer.
Two things are missing. The slide does not say what FreeSpot changed because of these lessons: whether it is adding delivery, targeting a new group of users, or neither. And "2,000+ users" needs a definition (sign-ups or active users) to say how much weight the lessons can bear.
Lessons from customer interviews need the interviews
Rubix Health, which works on medical billing codes, titles one slide "Here's what we learned: Confirming the Problem". Under a cartoon of a doctor and a hospital billing desk it gives three points: "5-12% of total collections going to billers-> lot of money!!!"; "Doctors spending 30 mins-1 hour looking up codes every day"; and "It's a big headache for doctors, especially for those who are at hospitals as depending on their dept., they tend to have less control over the billing process".
The slide does a useful thing: it reports what the team found in the field as figures (a share of collections, minutes per day) rather than adjectives. The third point adds a segment insight, that doctors in hospital departments have less control over billing, which matters for who the company sells to.
What it does not say is where the figures came from. "5-12%" and "30 mins-1 hour" could be from interviews, published studies or a single conversation. A lessons slide built on customer discovery should say how many people were interviewed and who they were; the same deck's following slides continue the "Here's what we learned" series for customer segments and channels, so a single line on method at the start of the series would cover all of them.
Lessons from a forced change
Versatile, which makes a sensor and software system for construction cranes (CraneView), has a slide titled "What we learned from Shelter In Place - Touchless deployments & users' interviews". It lists: "We used SIP to enhance our product by interviewing the (never-before available) superintendents"; "With a 100% remote, touchless deployment, we kept growing!"; "Promotions targeting active sites"; "Positive press driven by our happy customers"; and "Immediately announced a 'stop charge' for all SIP projects". A customer quote on the right, from a project manager, says CraneView "saved nearly 20 hours a month in manual effort".
This slide is closest to the full pattern. It names the event that forced the test (shelter-in-place orders), says what the team did (interviewed superintendents who were suddenly available, deployed remotely, stopped charging paused projects) and claims a result (continued growth). The "stop charge" line is a decision, and an unusual one to show; it tells investors how the company treats customers under pressure.
The gap is the size of the result. "We kept growing" needs a figure and a period, and the remote deployment lesson would be stronger with the number of sites installed remotely. Without them, the slide shows sound judgment but not the evidence that remote deployment works at scale.
Do not hide the figures that make the lesson
SIQ Basketball, which sells a smart basketball, has a slide headed "Over the last 18 months we conducted various tests and set up our processes to scale. With limited inventory, this is what we learned:". Under "Soft Launch Q1-Q2 2021" it says "With 120 days of running ads on Facebook and Instagram we collected over [blacked out] emails and had a blended CAC of [blacked out]". Under "Focus on Operations": "We set up a new facility in Portland, Oregon and now have the capacity to handle thousands of ball sales per month." Under "New Channels Q3-Q4 2021" the text is entirely blacked out, followed by "Primetime June 2022".
The structure is good: dated phases, a named test (120 days of paid social), and the right measures (emails collected, blended customer acquisition cost). But in the version of the deck in our library, the figures are blacked out, so the slide shows the shape of a lesson without the lesson itself. We do not know whether the redaction was the company's choice for a public version or happened later.
The general point holds either way. A lessons slide that says "we tested paid ads" without the result asks the investor to trust the conclusion. If figures are too sensitive for a deck that will circulate, give a range or a ratio (for example, cost per email against the price of the ball) rather than removing the number entirely.
Lessons from other companies' results
Onda, which plans clubhouses for remote workers, uses a different source of lessons: its competitors. The slide is titled "Demand is proven, but first movers prioritized growth over profitability" and compares Selina, WeWork and Soho House. For each it gives peak revenue ($200M, $3,500M and $1,144M) and number of locations (120, 850 and 41), then a "Lessons learned" row: Selina "Strayed from markets where income/cost of living geoarbitrage is possible" and "Never prioritized guest experience"; WeWork "Limited to cities with Class A leasable office space"; Soho House "Membership model broken (exclusivity and scale don't mix)" and "Concept doesn't make sense outside of affluent urban centers". Under each column a highlighted bar reads "Never figured out profitability".
This is a fair way for a pre-launch company to show judgment: each lesson implies a choice Onda says it will make differently, such as picking markets where living costs are low. The figures give the comparison weight. Two cautions apply. The slide cites no source or date for the revenue and location figures, and an investor will check them. And lessons drawn from others are still hypotheses for Onda; the slide should say how the company will test them in its own first locations.
What a complete lessons slide shows
Taken together, the six decks show each part of a strong lessons slide, though no single slide has every part. Blossom shows the before and after. FreeSpot ties lessons to a result. Rubix Health turns field findings into figures. Versatile names the event, the actions and a decision. SIQ Basketball shows the right structure but not the numbers. Onda shows how to borrow lessons from competitors and what that method needs.
A practical layout is a table with four columns: what we believed, what we tested (size and dates), what we found, and what we changed. Keep it to three or four rows. If a row has nothing in the "what we changed" column, ask whether it belongs on the slide. If the business has since pivoted, use the pivot guide instead; this slide is for the smaller corrections that keep a plan on track.
Common mistakes
Maxims as findings. General startup advice tells investors nothing about your market.
No test behind the lesson. Say what you did, how many and when.
No change made. A lesson with no decision attached reads as commentary.
Hidden numbers. Give a range or ratio rather than blacking out the result.
Borrowed lessons as proof. Competitors' mistakes are hypotheses for you, not evidence.
Diagnostic checklist
Each lesson shows the belief it replaced.
Each lesson names its test, size and dates.
Findings given as numbers or observed behaviour.
Each lesson has a resulting change.
Competitor figures cited with source and date.
Frequently asked questions
Is a lessons slide a sign of weakness?
Not when each lesson is specific and led to a decision. It shows a team that tests and adjusts. It reads as weak when it replaces results the company should have, or when the lessons are general advice.
How is this different from a pivot slide?
A pivot changes the business: customer, product or model. A lessons slide covers smaller corrections inside the same plan. If your lessons led to a new business, use the pivot format with dates and results since the change.
Where should the slide go?
Usually next to traction or validation, so lessons sit beside the results they came from. Lessons drawn from competitors fit near the competition slide.
How we chose these examples
Corpus: published pitch deck teardowns on StartupFundraising.com. Founder-uploaded private decks are excluded.
Removed in v2 (2026-10-05): Mattermark, because a page of its deck carries a restriction notice. Selection (2026-10-01): we searched extracted slide text for "what we learned", "lessons learned" and similar phrases, excluded public companies, investment funds, research reports and passing mentions, and kept seven slides from six decks that each show a distinct way of presenting lessons.
Review: all seven slides were viewed from the source decks on 2026-10-01 against company, deck and page number, with the FreeSpot and Onda slides rendered again at a larger size to confirm small text (editorial model review, with AI assistance in drafting). No person has yet completed an editorial review of this page. We did not verify any company's figures.