Dating Traction Metrics on a Pitch Deck: When to Write 'As
'We currently have 110 users' stops being true the week you send the deck. Four real slides show how to date your numbers so investors know what period.
Put a Date on Your Traction Numbers: Say When Each Figure Was True
A pitch deck is read for months after it is written. It gets forwarded, reopened before a second meeting, and pulled up during due diligence. A line such as 'We currently have 110 users' is accurate on the day it is typed and becomes less accurate every week after that. Without a date, an investor can't tell whether the number is from last week or last year, whether growth has continued since, or whether a figure in the data room should match it. This guide looks at four slides that handle dates differently and shows where a date belongs, how precise it needs to be, and what goes wrong when it is missing.
TL;DR
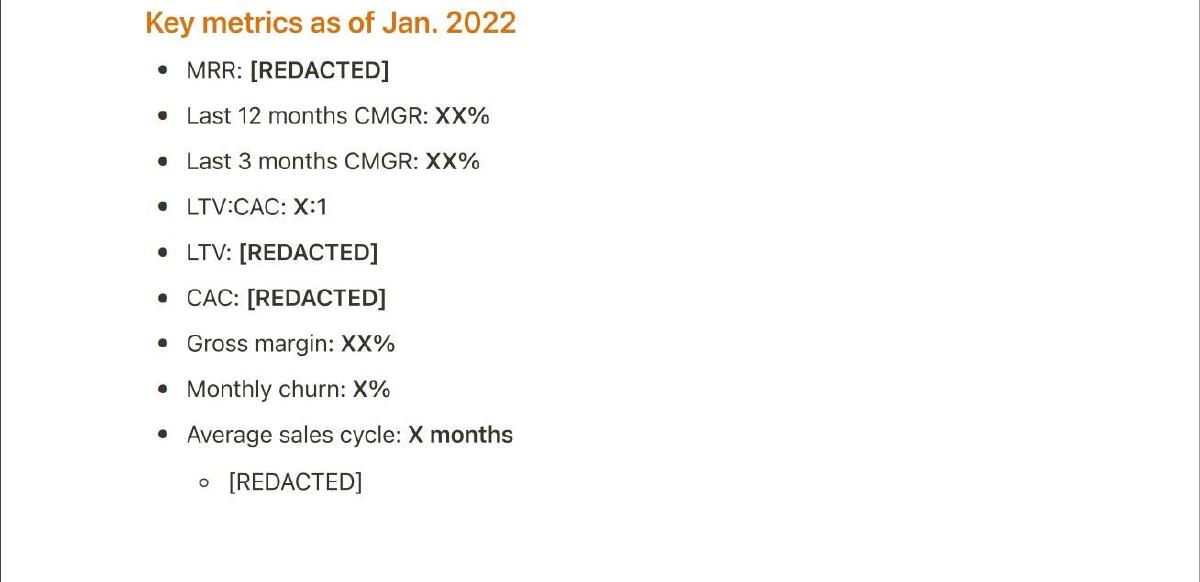
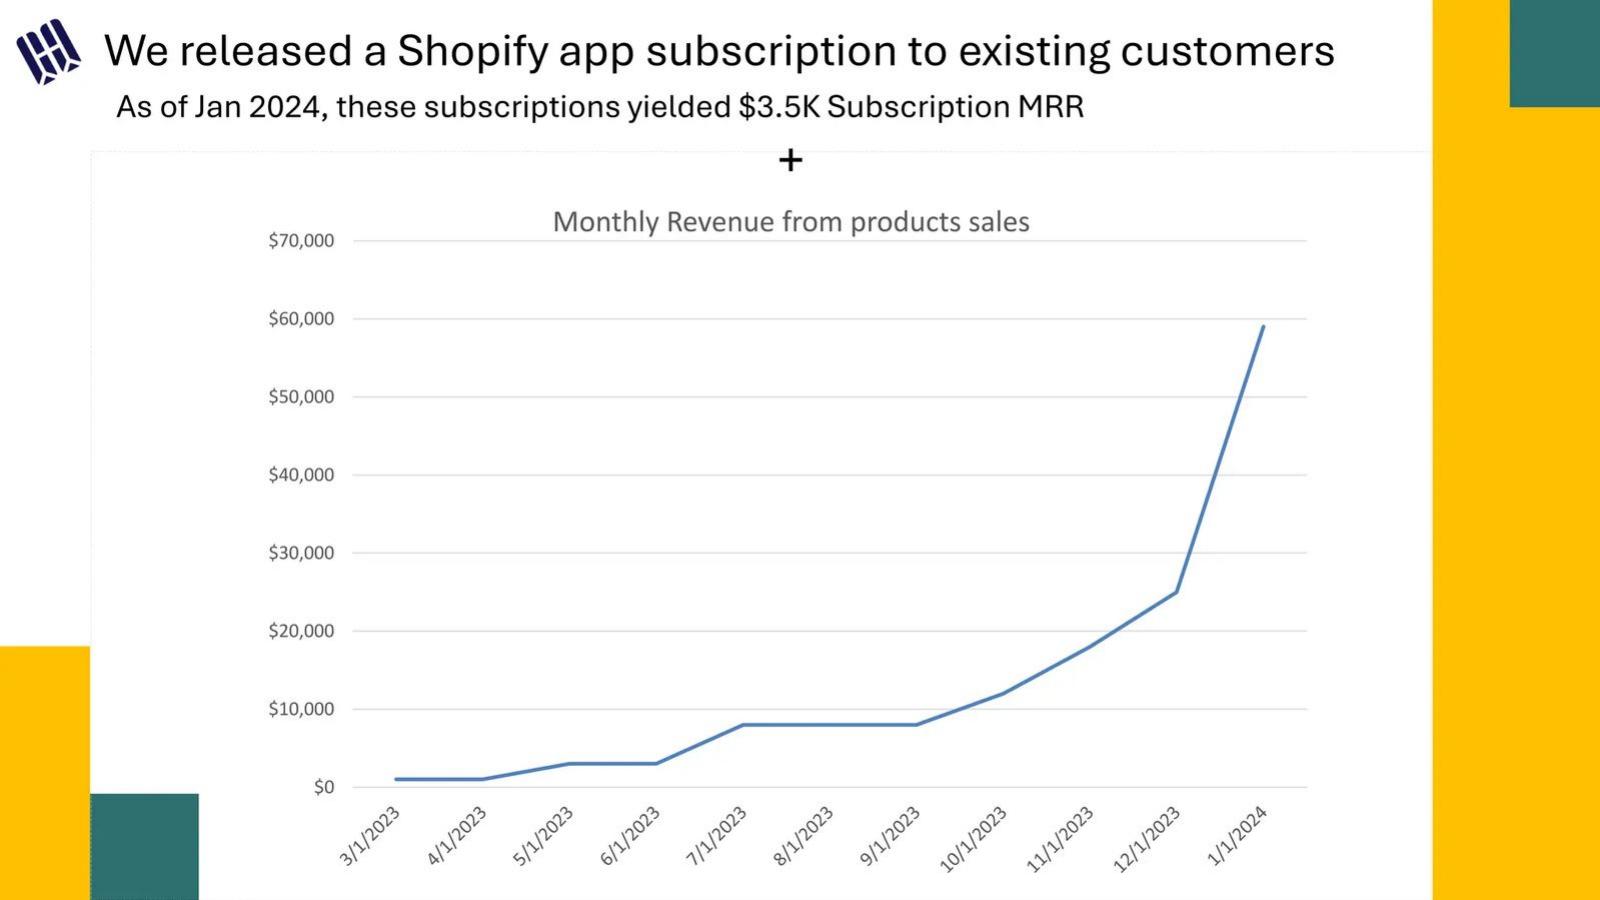
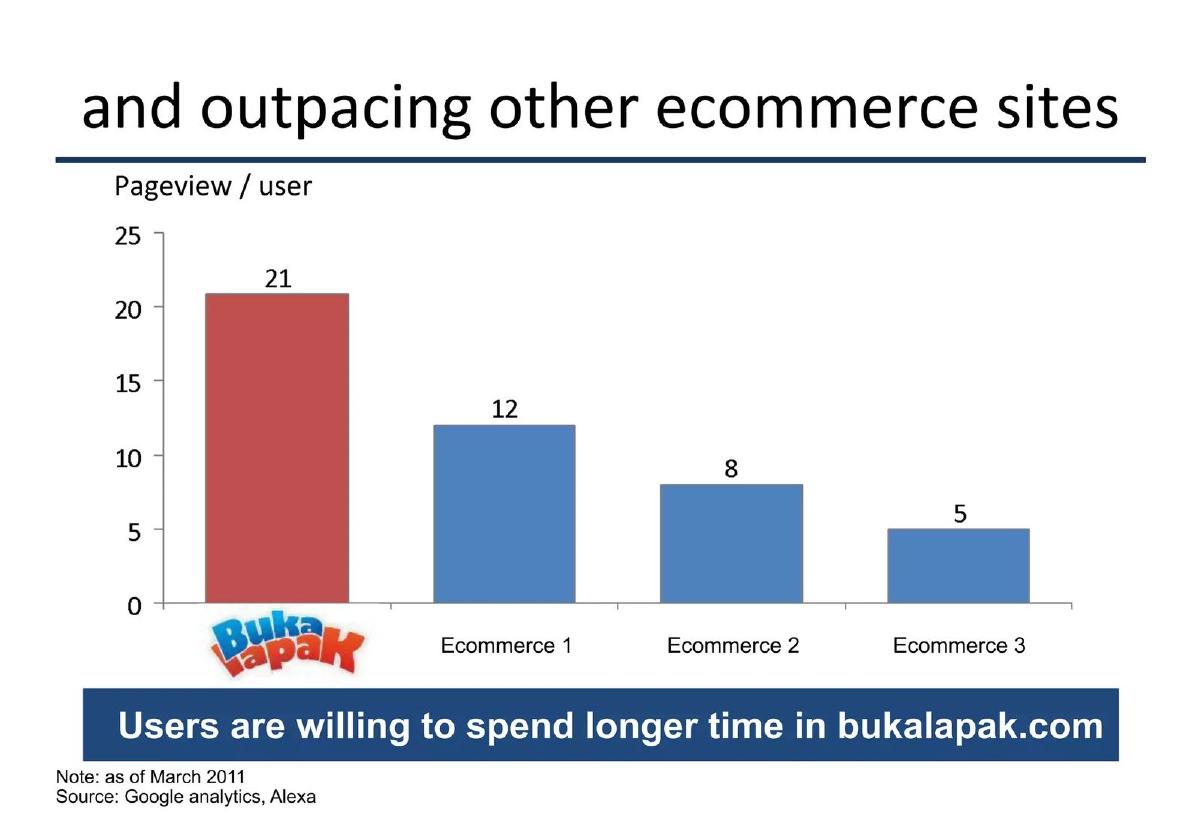
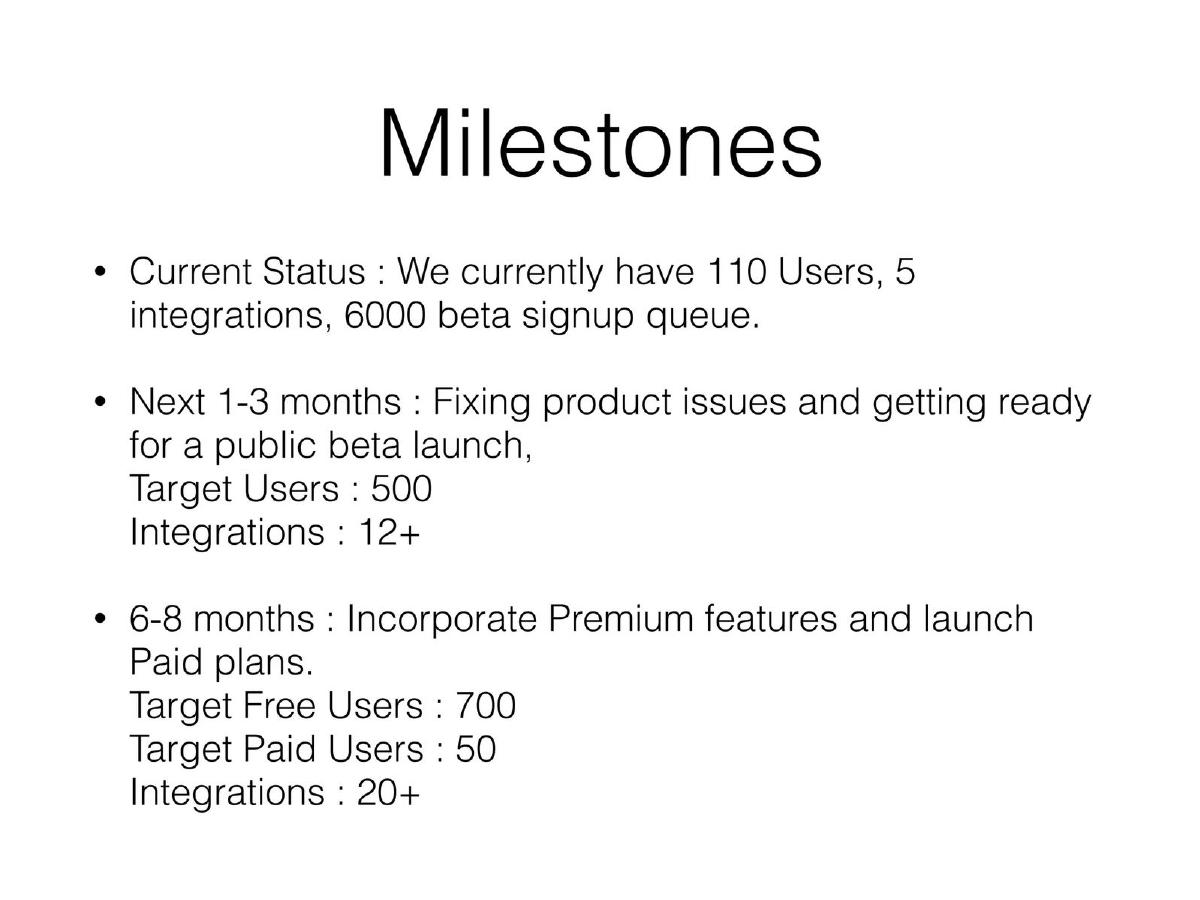
Give every traction figure the date it was measured, as a month and year at minimum, and put it where the reader sees it with the number: in the slide title if every figure shares one date, beside the figure if dates differ. Replace 'currently', 'today' and 'to date' with that date, and anchor any forward targets ('next 3 months') to it. Arist titles its metrics slide 'Key metrics as of Jan. 2022', so every figure below shares one date. HomeRoots Insights writes 'As of Jan 2024, these subscriptions yielded $3.5K Subscription MRR' above a monthly chart whose last point is 1/1/2024. Bukalapak puts 'Note: as of March 2011' in small type under a comparison with other sites. Mailage writes 'Current Status : We currently have 110 Users' with no date, then sets targets for the 'Next 1-3 months' with no start point.
Four slides that date their figures differently
Each slide is read at full size. Quotes are exact; chart readings are our estimates.
Arist traction slide — slide 4
Training by text message. Key metrics slide, public version with redacted figures.
Arist deck, slide 4. Exact stored slide matched to this analysis.
Our analysis: The simplest correct pattern when all figures share a date.
Evidence and limitation: One date in the title covers nine metrics; growth windows defined per bullet.
What a founder can adapt: Check every figure uses that date; date any that don't.
Supporting analysis
What the deck claims: "Key metrics as of Jan. 2022"; "Last 12 months CMGR"; "Last 3 months CMGR".
Presentation choice: Shows a title date doing the work for the whole slide.
When it does not fit: A title date over figures calculated on other windows.
What improved: Our illustrative rewrite of Mailage's line. Bracketed details are not stated on the slide.
The question this guide answers
This guide answers one founder question: how should I show when my traction figures were measured, so that the slide stays accurate after I send it?
Our footnotes and metric source line drafts cover where a figure comes from. Our cumulative-or-per-period draft covers what a chart is counting. Our bookings-vs-revenue draft covers which financial measure is shown. None makes the date of a figure its subject. A source line answers 'who says so'; a date answers 'when was this true'. The advice here is specific: where the date goes, how precise it should be, how to date comparisons and charts, and how to handle words like 'currently' and forward targets.
The question matters most for early-stage decks, where numbers change quickly and the deck is often sent to many investors over several months.
How we chose and read the examples
We searched extracted slide text for dated phrases such as 'as of [month] [year]' near traction terms (users, customers, MRR, revenue), and for undated phrases such as 'currently have' and 'today we have'. Most dated matches came from listed companies, whose dating follows securities rules; we excluded those, along with funds and mining and bank presentations. We kept four startup slides: a date in the title, a date in the headline with a dated chart, a date in a footnote, and no date.
Each slide was rendered from the source deck and read at full size. Quotes are exact. Arist's deck is a public version with figures replaced by '[REDACTED]' and 'XX%'; we discuss only how it dates them. We did not check any figure against outside sources.
Why a date matters
It tells the reader how current the number is. A figure from three months ago in a fast-growing company may understate where the company is now; one from a year ago may overstate it if growth has stalled. Without a date, the reader can't tell which.
It lets the reader compare. Investors put figures from one deck next to figures from the data room, a later update or a call. A date makes those comparisons possible; without one, a lower number later on looks like a decline even if it measures a different month.
It makes forward targets meaningful. 'Next 3 months: 500 users' is a plan only if the reader knows when the three months start.
It protects the founder. A deck sent in March and reread in June will be judged against what the investor knows in June. A dated figure is accurate for its date; an undated 'currently' looks wrong.
One date in the title: Arist
Arist, which delivers training through text messages, has a slide whose only heading is 'Key metrics as of Jan. 2022'. Below it are nine bullets: MRR, 'Last 12 months CMGR', 'Last 3 months CMGR', LTV:CAC, LTV, CAC, gross margin, monthly churn and average sales cycle. In this public version the figures are redacted, but the structure is visible.
Putting the date in the title is the simplest approach when every figure shares it. The reader learns the date before reading any number, and no single bullet needs its own date. The growth bullets also define their own windows ('Last 12 months', 'Last 3 months'), which together with the title tell the reader exactly which months are covered.
The limit of this approach is that it only works if every figure really is from January 2022. Measures such as LTV and churn are often calculated over a longer window; if any figure uses a different period, the title date would be misleading for that line. The founder version presumably held real figures; the lesson stands either way.
A dated headline over a dated chart: HomeRoots Insights
HomeRoots Insights' slide is headed 'We released a Shopify app subscription to existing customers'. The line beneath reads 'As of Jan 2024, these subscriptions yielded $3.5K Subscription MRR', followed by a plus sign and a line chart titled 'Monthly Revenue from products sales', with points dated 3/1/2023 to 1/1/2024. The line rises from under $10,000 to close to $60,000 at the last point, by our reading of the axis.
The headline date and the chart's last point agree, so the reader can see that the subscription figure and the product-sales chart describe the same moment. Dating each point on the x-axis is also good practice: the reader never has to guess which months the chart covers.
Two questions remain. First, the last point is labelled 1/1/2024. If that point is January's revenue and the deck was written during January, the month may be partial or projected; if it is December's revenue recorded on the first of the month, the label is misleading. The slide doesn't say which, and the last point carries most of the visual story — the jump from about $25,000 to close to $60,000. Second, 'yielded' could mean MRR at the end of January or MRR reached at some point in it. A note such as 'January 2024, full month' or 'month to date, 20 January' would answer both.
A date in a footnote: Bukalapak
Bukalapak, the Indonesian marketplace, has a slide headed 'and outpacing other ecommerce sites'. A bar chart labelled 'Pageview / user' shows Bukalapak at 21 against 'Ecommerce 1' at 12, 'Ecommerce 2' at 8 and 'Ecommerce 3' at 5. A banner reads 'Users are willing to spend longer time in bukalapak.com'. In small type at the bottom: 'Note: as of March 2011' and 'Source: Google analytics, Alexa'.
Comparisons need dates more than single figures do, because both sides change. Bukalapak's note tells the reader that all four bars describe March 2011, so the comparison is like for like. Placing the date next to the source is efficient: one line answers when and where.
The weakness is placement. The date is the smallest text on the slide, below a full-width banner. A reader who skims sees the bars and the claim but not the month. It also isn't clear whether 'March 2011' means a full month's data or a snapshot; pages per user over a month and on a single day can differ. Moving the date into the chart label ('Pageviews per user, March 2011') would keep it with the numbers.
No date at all: Mailage
Mailage, an email product, has a slide headed 'Milestones'. The first bullet reads 'Current Status : We currently have 110 Users, 5 integrations, 6000 beta signup queue.' The next two set targets: 'Next 1-3 months' (fix product issues, prepare a public beta, 500 users, 12+ integrations) and '6-8 months' (premium features, paid plans, 700 free users, 50 paid users, 20+ integrations).
The structure is sensible: where we are, then where we will be. The problem is that 'currently' and 'next 1-3 months' both float. A reader opening this deck later can't tell whether 110 users is recent, and can't tell when the 500-user target is due. If the deck was written in January and read in May, the reader can't tell whether the company is ahead of or behind its own plan.
Replacing 'Current Status' with 'Status, [month year]' and the relative periods with dates ('by [month year]') would turn the slide into a plan an investor could later check — which is also what makes hitting the targets worth something in the next conversation.
How to date your figures
Use month and year at minimum. A full date matters when figures move daily (signups, waitlists, downloads) or when the deck is sent close to a month end.
If every figure shares a date, put it in the slide title or a single line under it, as Arist does. If figures come from different dates, date each one beside the figure, not in a footnote.
Say what kind of figure it is. 'At end of March' (a balance, such as users or MRR) and 'in March' (a flow, such as revenue or signups) are different. On charts, say whether the last point is a complete period.
Date comparisons and their sources together. A comparison with a competitor or market figure needs the same date on both sides, or a note that they differ.
Remove floating words. 'Currently', 'today', 'to date' and 'recently' all need a date beside them, or should be replaced by one. Forward targets should be dated too: 'by June 2026', not 'in the next quarter'.
Keep a habit: before each send, update every dated figure and its date together. If you can't update a figure, leave its old date; a dated old number is honest, an undated one is not.
Templates
Title date: 'Key metrics, [month year]'.
Single figure: '[figure] [measure] as of [date] ([end of period / in period])'.
Plan: 'Status, [month year]: [figures]. By [month year]: [targets].'
What these examples can and cannot show
These four slides show how founders have dated, or not dated, traction figures. They can't show whether the figures were accurate, whether they were current when the decks were sent, or how investors responded. Chart readings for HomeRoots Insights are our estimates from the axis. Arist's figures are redacted in the public version.
Treat them as patterns of presentation. Arist's title date and HomeRoots' dated chart axis are easy to copy. Bukalapak shows a correct date in a place readers may miss. Mailage shows how a sensible status-and-plan slide loses its value without dates.
Common mistakes
Floating 'currently'. A present-tense figure with no date.
Undated targets. 'Next 3 months' with no start point.
Hidden date. The date in the smallest text on the slide.
Partial last period. A final chart point that may not be a full month.
Mixed dates, one label. A title date over figures from different periods.
Diagnostic checklist
Every figure has a month and year.
Shared date in the title; mixed dates beside figures.
Balances and flows labelled.
Last chart period marked complete or to date.
Targets dated.
Frequently asked questions
Won't an old date make my numbers look stale?
Less than an undated number that turns out to be old. If the date is old, update the figure; if you can't, the date keeps it honest.
Do I need a date on every slide?
On every slide with a figure that changes. Market sizes and other outside figures need the date of their source, which footnotes usually cover.
How we chose these examples
Corpus: published pitch deck teardowns on StartupFundraising.com. Founder-uploaded private decks are excluded.
Selection (2026-10-01): we searched extracted slide text for dated and undated traction phrases, excluded listed companies, funds, mining and bank presentations, and kept four startup slides each dating figures differently.
Review: the four slides were rendered from the source decks on 2026-10-01 and read in full at full size against company, deck and page number (editorial model review, with AI assistance in drafting; not human-reviewed). Chart readings are estimates from the axis. No figure was checked against outside sources.