Contract Length on a Pitch Deck: Show What Is Committed
Contract length tells investors how much revenue is locked in, but only if you say whether it is the signed term, how it is paid and what happens at renewal.
Contract Length on a Pitch Deck: Show What Is Committed, Not What You Hope Customers Stay
Many business-model and unit-economics slides include a line such as 'average contract length: 2 years'. It looks like a simple fact, but investors read it as an answer to a harder question: how much of your future revenue is already promised, and how much depends on customers choosing to stay? This guide uses four real slides to show what a contract-length figure can prove, the common way it gets stretched into a lifetime-value claim, and how to present it so it holds up.
TL;DR
Show contract length as the signed term of your contracts, and say three more things next to it: how customers pay (monthly, annually or upfront), whether they can cancel before the term ends, and what share renew when it does. Alphin does the first step well: '12 months average initial contract term, thereafter renewals' separates the committed part from the hoped-for part. BusRight gives a 2.7-year contract length and says customers prefer three-year contracts, but not how many customers that covers. Evvnt multiplies a two-year contract length by annual revenue to get lifetime value, which treats a contract term as a customer lifetime and uses revenue instead of gross profit. Jus Mundi mentions 1-to-5-year subscriptions with an upfront payment, the cash detail investors want, but hides the figures. Never use contract length as a stand-in for retention.
Four slides that state a contract length
Each slide is read at full size. Quotes are exact unless marked as hard to read.
BusRight business model slide — slide 8
School transportation software. Five-tile go-to-market slide.
BusRight deck, slide 8. Exact stored slide matched to this analysis.
Our analysis: Pairs a short sale with a long commitment; the average alone can't show how many customers are on long terms.
Evidence and limitation: Average contract length and a stated customer preference. No count of contracts, billing terms, cancellation rights or renewals.
What a founder can adapt: Add the share of customers on each term and how they are billed.
Supporting analysis
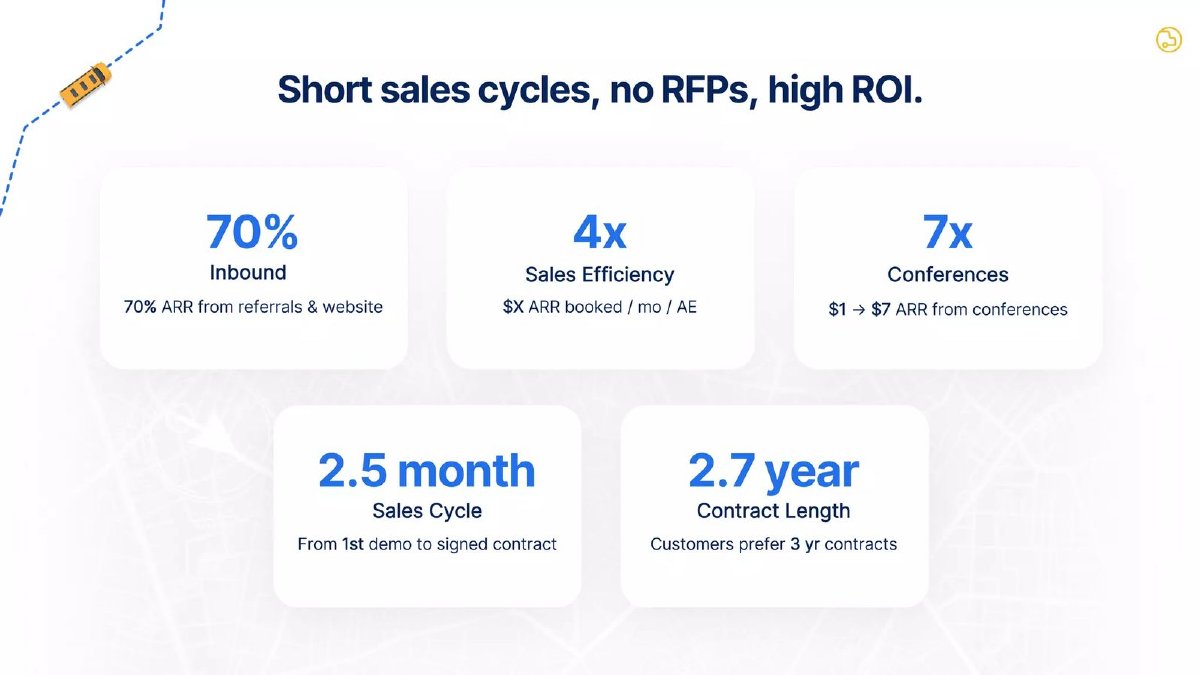
What the deck claims: "Short sales cycles, no RFPs, high ROI." Tiles include "2.5 month Sales Cycle — From 1st demo to signed contract" and "2.7 year Contract Length — Customers prefer 3 yr contracts".
Presentation choice: Shows contract length used well as part of a sales-efficiency argument.
When it does not fit: An average with no count behind it.
Marketing services for local small businesses. Booked MRR chart with three side figures.
Alphin deck, slide 10. Exact stored slide matched to this analysis.
Our analysis: The clearest wording of the four: commitment is stated as commitment.
Evidence and limitation: Initial term separated from renewal; dated source line. No renewal rate.
What a founder can adapt: Add the renewal rate, or the date the first renewals fall due.
Supporting analysis
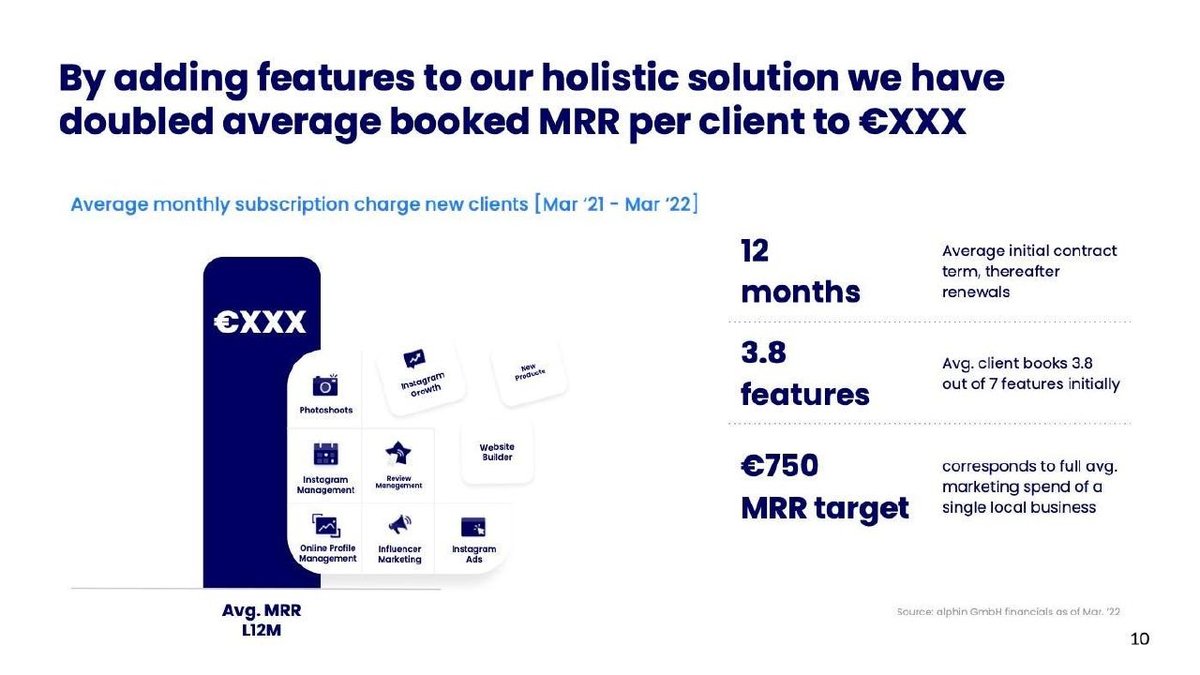
What the deck claims: "12 months — Average initial contract term, thereafter renewals". "Avg. client books 3.8 out of 7 features initially". "Source: alphin GmbH financials as of Mar. '22".
Presentation choice: Shows how to describe a term without overstating it.
When it does not fit: Calling the initial term a customer lifetime.
Evvnt deck, slide 10. Exact stored slide matched to this analysis.
Our analysis: Contract term used as customer lifetime, on revenue rather than gross profit; no renewal data.
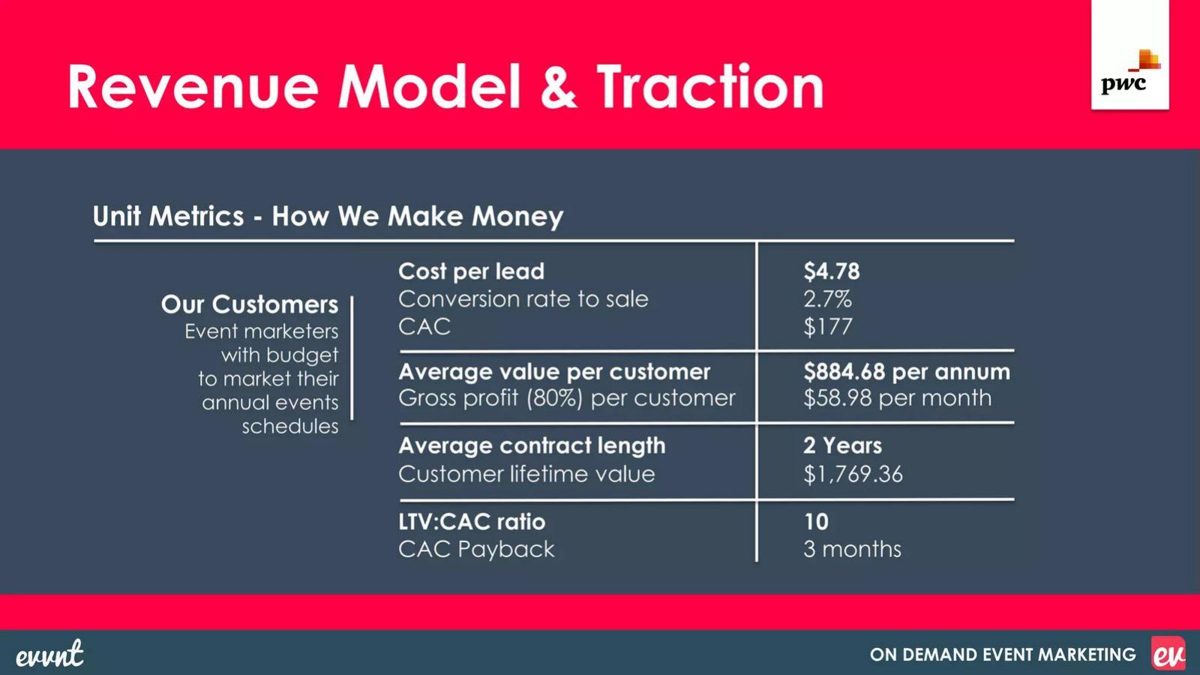
Evidence and limitation: Lifetime value equals annual revenue times contract length ($884.68 x 2). On a gross-profit basis it would be about $1,415 and LTV to CAC about 8 (our calculation from the slide's figures).
What a founder can adapt: Base lifetime on retention and gross profit; show contract term separately.
Supporting analysis
What the deck claims: "Average value per customer $884.68 per annum"; "Gross profit (80%) per customer $58.98 per month"; "Average contract length 2 Years"; "Customer lifetime value $1,769.36"; "LTV:CAC ratio 10"; "CAC Payback 3 months"; CAC $177.
Presentation choice: Shows the most common way contract length is stretched into a value claim.
When it does not fit: Multiplying revenue by contract length and calling it lifetime value.
Legal research platform. Profitability slide with redacted CAC, ACV and CLV.
Jus Mundi deck, slide 10. Exact stored slide matched to this analysis.
Our analysis: Names the right details (term range, cash timing) but the long-term claim rests on an assumption.
Evidence and limitation: Range of terms and an upfront payment named; figures redacted; lifetime value labelled as resting on a churn hypothesis.
What a founder can adapt: If you redact amounts, keep percentages: share of customers on each term and share paying upfront.
Supporting analysis
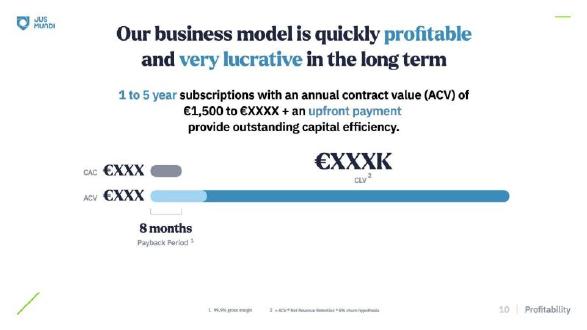
What the deck claims: "1 to 5 year subscriptions with an annual contract value (ACV) of €1,500 to €XXXX + an upfront payment provide outstanding capital efficiency." "8 months Payback Period". Footnotes, hard to read on the source, appear to say "99,9% gross margin" and "= ACV * Net Revenue Retention * 5% churn hypothesis".
Presentation choice: Shows the payment detail that makes a contract term matter for cash.
When it does not fit: A lifetime value formula that the reader can't reproduce.
Contract length is the signed term, not how long you expect customers to stay.
Say how the contract is paid: monthly, annually in advance or upfront for the full term.
Say whether customers can cancel early.
Show renewals separately; they are the real test.
Don't multiply contract length by revenue and call it lifetime value.
Give the spread or the share of customers on each term, not only an average.
Write your contract-length line
Fill this in before you put a contract figure on a slide.
Term. What initial term do customers sign, and what share are on each term length?
Payment. Do they pay monthly, annually in advance or upfront for the full term?
Cancellation. Can customers end the contract early, for example at a budget year?
Renewal. How many contracts have reached renewal, and how many renewed? If none, when are the first due?
Value. If you show lifetime value, what retention and gross margin is it based on?
Copyable framework: "Initial term: [N] months ([X]% of customers on [longer term]). Billed [annually in advance/upfront]. [No early termination / Terminable at budget year]. Renewals to date: [A] of [B]."
Illustrative example 1 — written by us
Before: "Average contract length 2 Years. Customer lifetime value $1,769.36."
After: "Initial term: 2 years, billed [annually]. Renewals to date: [A] of [B]. Lifetime value on 80% gross margin and [observed] retention: $[X]."
What improved: Our illustrative rewrite of Evvnt's lines. Bracketed details are left blank because the slide doesn't give them.
The question this guide answers
This guide answers one founder question: how should I present contract length on a pitch deck so investors know what it does and doesn't prove?
Our LTV-to-CAC and payback guides cover how to calculate customer value and how fast you earn back acquisition cost. Our churn and net revenue retention guides cover what happens after customers are in. Our sales cycle guide covers how long it takes to sign. None of them makes the contract term itself the subject, and the advice differs. Contract length sits between those topics: it is evidence of commitment that founders often present as evidence of retention, and that gap is where investors find problems.
The question matters most for business software, services sold to institutions such as schools or hospitals, and any company whose customers sign for a fixed period. For monthly subscriptions with no term, the honest contract length is one month, and retention data does all the work.
How we chose and read the examples
We searched extracted slide text across the library for phrases such as 'contract length', 'contract term', 'multi-year contracts' and 'annual contracts'. Many matches came from listed companies or large energy and infrastructure firms, which we excluded, along with decks from companies that went public through a SPAC. We kept four startup slides that each state a contract term and use it differently: BusRight, Alphin, Evvnt and Jus Mundi. All four companies were private when the decks were made.
Each slide was rendered from the source deck and read at full size. Jus Mundi's footnotes are very small and the source scan is low resolution, so we enlarged them at 400 dpi; we quote them as they appear to read and flag that. We checked the arithmetic on Evvnt's slide. We did not check any figure against company accounts or contracts.
We also looked at Athennian, whose table lists 'Avg. Contract Length (yrs)' but with every value redacted. It shows that the metric is one founders consider worth tracking, but there is nothing to analyse, so it isn't an example here.
What contract length can and cannot prove
A signed contract term proves that, for that period, the customer has agreed to pay, subject to whatever cancellation rights the contract gives them. That is useful. It means revenue for the term is more predictable than month-to-month revenue, and it can mean less effort spent keeping customers in the short run.
It doesn't prove three things investors care about. First, it doesn't prove customers will stay after the term ends. A two-year contract followed by 50% non-renewal is a worse business than a monthly product with 95% annual retention. Second, it doesn't prove the money has arrived. A three-year contract billed monthly is three years of promises; the same contract paid upfront is cash in the bank. Third, it doesn't prove the contract is binding. Many software contracts, especially with public-sector buyers, allow cancellation for convenience or depend on annual budget approval.
So a contract-length figure should be read, and presented, as one part of a three-part picture: the committed term, how it is paid, and what happens at renewal.
Commitment as part of a sales story: BusRight
BusRight sells software to school transportation departments. Its slide, headed 'Short sales cycles, no RFPs, high ROI.', has five tiles: 70% of ARR from referrals and its website, '4x Sales Efficiency' with '$X ARR booked / mo / AE', '7x' return from conferences ('$1 → $7 ARR from conferences'), a 2.5-month sales cycle 'From 1st demo to signed contract', and a 2.7-year contract length with the note 'Customers prefer 3 yr contracts'.
Putting contract length beside sales cycle is a sensible pairing. A short sale followed by a long commitment is the combination investors want in a market such as school districts, where buying is usually slow. The note that customers prefer three-year terms adds a qualitative signal: the buyer is choosing the longer term, not having it imposed.
What the tile leaves out is what turns the number into evidence. An average of 2.7 years could mean most customers are on three-year terms and a few are on one-year terms, or it could be pulled up by a handful of large contracts. The slide doesn't say how many contracts are behind it, whether school contracts can be ended at the annual budget cycle, or whether customers pay yearly or upfront. And because the company is young relative to a three-year term, few contracts can have reached renewal yet. A line such as 'X of Y customers on 3-year terms; billed annually; Z renewals to date, all renewed' would make the tile carry its full weight.
Committed term and renewal kept apart: Alphin
Alphin sells marketing services to local small businesses. Its slide is headed 'By adding features to our holistic solution we have doubled average booked MRR per client to €XXX', with the amount redacted. On the right, three figures: '12 months — Average initial contract term, thereafter renewals'; '3.8 features — Avg. client books 3.8 out of 7 features initially'; and '€750 MRR target — corresponds to full avg. marketing spend of a single local business'. A source line reads 'Source: alphin GmbH financials as of Mar. '22', and the chart is labelled 'Average monthly subscription charge new clients [Mar '21 - Mar '22]'.
The wording 'initial contract term, thereafter renewals' is the most careful phrasing among the four examples. It tells the investor that 12 months is the committed part and that everything after depends on renewal. It doesn't pretend the 12 months is a lifetime. The dated source line also tells the reader where the number comes from.
The missing piece is the renewal rate. With a deck dated around March 2022 and a chart starting March 2021, the first cohort of 12-month contracts would just be reaching renewal, so the company may not yet have had a meaningful renewal figure. If so, saying that directly ('first renewals due Q2 2022') is better than leaving the gap. For small-business customers, who close and switch providers often, investors will want the renewal number as soon as it exists.
Contract length used as lifetime: Evvnt
Evvnt sells event marketing. Its 'Revenue Model & Traction' slide has a table under 'Unit Metrics - How We Make Money': cost per lead $4.78, conversion rate to sale 2.7%, CAC $177; average value per customer $884.68 per annum, gross profit (80%) per customer $58.98 per month; average contract length 2 years, customer lifetime value $1,769.36; LTV:CAC ratio 10, CAC payback 3 months.
The arithmetic is consistent. $884.68 a year times 2 years is exactly $1,769.36. $1,769.36 divided by $177 is 10.0. 80% of $884.68 is $707.74 a year, or $58.98 a month, and $177 divided by $58.98 is 3.0 months. So every figure follows from the ones above it.
The problem is the method, and it is a common one. Lifetime value here is simply annual revenue multiplied by contract length. That makes two assumptions the slide doesn't state: that every customer stays exactly the contract term and no longer or shorter, and that revenue, not gross profit, is the right measure of value. The slide itself gives an 80% gross margin, so on its own figures a gross-profit lifetime value would be about $1,415 (two years of $707.74), and LTV to CAC would be about 8 rather than 10. That is still a healthy ratio, which is the point: using the more conservative method would have cost the slide little and removed an easy objection.
The bigger issue is that the contract term carries the whole calculation. If, say, a quarter of customers left before two years, or customers could cancel at any time, lifetime value would be lower. If most renewed, it would be higher. The slide gives no renewal or churn figure, so neither direction can be tested. Contract length is doing the job that retention data should do.
Term and upfront payment mentioned, figures hidden: Jus Mundi
Jus Mundi sells a legal research platform. Its slide, headed 'Our business model is quickly profitable and very lucrative in the long term', states: '1 to 5 year subscriptions with an annual contract value (ACV) of €1,500 to €XXXX + an upfront payment provide outstanding capital efficiency.' Below, a bar diagram labels CAC €XXX, ACV €XXX and CLV €XXXK, with '8 months Payback Period'. Footnotes, which are tiny on the source, appear to read '1 99,9% gross margin' and '2 = ACV * Net Revenue Retention * 5% churn hypothesis'.
This slide names two things the others leave out. It gives the range of terms, one to five years, instead of a single average. And it mentions an upfront payment, which is what turns a contract into cash early and supports the capital-efficiency claim in the headline. Those are the details an investor would ask for first.
But the figures that would let an investor use them are redacted, and the lifetime-value footnote raises a question. A customer lifetime value is usually ACV times gross margin divided by the churn rate, so a 5% churn assumption implies about 20 years of customer life. The footnote, as it appears to read, multiplies by churn instead and also by net revenue retention, which already includes churn. Whatever the exact formula, a lifetime value resting on an assumed churn rate is a hypothesis, which the footnote honestly calls it. The slide is clearer about this than Evvnt's, but the long-term claim in the headline still rests on an assumption rather than on renewals.
If you redact figures in a shared deck, keep the structure that matters: the share of customers on each term length and the share paying upfront can be shown as percentages without revealing revenue.
How to present contract length on your deck
Use the right words. 'Initial contract term' or 'committed term' signals that you know the difference between commitment and retention. 'Customer lifetime' does not belong next to a contract figure unless you have renewal data behind it.
Give the spread, not just the average. 'Terms: 1 year (30% of customers), 3 years (70%)' tells an investor much more than '2.4-year average'. If a few large contracts skew the average, say so.
State how customers pay. Monthly, annually in advance, or upfront for the full term. Upfront or annual-in-advance billing is a real advantage for a cash-hungry startup and deserves its own line.
Say whether contracts can be cancelled. If public-sector customers can end contracts at each budget year, the effective commitment is one year, whatever the paper term says. Investors will find this in due diligence; saying it first builds trust.
Show renewals as soon as you have them. Even 'first 12 renewals: 11 renewed' is strong evidence. If no contracts have reached renewal yet, say when the first ones will.
If you calculate lifetime value, show the method. Use gross profit rather than revenue, base the customer life on observed retention or a stated assumption, and label assumptions as assumptions. Don't let the contract term stand in for both.
Where contract length belongs in the deck
Contract terms usually fit on the business-model slide, where they explain how you charge, or on the unit-economics slide, where they feed payback and lifetime value. BusRight's pairing with sales cycle on a go-to-market slide also works, because it shows the ratio of selling effort to committed revenue.
Wherever it goes, keep the contract figure next to the renewal or retention figure, or a note saying none exists yet. Separated, they invite the reader to assume the best.
What these examples can and cannot show
These four slides show how founders have presented contract terms. They cannot show whether those terms were binding, how many contracts were behind each average, or whether customers renewed. We did not see any of the contracts, and we did not check any figure against company accounts. Our calculations for Evvnt use only numbers printed on its slide.
Treat the examples as patterns of presentation. The most useful one, Alphin's separation of initial term from renewal, costs nothing to copy.
Common mistakes
Term as lifetime. A contract term is a commitment, not proof customers stay.
Revenue as value. Lifetime value should use gross profit.
Average only. Show how many customers are on each term.
Payment left out. Upfront or annual billing is a cash advantage; say so.
Renewals missing. Show them, or say when the first are due.
Diagnostic checklist
Initial term, labelled as such.
Share of customers on each term.
How customers are billed.
Early cancellation rights.
Renewals to date or first renewal date.
Lifetime value method stated, on gross profit.
Frequently asked questions
Should I push customers to longer contracts before fundraising?
Only if it suits them. A long term won through heavy discounts or easy exit clauses adds little, and investors will ask about both in due diligence.
What if my customers pay monthly with no term?
Say so and lead with retention. A strong monthly retention curve is more convincing than a contract figure.
How we chose these examples
Corpus: published pitch deck teardowns on StartupFundraising.com. Founder-uploaded private decks are excluded.
Selection (2026-10-01): we searched extracted slide text for contract-term phrases ('contract length', 'contract term', 'multi-year contracts', 'annual contracts'), excluded listed-company, SPAC and large energy or infrastructure presentations, and kept four startup slides that state a contract term and use it differently. Athennian was reviewed but excluded because every value is redacted.
Review: the four slides were rendered from the source decks at full size on 2026-10-01 and read in full against company, deck and page number (editorial model review, with AI assistance in drafting; not human-reviewed). Jus Mundi's footnotes were enlarged at 400 dpi and are quoted as they appear to read. Evvnt's arithmetic was recalculated from the slide's own figures. No figure was checked against company accounts or contracts.