Growing by Acquisition: How to Pitch a Roll-Up Strategy
If buying other companies is part of your growth plan, investors need the purchase price, a closed deal, the pipeline and how much of the forecast is bought.
Growing by Acquisition: How to Show a Roll-Up Plan on Your Pitch Deck
Seven slides from three decks whose growth plans include buying other companies: Olsam, which buys Amazon sellers; Clockwork, which planned to buy staffing agencies alongside its own app; and rDempt, a Startup Weekend team that floated buying its competitors. For each, we record what the slide proves about price, deal flow and the share of growth that would be bought, and what it leaves for an investor to ask.
TL;DR
When acquisitions are part of the plan, investors stop asking only "will customers buy this?" and start asking "can this team buy businesses cheaply, run them better and keep doing it?" A roll-up slide needs four things: the price you pay (a multiple of a named profit or revenue measure), proof from at least one closed deal of what changed after you bought it, a pipeline with stages and a realistic pace, and a forecast that keeps bought growth separate from organic growth. The money you are raising should show how much goes to purchases.
Olsam's page 2 states the price gap ("valuations at entry (2.0-4.5x profits) vs exit at scale" of 10-20x) and its page 7 shows one closed deal, bought "for 3.2x SDE + earn-out". Clockwork's pages show the target universe (14,000 US agencies, 500 for sale at any time, 2-3x multiples), a pipeline ("6 deals identified and 2 are in signed purchase agreements"), a forecast that splits organic from "Roll-ups M/A", and a use-of-funds chart that sends $45M of a $50M raise to acquisitions. rDempt's page 20 names five competitors to buy but no price, no funding and no plan, which shows how little a roll-up idea proves on its own.
Roll-up and acquisition slides from real pitch decks
Each example records what the slide proves about price, deals and the share of growth that would be bought. "Our calculation" marks arithmetic we did; the slides don't state it.
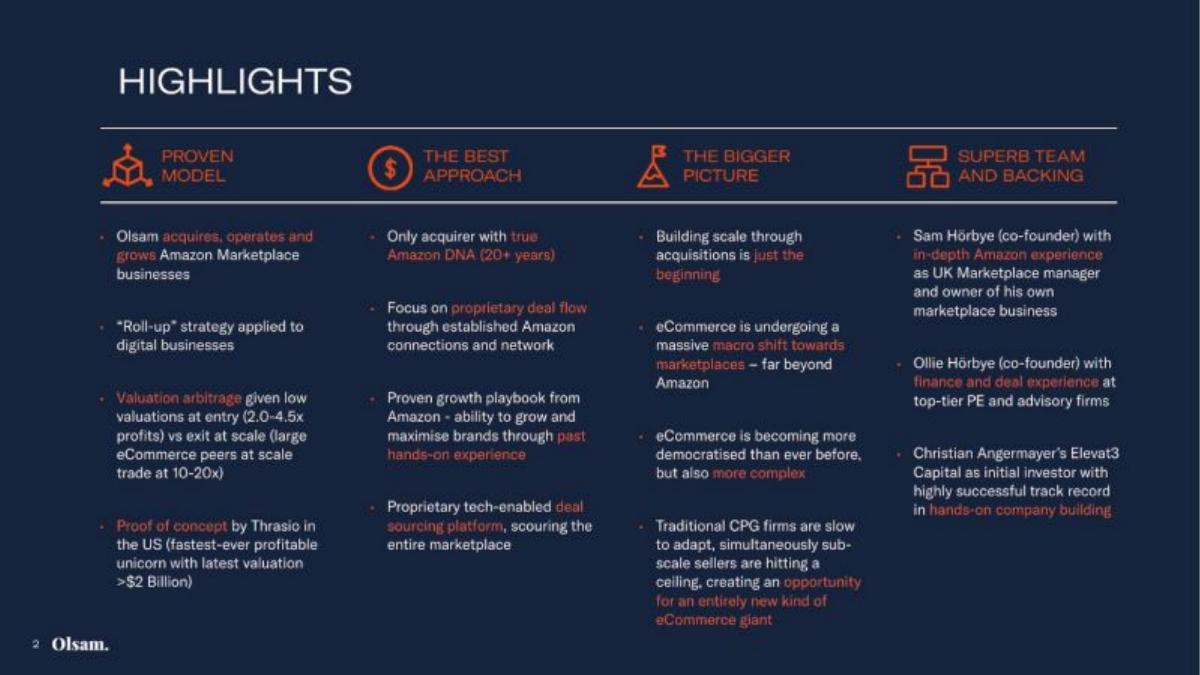
Olsam business model slide — slide 2
London buyer of Amazon Marketplace sellers. 2021 deck; highlights page.
Olsam deck, slide 2. Exact stored slide matched to this analysis.
Our analysis: States the price gap the whole plan depends on.
Evidence and limitation: Entry and exit multiples stated; "profits" undefined; exit multiple is from large peers, not achieved.
What a founder can adapt: Name the profit measure behind each multiple and source the exit figure.
Supporting analysis
What the deck claims: "Valuation arbitrage given low valuations at entry (2.0-4.5x profits) vs exit at scale (large eCommerce peers at scale trade at 10-20x)"; Thrasio cited as proof of concept; "Proprietary tech-enabled deal sourcing platform".
Presentation choice: Investors can see the size of the bet in one line.
When it does not fit: Don't present a peer valuation as your own exit.
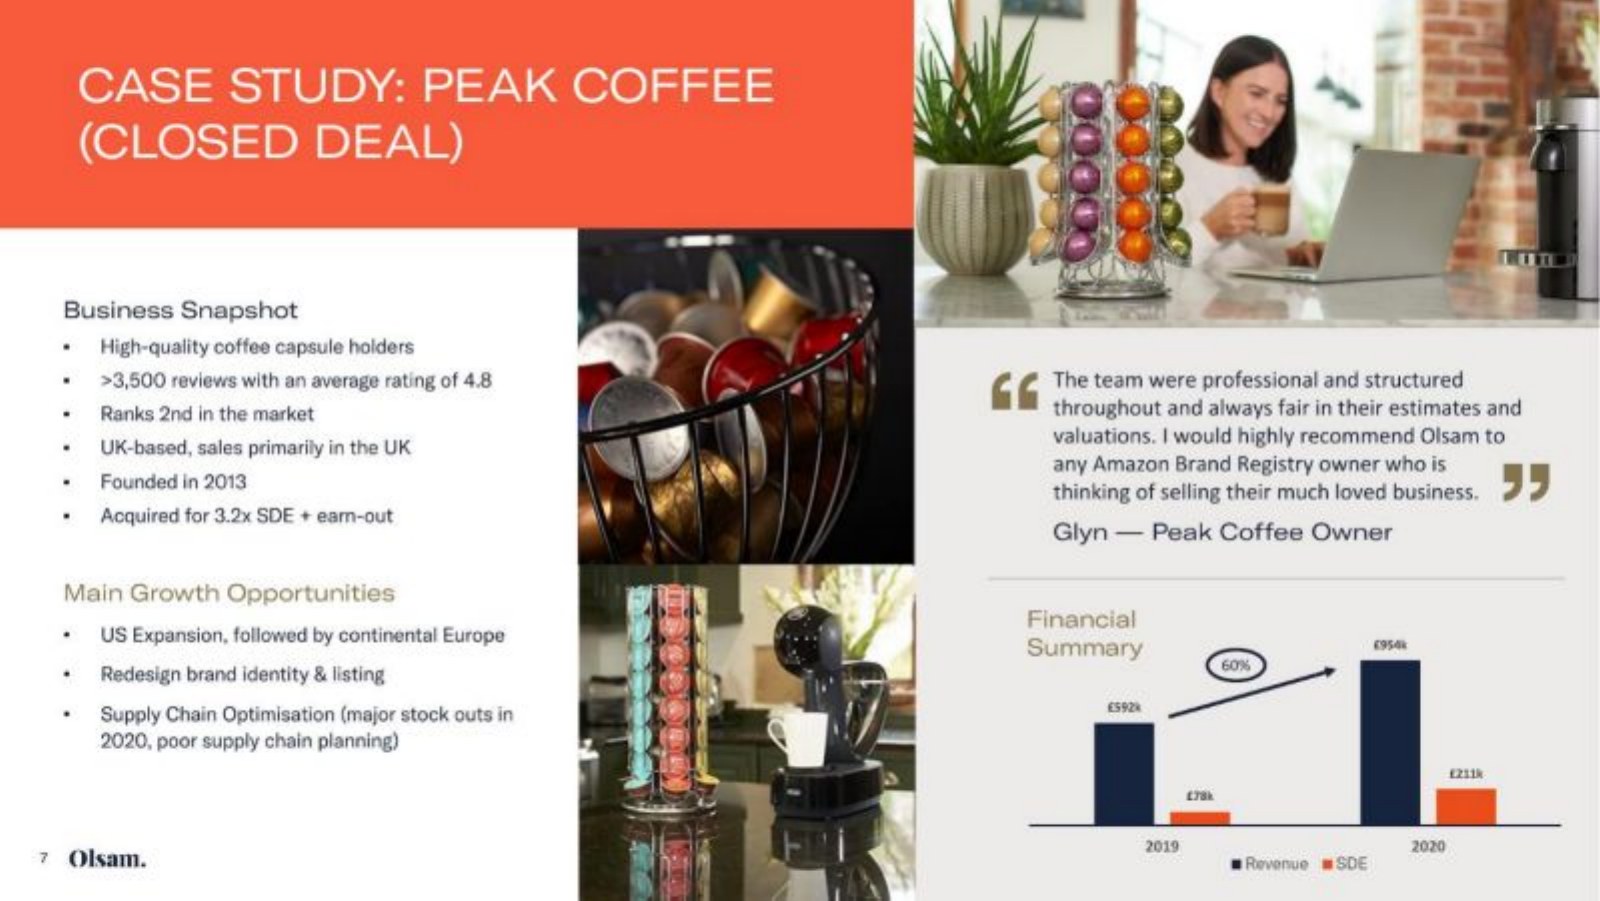
Olsam deck, slide 7. Exact stored slide matched to this analysis.
Our analysis: Real deal, real price, real structure.
Evidence and limitation: Our calculation: revenue up about 61%, SDE about 2.7 times. Purchase date and SDE year for the multiple not stated.
What a founder can adapt: Date the purchase and add a period after it.
Supporting analysis
What the deck claims: Peak Coffee "Acquired for 3.2x SDE + earn-out"; revenue £592k (2019) and £954k (2020), marked 60%; SDE £78k and £211k; growth plans and a seller quote.
Presentation choice: One closed deal is stronger evidence than any thesis.
When it does not fit: Don't let the seller's growth stand in for yours.
US and Latin American staffing platform. 2022 Series A deck; target market page.
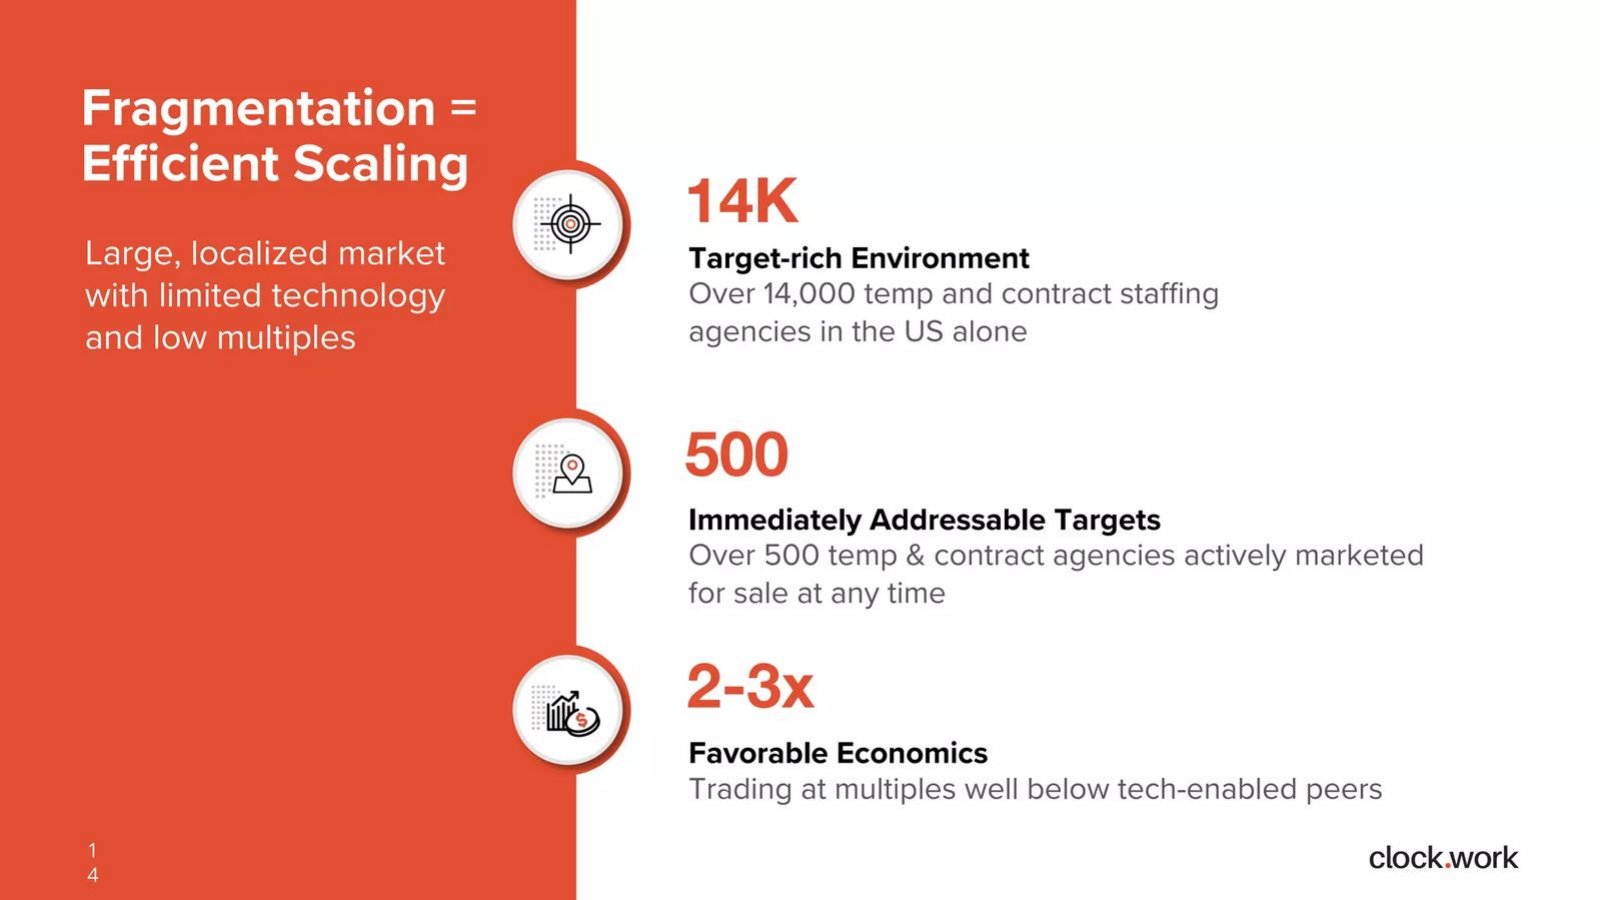
Clockwork deck, slide 15. Exact stored slide matched to this analysis.
Our analysis: Sizes what could be bought now, not just what exists.
Evidence and limitation: Counts and multiple stated without sources; multiple's base undefined.
What a founder can adapt: Source the counts and say what the 2-3x multiplies.
Supporting analysis
What the deck claims: "Over 14,000 temp and contract staffing agencies in the US alone"; "Over 500 temp & contract agencies actively marketed for sale at any time"; "2-3x Favorable Economics".
Presentation choice: "For sale at any time" is the useful number.
When it does not fit: Don't leave the multiple without a base.
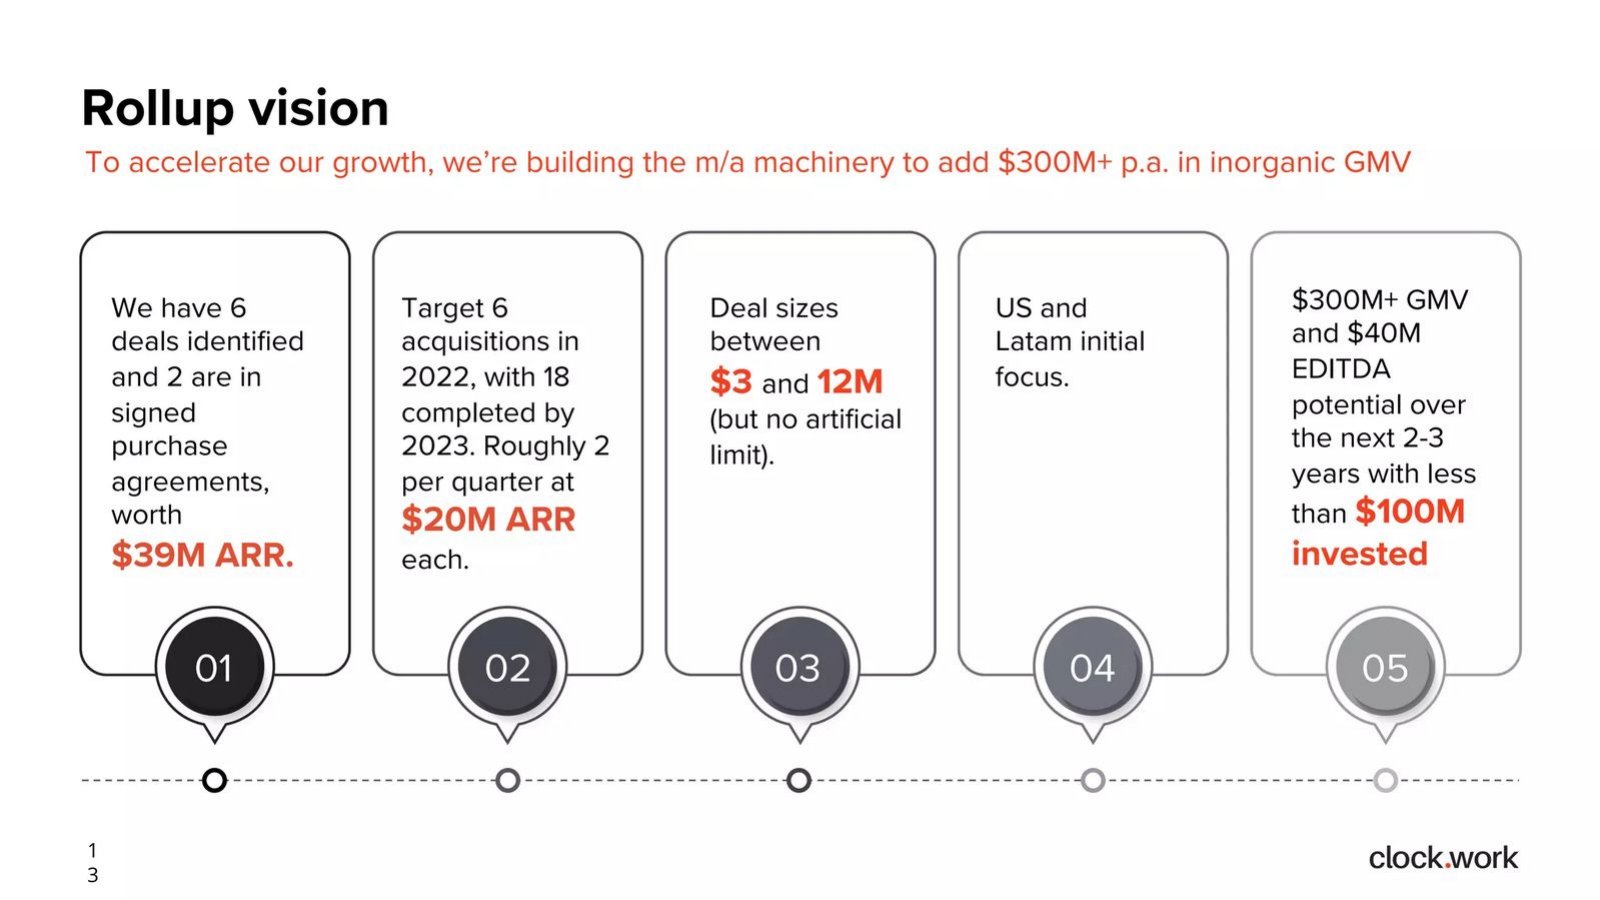
Clockwork deck, slide 14. Exact stored slide matched to this analysis.
Our analysis: A real pipeline with stages, but inconsistent units.
Evidence and limitation: Stages, pace and size given. Our calculation: 6 x $20M = $120M ARR, which doesn't match the page 9 roll-up line. Units mix ARR, GMV and EBITDA.
What a founder can adapt: Use one unit and give expected closing dates.
Supporting analysis
What the deck claims: "We have 6 deals identified and 2 are in signed purchase agreements, worth $39M ARR"; "Target 6 acquisitions in 2022, with 18 completed by 2023. Roughly 2 per quarter at $20M ARR each"; deal sizes $3-12M.
Presentation choice: Investors can test pace against capacity.
When it does not fit: Don't treat signed agreements as completed deals.
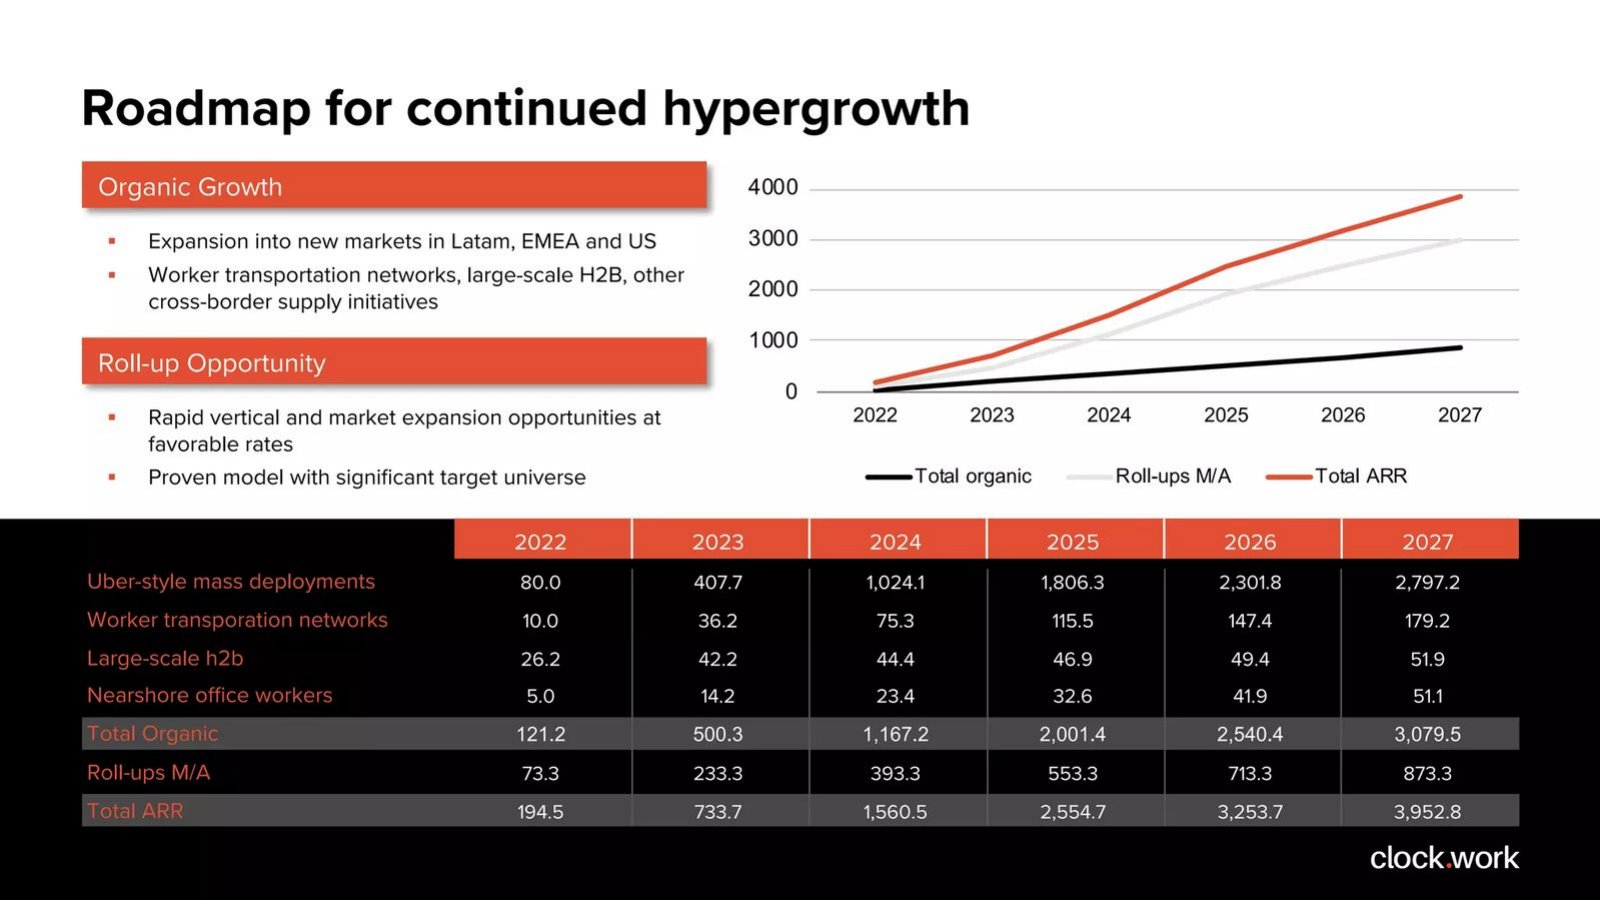
Same deck. Forecast page splitting organic and acquired growth.
Clockwork deck, slide 9. Exact stored slide matched to this analysis.
Our analysis: The right structure, with a chart error.
Evidence and limitation: Our calculation: acquisitions about 38% of 2022 ARR and 22% of 2027. Chart legend appears to swap the organic and roll-up lines.
What a founder can adapt: Print the unit and check the chart against the table.
Supporting analysis
What the deck claims: Table 2022-2027: "Total Organic" 121.2 to 3,079.5; "Roll-ups M/A" 73.3 to 873.3; "Total ARR" 194.5 to 3,952.8. No unit printed.
Presentation choice: Separate lines let investors judge each source of growth.
When it does not fit: Don't let a chart contradict its own table.
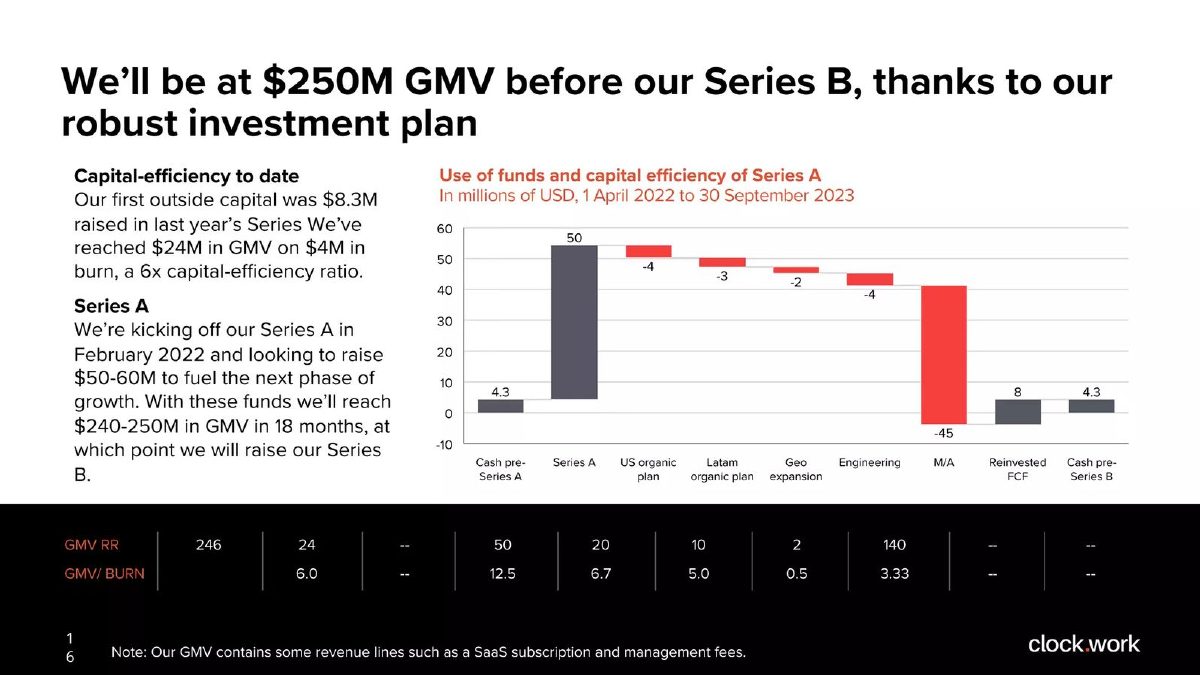
Same deck; numbered 16 on the slide. Use-of-funds waterfall.
Clockwork deck, slide 17. Exact stored slide matched to this analysis.
Our analysis: Shows the round is mainly an acquisition fund.
Evidence and limitation: Bars add up (our check). M/A is about 90% of the raise (our calculation). Printed M/A GMV/burn of 3.33 vs about 3.1 from 140 and 45.
What a founder can adapt: Say whether purchases also use debt or earn-outs.
Supporting analysis
What the deck claims: Cash 4.3, Series A 50, US organic -4, Latam organic -3, geographic expansion -2, engineering -4, "M/A" -45, reinvested free cash flow 8, ending cash 4.3 (USD millions, April 2022 to September 2023).
Presentation choice: Investors can price the round for what it really buys.
When it does not fit: Don't leave ratios that don't match their inputs.
QR-code lost-and-found service; Startup Weekend Lincoln deck.
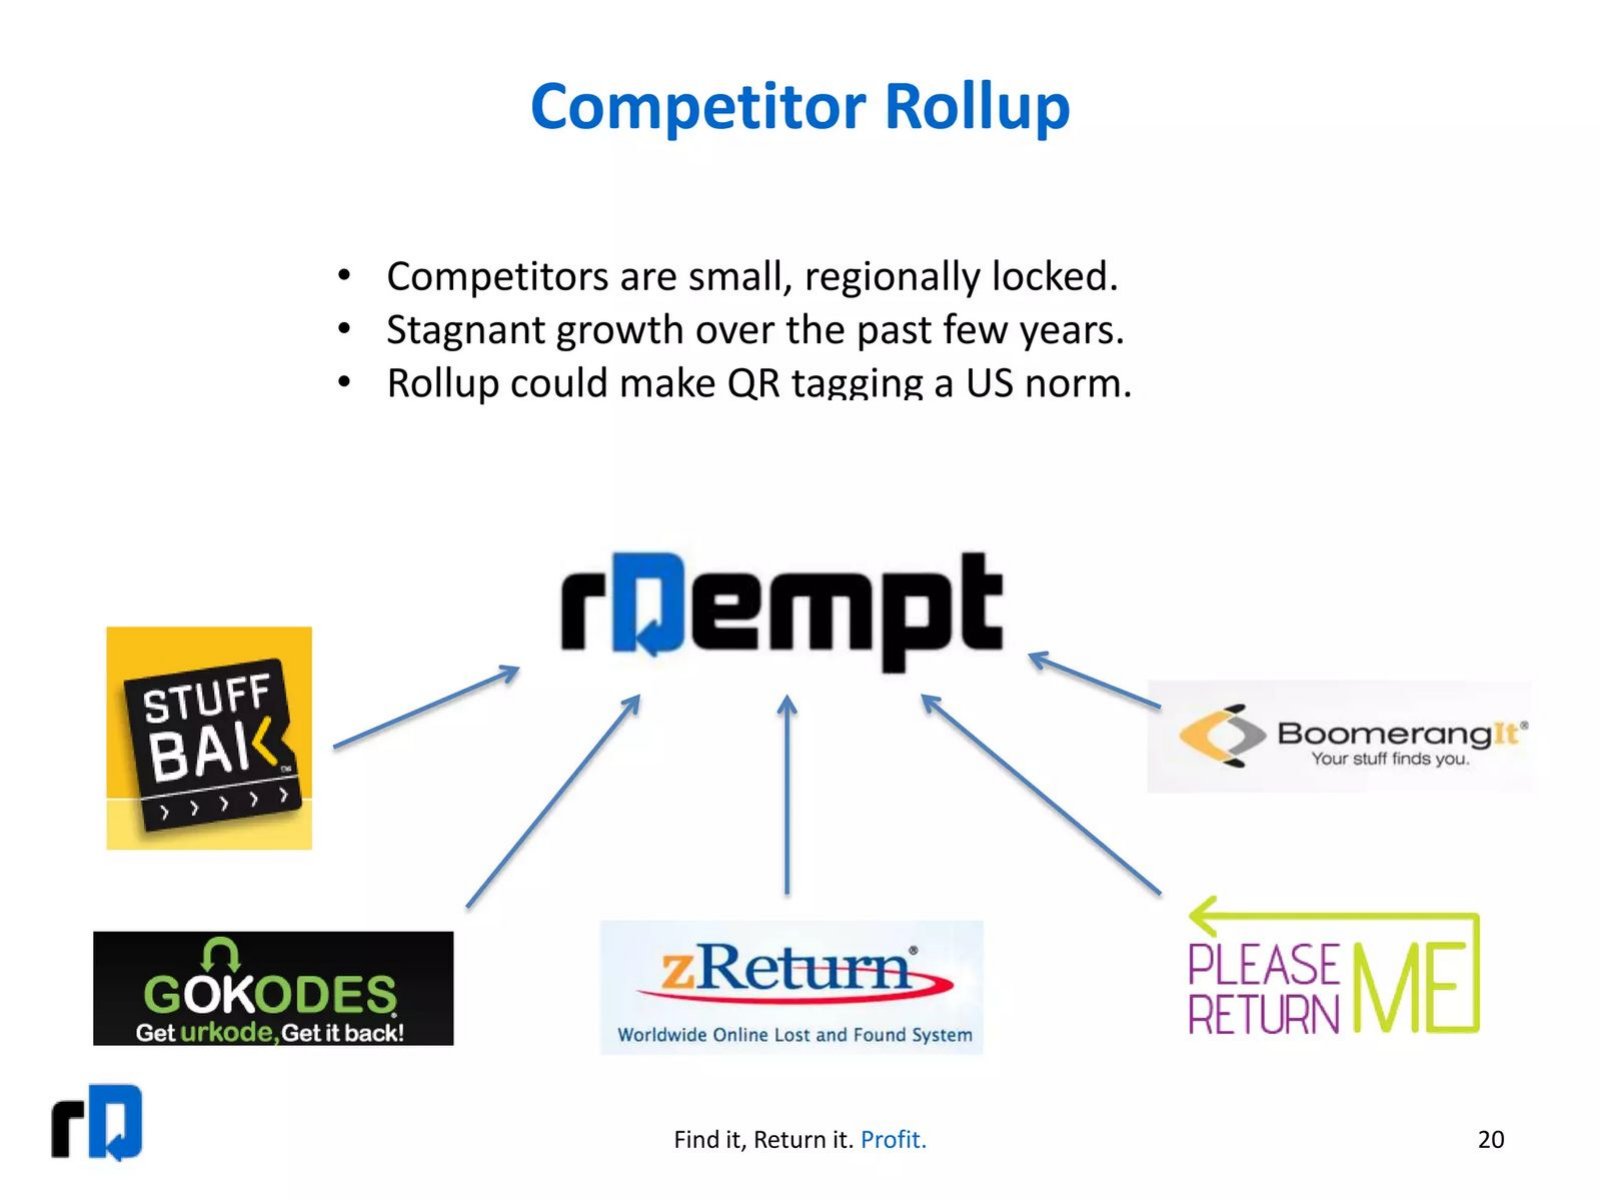
rDempt deck, slide 20. Exact stored slide matched to this analysis.
Our analysis: An idea, not yet a plan.
Evidence and limitation: No price, funding, seller interest or integration plan.
What a founder can adapt: Add the price, the funding and one target's interest.
Supporting analysis
What the deck claims: "Competitors are small, regionally locked." "Stagnant growth over the past few years." "Rollup could make QR tagging a US norm." Five competitor logos point to rDempt.
Presentation choice: Shows how little a roll-up claim proves on its own.
When it does not fit: Don't show logos with arrows as a strategy.
Columns report what each slide states or leaves out; checks are our calculations.
Example
Price or multiple
Closed deal
Pipeline or pace
Bought vs organic shown
Olsam p2
2.0-4.5x entry, 10-20x peers
No
No
No
Olsam p7
3.2x SDE + earn-out
Yes (Peak Coffee)
No
No
Clockwork p15
2-3x (base not stated)
No
500 for sale
No
Clockwork p14
Deal size $3-12M
No (2 signed)
About 2 a quarter
No
Clockwork p9
No
No
No
Yes (legend swapped)
Clockwork p17
No
No
No
$45M of $50M to M/A
rDempt p20
No
No
No
No
Key Takeaways
State the purchase multiple and what it multiplies. Olsam's page 7 says 3.2x SDE (seller's discretionary earnings) plus an earn-out.
Show one closed deal with before-and-after numbers. Olsam's Peak Coffee case gives revenue and SDE for 2019 and 2020.
Give the pipeline in stages. Clockwork says 6 deals identified, 2 under signed purchase agreements, worth $39M ARR.
Split bought growth from organic growth. Clockwork's table does; on its own figures acquisitions are about 38% of 2022 ARR (our calculation).
Check every chart against its table. Clockwork's chart legend appears to swap the organic and roll-up lines.
Show how much of the raise buys companies. Clockwork's page 16 sends $45M of $50M to M&A, about 90% (our calculation).
Build your acquisition plan
Fill in each line with your own figures, and keep the labels if the numbers are confidential.
Price. Multiple you pay, the measure it multiplies, and the source of any exit multiple.
Closed deal. Purchase date, price, structure, and results before and after.
Pipeline. Targets identified, in talks, signed and closed, with expected closing dates.
Pace. Deals per quarter you can buy and absorb, and why.
Forecast split. Organic and acquired lines, in one unit, for each year.
Funding. How much of the raise buys companies, and any debt or earn-outs.
Copyable framework: We buy [type of business] at [x]x [measure] (peers trade at [y]x, source [z]). Closed: [company], bought [date] for [price and structure]; [measure] went from [a] to [b] in [period] after purchase. Pipeline: [n] identified, [n] signed, [n] closed; target [n] a quarter. Forecast: [organic] organic and [acquired] acquired in [year]. [amount] of this round funds purchases.
Illustrative example 1 — written by us
Before: Roll-up strategy: consolidating a fragmented market at attractive multiples.
After: We buy regional agencies at 3x EBITDA. Closed: one agency, bought March for $2M cash plus $0.5M earn-out; EBITDA up from $0.6M to $0.8M in the 12 months after. Pipeline: 9 identified, 2 signed. $8M of this round funds purchases.
What improved: Our illustrative rewrite; figures are invented for the example. It names the multiple and its base, dates a closed deal with results after purchase, stages the pipeline and shows how the raise is used.
The question this guide answers
Some startups plan to grow partly or mainly by buying other businesses: small agencies, clinics, online shops or competitors. The strategy is usually called a roll-up or buy-and-build. It changes what an investor is underwriting. Instead of a product that customers adopt, the investor is backing a team's ability to find businesses, buy them at a sensible price, improve them and repeat the process faster than the money runs out.
Our existing guides don't answer how to present this. The use-of-funds guide covers how to split a raise, the comparable-exits guide covers what investors might earn when you are bought, and the organic-growth guide notes in passing that finance uses "organic" to mean growth without acquisitions. None explains what a slide must show when buying companies is how you plan to grow. That is this guide's question: what evidence makes an acquisition plan credible on a pitch deck, and how should it sit beside the rest of the forecast?
How we chose and read the examples
We searched the extracted text of the deck library for roll-up, buy-and-build, acquisition strategy, acquisition targets and similar phrases. Most matches came from listed companies, investment funds or decks that only used the words in passing, and we excluded them. A clinic group whose deck we read in full was dropped because it was already listed on a stock exchange when the deck was made. A gaming deck with an acquisition strand was dropped because its last page marks the material confidential.
Seven slides from three private companies remained: Olsam pages 2 and 7, Clockwork pages 9, 14, 15 and 17 (the deck's printed slide numbers run one lower than the file pages from page 14 on), and rDempt page 20. Every slide was rendered from the original deck file and read at full size; quotes are as printed. Olsam announced a $165 million equity and debt raise in August 2021. Clockwork's deck is titled as a 2022 Series A deck; we found no public record of whether the round closed, so we treat all its figures as the company's plan. rDempt's deck comes from a Startup Weekend event and we found no record of outside funding.
The price gap: what you pay and what it multiplies
Olsam's page 2, "Highlights", sets out the case in four columns. Under "Proven model": "Olsam acquires, operates and grows Amazon Marketplace businesses", a "'Roll-up' strategy applied to digital businesses", and "Valuation arbitrage given low valuations at entry (2.0-4.5x profits) vs exit at scale (large eCommerce peers at scale trade at 10-20x)". It cites Thrasio as "Proof of concept" with a valuation of more than $2 billion, and claims "Proprietary tech-enabled deal sourcing platform, scouring the entire marketplace".
This is the core of almost every roll-up pitch: buy small businesses at a low multiple of their profit, combine them, and hope the combined company is valued at a higher multiple. Stating both multiples is the right instinct, because the investor can see the size of the gap the plan relies on.
Two things need tightening. "Profits" isn't defined here, while page 7 uses SDE. SDE, seller's discretionary earnings, is profit before the owner's own pay and personal costs, a measure common in small-business sales that usually gives a higher figure than operating profit after a market-rate manager is paid. A multiple of SDE and a multiple of operating profit aren't the same price. And the 10-20x exit multiple comes from "large eCommerce peers at scale", which is the valuation the plan hopes to reach, not one it has. The slide should say which profit measure each multiple uses and treat the exit figure as an assumption.
Clockwork's page 15, "Fragmentation = Efficient Scaling", makes the same case for staffing. It reads: "14K Target-rich Environment: Over 14,000 temp and contract staffing agencies in the US alone", "500 Immediately Addressable Targets: Over 500 temp & contract agencies actively marketed for sale at any time", and "2-3x Favorable Economics: Trading at multiples well below tech-enabled peers". The "500 for sale" figure is the useful one: it tells the investor how many businesses could be bought now, not just how many exist. The 2-3x figure, though, doesn't say what it multiplies, and none of the three numbers gives a source.
One closed deal is worth more than a thesis
Olsam's page 7, "Case Study: Peak Coffee (Closed Deal)", is the strongest slide in the set. Under "Business Snapshot" it lists high-quality coffee capsule holders, "more than 3,500 reviews with an average rating of 4.8" (printed with a greater-than sign), "Ranks 2nd in the market", "UK-based, sales primarily in the UK", "Founded in 2013" and "Acquired for 3.2x SDE + earn-out". "Main Growth Opportunities" lists US then European expansion, a brand and listing redesign, and supply chain work after "major stock outs in 2020, poor supply chain planning". A quote from the seller praises the process, and a "Financial Summary" chart shows revenue of £592k in 2019 and £954k in 2020, marked "60%", with SDE of £78k and £211k.
This page answers the questions a thesis can't. It shows a real purchase, the multiple paid, the deal structure (an earn-out, where part of the price depends on later results) and what Olsam plans to change. On the chart's figures, revenue grew about 61% and SDE grew about 2.7 times, from roughly 13% of revenue to roughly 22% (our calculations). The seller's quote also does work: in a roll-up, being a buyer that founders want to sell to is part of how you get deal flow.
What the page doesn't say matters as much. Both years on the chart appear to be before Olsam bought the business, since the slide doesn't date the purchase and Olsam launched in October 2020, so the growth is the seller's, not evidence that Olsam improves what it buys. The slide doesn't say which year's SDE the 3.2x applies to: on 2020 SDE of £211k it would be about £675k before the earn-out (our calculation), but the basis isn't stated. A stronger version would date the purchase, state the price basis and show at least one period after the purchase.
The pipeline: stages, pace and deal size
Clockwork's page 14, "Rollup vision", is headed "To accelerate our growth, we're building the m/a machinery to add $300M+ p.a. in inorganic GMV". Five boxes follow: "We have 6 deals identified and 2 are in signed purchase agreements, worth $39M ARR"; "Target 6 acquisitions in 2022, with 18 completed by 2023. Roughly 2 per quarter at $20M ARR each"; "Deal sizes between $3 and 12M (but no artificial limit)"; "US and Latam initial focus"; and "$300M+ GMV and $40M EDITDA potential over the next 2-3 years with less than $100M invested" (EDITDA as printed; EBITDA is meant).
This is what a pipeline slide should attempt. It separates deals identified from deals under signed purchase agreements, gives a pace (about two a quarter), a deal-size range and a geography. An investor can ask how the two signed deals were found and how long they took, and test the pace against the team's capacity to buy and absorb companies.
The weaknesses are in the units and the totals. The page mixes ARR, GMV and EBITDA, and the footnote on page 17 says Clockwork's GMV includes some subscription and management fees, so these measures overlap in ways the slide doesn't explain. Six acquisitions at $20M ARR each would be $120M ARR in 2022 (our calculation), far above the roll-up figure for 2022 in the page 9 table, so either the pace, the size or the units differ between pages. A signed purchase agreement isn't a completed deal, and the slide should say when the two are expected to close and on what conditions.
Keep bought growth separate from organic growth
Clockwork's page 9, "Roadmap for continued hypergrowth", lists organic plans (new markets, worker transport networks, H2B visa programmes) and a "Roll-up Opportunity" ("Rapid vertical and market expansion opportunities at favorable rates", "Proven model with significant target universe"). A table for 2022 to 2027 gives four organic lines, "Total Organic" (121.2 in 2022, 3,079.5 in 2027), "Roll-ups M/A" (73.3 rising to 873.3) and "Total ARR" (194.5 rising to 3,952.8). No unit is printed; the deck's page 8 reports revenue in thousands of dollars per month, so the table's unit is unclear.
Splitting the forecast this way is the most important habit in the set. On these figures, acquisitions are about 38% of total ARR in 2022 and about 22% in 2027 (our calculations), so the plan leans most on acquisitions early and on organic growth later. An investor can now ask two separate questions: is the organic line credible, and is the acquisition line funded?
There is also an error to learn from. In the chart above the table, the line labelled "Total organic" ends near 870 and the line labelled "Roll-ups M/A" ends near 3,000, which match the table's roll-up and organic totals the other way round. The legend appears to be swapped. A reader who trusts the chart would conclude that most growth is bought. Check every chart against its table before the deck goes out.
Show how much of the raise buys companies
Clockwork's page 17, numbered 16 on the slide, is headed "We'll be at $250M GMV before our Series B, thanks to our robust investment plan". The left side says the first outside capital was "$8.3M raised in last year's Series" and that the company has "reached $24M in GMV on $4M in burn, a 6x capital-efficiency ratio", and that it is "looking to raise $50-60M" to reach "$240-250M in GMV in 18 months". A waterfall chart, "In millions of USD, 1 April 2022 to 30 September 2023", starts with 4.3 in cash, adds 50 from the Series A, then subtracts 4 (US organic plan), 3 (Latam organic plan), 2 (geographic expansion), 4 (engineering) and 45 (M/A), adds 8 of reinvested free cash flow and ends at 4.3. A row beneath gives the GMV run rate each item should produce and a "GMV/burn" ratio.
This is the clearest answer in the set to what the round is for. The bars add up (our check), and acquisitions take $45M of the $50M raised, about 90% (our calculation). An investor sees at once that this is mostly a fund for buying staffing agencies with a technology business attached, and can price the round accordingly.
The row beneath needs care. For the organic items the ratio is the GMV divided by the spend (50 on 4 is 12.5, 20 on 3 is 6.7), but for M/A it prints 3.33 against GMV of 140 and spend of 45, which works out to about 3.1 (our calculation). Small mismatches like this make investors recheck everything else. The chart also doesn't say whether the $45M covers the purchase price only or integration costs too, or whether any purchases would be paid partly with debt or earn-outs.
A roll-up idea without a plan
rDempt, a QR-code lost-and-found service pitched at Startup Weekend Lincoln, uses page 20, "Competitor Rollup", for three bullets: "Competitors are small, regionally locked.", "Stagnant growth over the past few years." and "Rollup could make QR tagging a US norm." Five competitor logos (StuffBak, Gokodes, zReturn, Please Return Me, BoomerangIt) have arrows pointing to rDempt's own logo.
The page has the right first observation: a market of small, slow-growing competitors can be cheaper to buy than to beat. But there is no price, no evidence that any of the five would sell, no funding source and no explanation of how combining them would make QR tagging "a US norm". The deck's page 16 lists a competitor roll-up as a later step in its plan, which suggests it is an option rather than the business. As a page in a weekend pitch it is a reasonable idea to raise. On an investor deck it would need everything the Olsam and Clockwork pages supply.
What to put on your slides
Start with the price: the multiple you pay, the measure it multiplies (SDE, EBITDA or revenue) and the source of the comparison multiple you hope to reach. If you have closed a deal, give it a page: purchase date, price and structure (cash, earn-out, debt), the numbers before the purchase and at least one period after it, and what you changed.
Then show the pipeline in stages (identified, in talks, signed, closed), the pace you can sustain and the deal-size range, using one unit throughout. Put organic and acquired growth on separate lines of the forecast, and check that every chart agrees with its table. Finally, show how much of the raise goes to purchases and how purchases will be paid for. If figures are confidential, keep the labels and units so investors know what to ask for.
Be honest about which kind of company you are. A software company that may buy a competitor someday doesn't need a roll-up slide. A company whose forecast depends on acquisitions needs every element above, because the investor is backing the buying as much as the product.
Common mistakes
Multiple without a base. Say whether it multiplies SDE, EBITDA or revenue.
Seller's growth shown as yours. Date the purchase and show results after it.
Signed counted as closed. Separate signed agreements from completed deals.
One forecast line. Show organic and acquired growth separately.
Chart contradicts table. Check every legend and total before sending.
Mixed units. Don't move between ARR, GMV and EBITDA without saying so.
Diagnostic checklist
The purchase multiple and its base measure are stated.
At least one closed deal is dated, priced and followed after purchase.
The pipeline is shown in stages with a sustainable pace.
Organic and acquired growth are separate lines in one unit.
Charts and tables agree.
The share of the raise used for purchases is shown.
Frequently asked questions
What multiple should a roll-up slide show?
The one you actually pay, with its base. Olsam's case study says 3.2x SDE plus an earn-out; a multiple without its base measure can't be compared.
Do I need a closed acquisition before pitching a roll-up?
It is the strongest evidence you can show. Without one, give the pipeline in stages, as Clockwork does, and say what has been signed and when it closes.
Should acquired revenue be in my main forecast?
Yes, but on its own line. Clockwork's table separates organic from roll-up growth, which lets investors judge each.
How much of my raise can go to acquisitions?
There is no fixed share, but say it plainly. Clockwork's chart sends $45M of $50M to M&A, which tells investors what kind of company they are funding.
Is a competitor roll-up worth mentioning at an early stage?
Only as an option, and labelled as one. rDempt's page names competitors but gives no price or funding, so it reads as an idea rather than a plan.
How we chose these examples
Selection (2026-10-02): we checked the published guides and queued drafts for any page answering how to present growth by acquisition; the organic-growth guide only defines the term, and use-of-funds and comparable-exits cover different questions. We searched the corpus index (docs/seo/artifacts/corpus-search) for roll-up, buy-and-build, acquisition strategy, M&A strategy, acquisition targets, acquisition pipeline and inorganic growth.
Seven pages from three original deck files were rendered and read at full size: Olsam 2 and 7, Clockwork 9, 14, 15 and 17, rDempt 20. Excluded: a listed clinic group's deck, a gaming deck marked confidential, listed companies, funds and incidental mentions.
Eligibility was judged at each deck's date; all three companies were private when their decks were made. Olsam's raise is from TechCrunch; Clockwork's founder background from a PR Newswire release about his earlier company, Shift One; Clockwork's round outcome is unknown. Every example was written with AI assistance and checked by editorial model review against the slide images; no human review is claimed. Figures are as printed; arithmetic is ours and labelled.