Comparable Exits on a Pitch Deck: What a Deal List Proves
How founders list comparable acquisitions and exits on a pitch deck: prices, dates, multiples and what they are multiples of, and why acquisitions, IPOs.
How to Show Comparable Exits on Your Pitch Deck Without Overstating Them
Twelve slides from real pitch decks that list other companies' acquisitions, IPOs or valuations as evidence of how their own company could exit. For each, we record what the slide states, what kind of value each figure is, and whether the figures support the conclusion drawn from them.
TL;DR
A comparable-exits slide lists deals involving similar companies to show that buyers exist and what they have paid. It earns trust when every row is the same kind of event (an acquisition price, not a mix of acquisitions, IPO valuations, market caps and funding rounds), is dated, names the buyer, and, if a multiple is shown, says what it is a multiple of (revenue, EBITDA or capital raised). The strongest slides then connect the list to the company's own plan with stated assumptions.
In this set, Ohos shows why the definition matters: its "Multiple/Cap" column mixes bases, and by our calculation Cornerstone OnDemand's 10x matches valuation divided by capital raised ($464M against $44.7M), while the acquisitions' 10x, 6x, 4x and 20x have no stated base. Medifies connects comparables to its own case most directly: "about 8x revenue" on $20M revenue gives its $160M exit (our calculation matches), but the slide cites no source for the 8x. Keeper places market caps, an IPO price and three acquisition prices in one bubble chart.
Comparable exit slides from real pitch decks
Each example shows the exact page from the original public deck above its analysis and links to the full teardown. Figures and deal facts are the companies' own statements and have not been verified. Calculations are ours and are labelled. Page numbers are PDF page numbers.
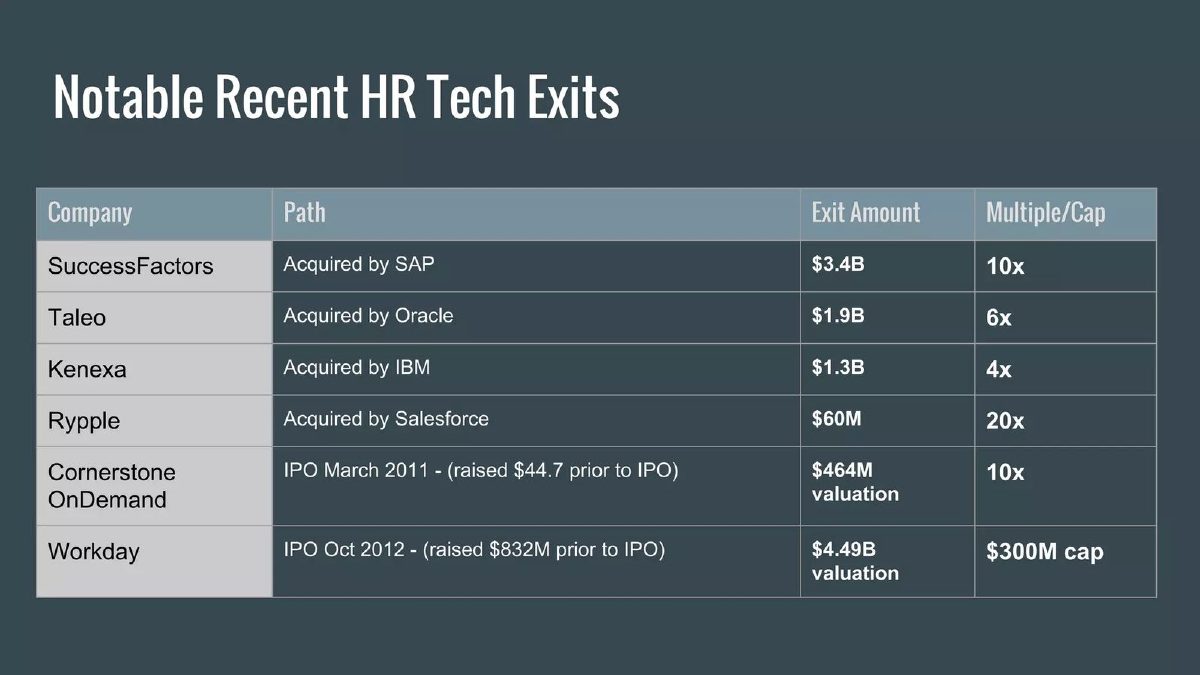
Ohos deck, slide 11. Exact stored slide matched to this analysis.
Our analysis: A well-labelled deal table whose multiple column mixes or omits its bases.
Evidence and limitation: Our calculation: Cornerstone's $464M is about 10.4 times $44.7M raised, matching its 10x; Workday on the same basis is about 5.4x. The acquisition multiples have no stated base.
What a founder can adapt: Name the multiple's base in the header (revenue or capital raised), apply it to every row, and add deal years.
Supporting analysis
What the deck claims: Company, Path, Exit Amount, Multiple/Cap: SuccessFactors acquired by SAP, $3.4B, 10x; Taleo by Oracle, $1.9B, 6x; Kenexa by IBM, $1.3B, 4x; Rypple by Salesforce, $60M, 20x; Cornerstone OnDemand IPO March 2011 (raised $44.7 prior to IPO), $464M valuation, 10x; Workday IPO Oct 2012 (raised $832M prior to IPO), $4.49B valuation, $300M cap.
Presentation choice: Separating acquisitions from IPOs in a Path column is the right structure.
When it does not fit: Don't put a dollar figure ("$300M cap") in a column of multiples.
Digital health company. "Exit Scenario – Acquisition" page; "CEO has been a part of 5 exits to date."
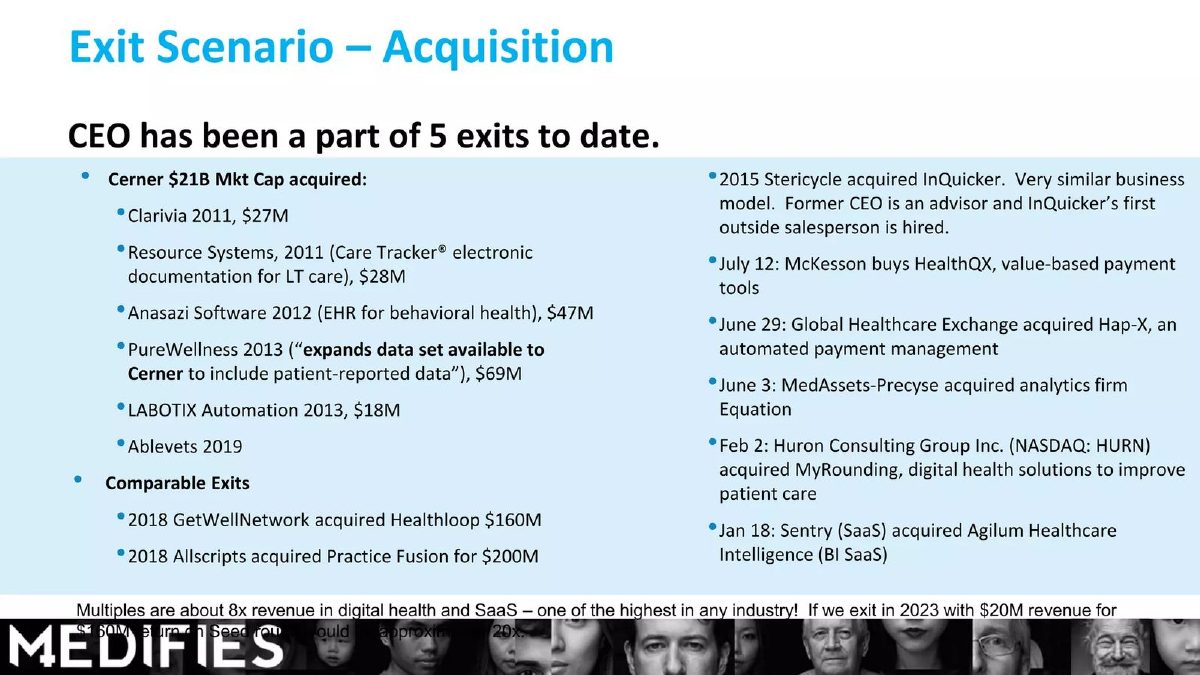
Medifies deck, slide 17. Exact stored slide matched to this analysis.
Our analysis: Comparables tied to the company's own exit with a stated multiple, but the multiple is unsourced.
Evidence and limitation: Our calculation: 8 times $20M is $160M; the five priced Cerner deals total $189M. No target revenue or source for 8x is given.
What a founder can adapt: Add each target's revenue at acquisition and a source for the 8x; keep the footnote readable.
Supporting analysis
What the deck claims: Cerner acquisitions: Clarivia 2011 $27M, Resource Systems 2011 $28M, Anasazi Software 2012 $47M, PureWellness 2013 $69M, LABOTIX Automation 2013 $18M, Ablevets 2019 (no price). Comparable exits: GetWellNetwork acquired Healthloop $160M (2018); Allscripts acquired Practice Fusion for $200M (2018). Footnote: "Multiples are about 8x revenue in digital health and SaaS"; "If we exit in 2023 with $20M revenue for $160M" (the rest is partly covered).
Presentation choice: It is the only slide in the set that turns a deal list into a one-line valuation the reader can check.
When it does not fit: Don't let an image cover part of a financial claim.
Dating app. "Dating apps bad at creating relationships, worth billions" bubble chart.
Keeper deck, slide 16. Exact stored slide matched to this analysis.
Our analysis: Each bubble is labelled by type, but market caps and acquisitions are drawn as one sequence.
Evidence and limitation: Three types of value in one chart; the three acquisitions range from $575M to $1.73B over six years.
What a founder can adapt: Split the chart: public comparables in one group, acquisitions (with target size) in another.
Supporting analysis
What the deck claims: Match Group $9B (2025 market cap); Bumble $8.6B (IPO Price); Grindr $4.5B (2025 market cap); Hyperconnect $1.73B (acquired by Match Group in 2021); Tantan $760M (acquired by Momo in 2018); Plenty of Fish $575M (acquired by Match Group in 2015).
Presentation choice: The per-bubble labels make the mix visible, which many slides do not.
When it does not fit: Don't size public-company market caps and private acquisition prices on the same scale as if both were exits.
Mobile software company (Digital Turbine). "Compelling Valuations" page, 2014.
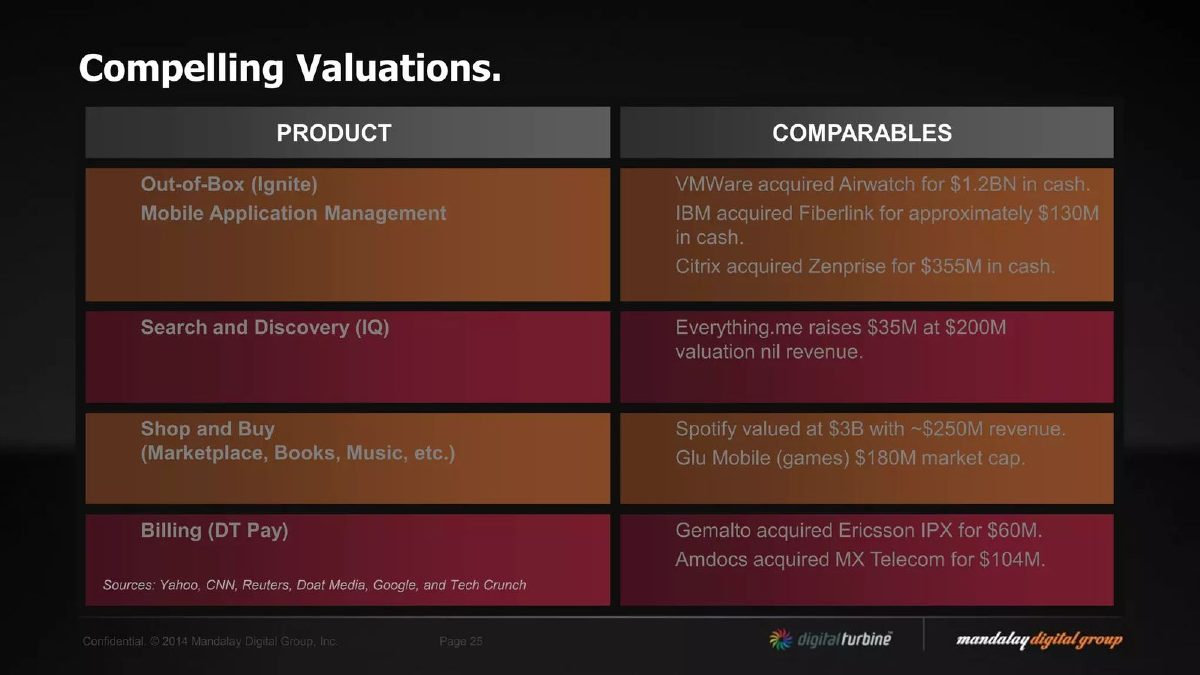
Mandalay Digital deck, slide 25. Exact stored slide matched to this analysis.
Our analysis: Comparables grouped by product line, with acquisitions, funding valuations and market caps mixed within groups.
Evidence and limitation: Our calculation: Spotify at about 12 times revenue, a private valuation; no other row gives revenue. Deals are undated.
What a founder can adapt: Keep only acquisitions in the comparables column, add years and revenue where public.
Supporting analysis
What the deck claims: By product: VMware acquired Airwatch for $1.2BN in cash; IBM acquired Fiberlink for approximately $130M; Citrix acquired Zenprise for $355M; Everything.me raises $35M at $200M valuation nil revenue; Spotify valued at $3B with ~$250M revenue; Glu Mobile $180M market cap; Gemalto acquired Ericsson IPX for $60M; Amdocs acquired MX Telecom for $104M. Sources: Yahoo, CNN, Reuters, Doat Media, Google and Tech Crunch.
Presentation choice: Mapping each product line to its own comparables is a useful structure for a multi-product company.
When it does not fit: A funding round at "$200M valuation nil revenue" is not an exit.
Portfolio company page for Mobio Technologies, a social media marketing business.
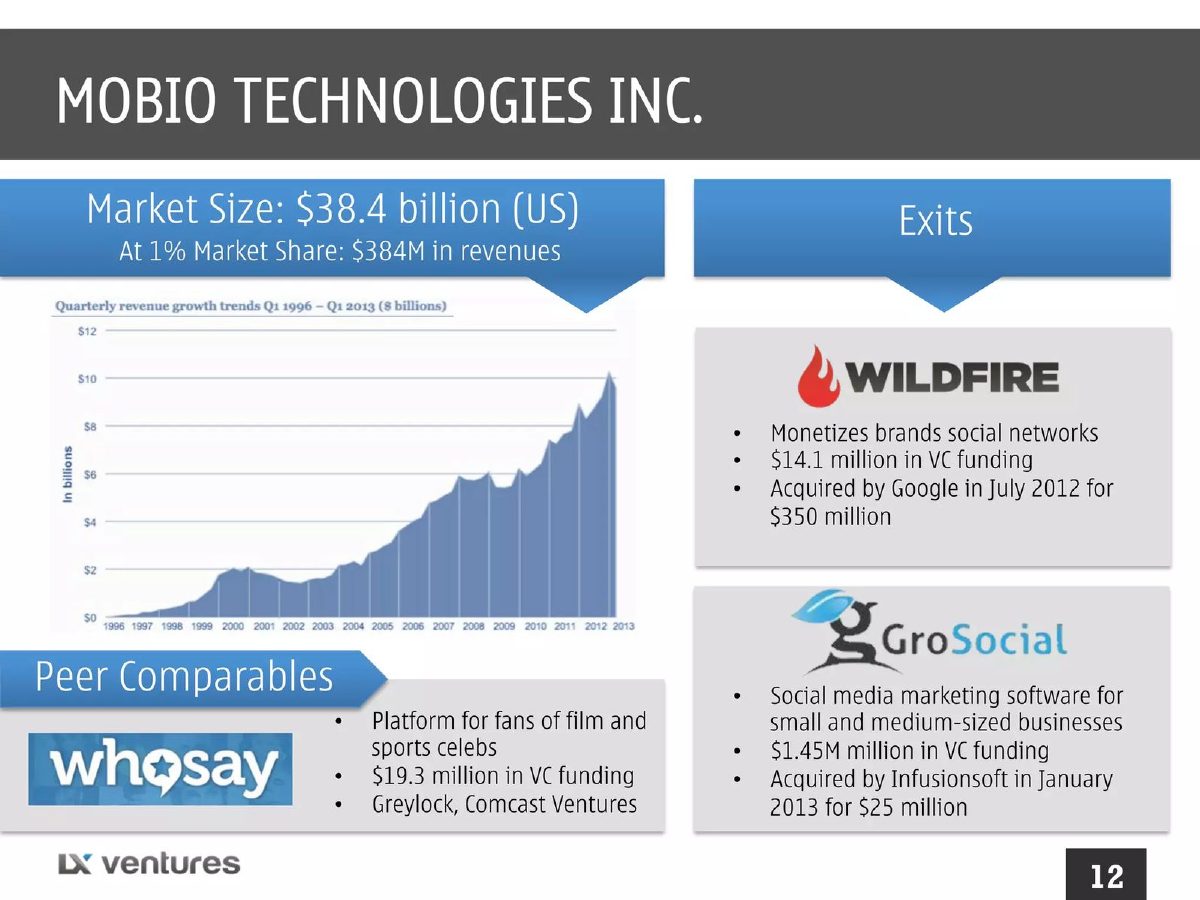
LX Ventures (Mobio Technologies) deck, slide 12. Exact stored slide matched to this analysis.
Our analysis: Dated, priced exits with the targets' funding, which lets the reader compute returns on capital.
Evidence and limitation: Our calculation: about 25 times and 17 times capital raised; 1% of $38.4B is $384M.
What a founder can adapt: Add the targets' revenue at acquisition if public, and replace the 1% share with a bottom-up estimate.
Supporting analysis
What the deck claims: Market size $38.4 billion (US); "At 1% Market Share: $384M in revenues". Exits: Wildfire, $14.1 million in VC funding, acquired by Google in July 2012 for $350 million; GroSocial, $1.45M million in VC funding, acquired by Infusionsoft in January 2013 for $25 million. Peer comparable: WhoSay, $19.3 million in VC funding (Greylock, Comcast Ventures).
Presentation choice: Funding plus price per deal is the minimum needed to judge investor outcomes.
When it does not fit: Don't pair careful comparables with a top-down market-share assumption.
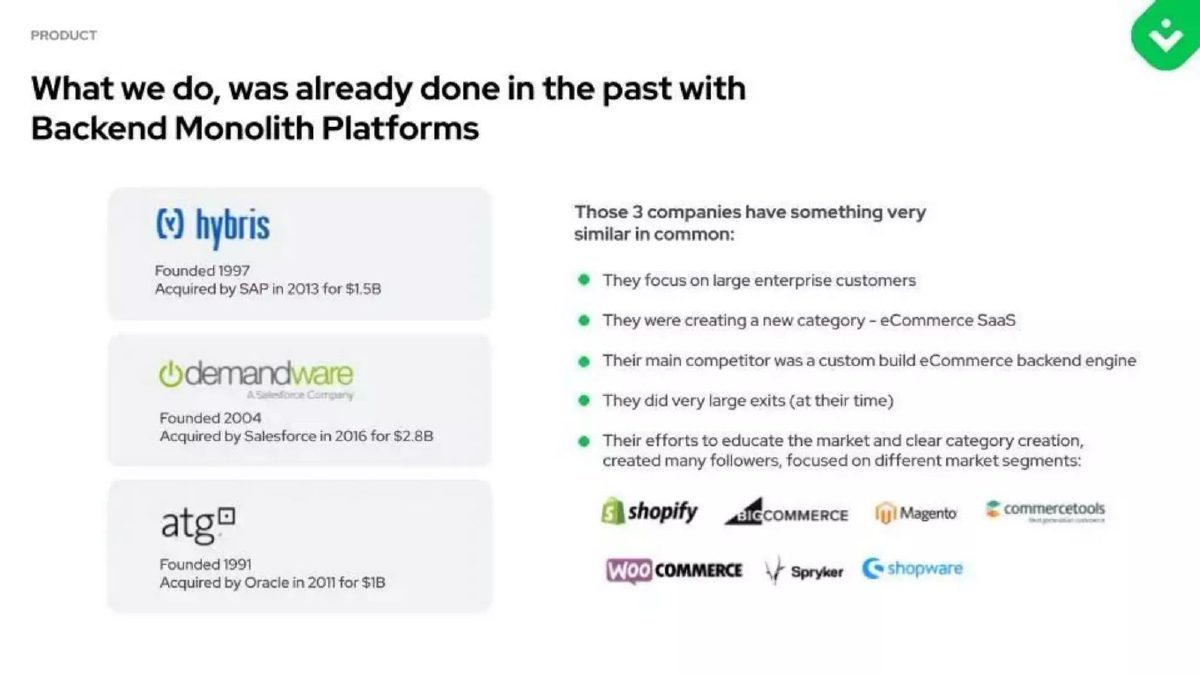
Headless e-commerce software company. "What we do, was already done in the past with Backend Monolith Platforms".
Vue Storefront deck, slide 8. Exact stored slide matched to this analysis.
Our analysis: Category precedents with founding and exit years, which also show how long exits took.
Evidence and limitation: Our calculation: 16, 12 and 20 years from founding to exit.
What a founder can adapt: Add the targets' revenue at acquisition and say how Vue Storefront's model compares.
Supporting analysis
What the deck claims: hybris: founded 1997, acquired by SAP in 2013 for $1.5B. Demandware: founded 2004, acquired by Salesforce in 2016 for $2.8B. ATG: founded 1991, acquired by Oracle in 2011 for $1B. "They did very large exits (at their time)"; followers logos include Shopify, BigCommerce, Magento and commercetools.
Presentation choice: Founding dates beside exit dates give an honest view of the timeline.
When it does not fit: "Very large exits (at their time)" is vague; let the prices and dates speak.
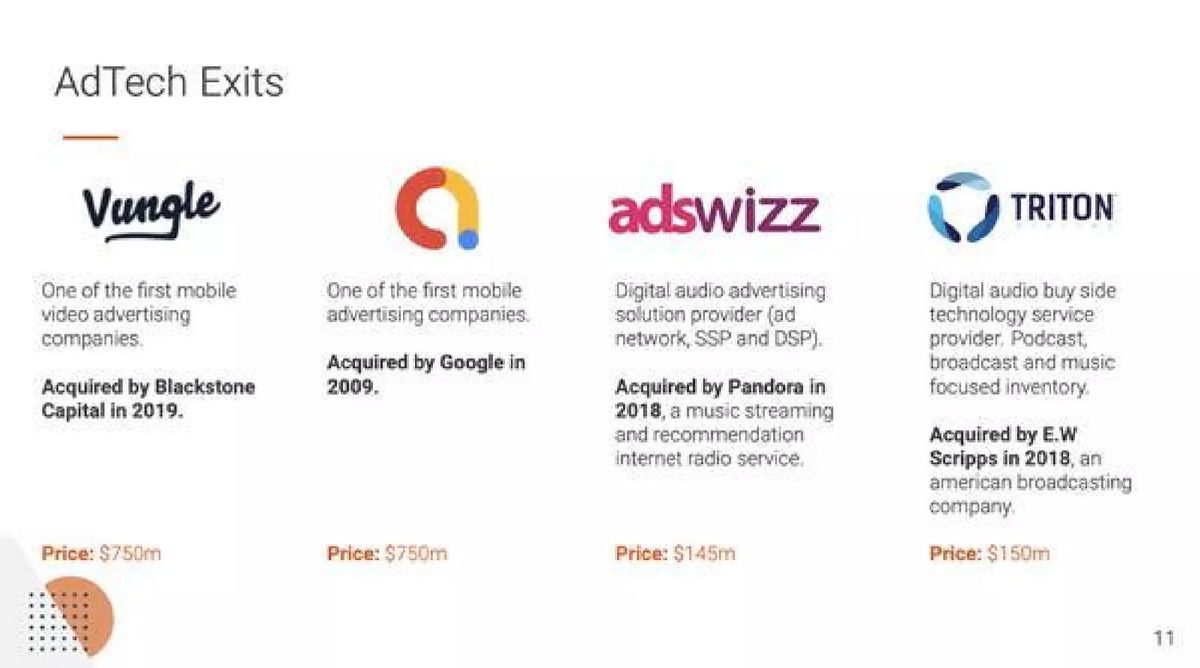
Audiomob deck, slide 11. Exact stored slide matched to this analysis.
Our analysis: A clean acquisition list with prices and years spanning a decade.
Evidence and limitation: Priced and dated; the two audio deals are about one fifth the size of the two mobile deals (our calculation). No target revenue.
What a founder can adapt: Name the second company in text and add each target's revenue or stage at acquisition.
Supporting analysis
What the deck claims: Vungle, acquired by Blackstone Capital in 2019, price $750m; a mobile advertising company shown by logo, acquired by Google in 2009, price $750m; AdsWizz, acquired by Pandora in 2018, price $145m; Triton, acquired by E.W Scripps in 2018, price $150m.
Presentation choice: Every row is the same kind of event, with buyer, year and price.
When it does not fit: Weight recent, closer comparables (the audio deals) above older, larger ones.
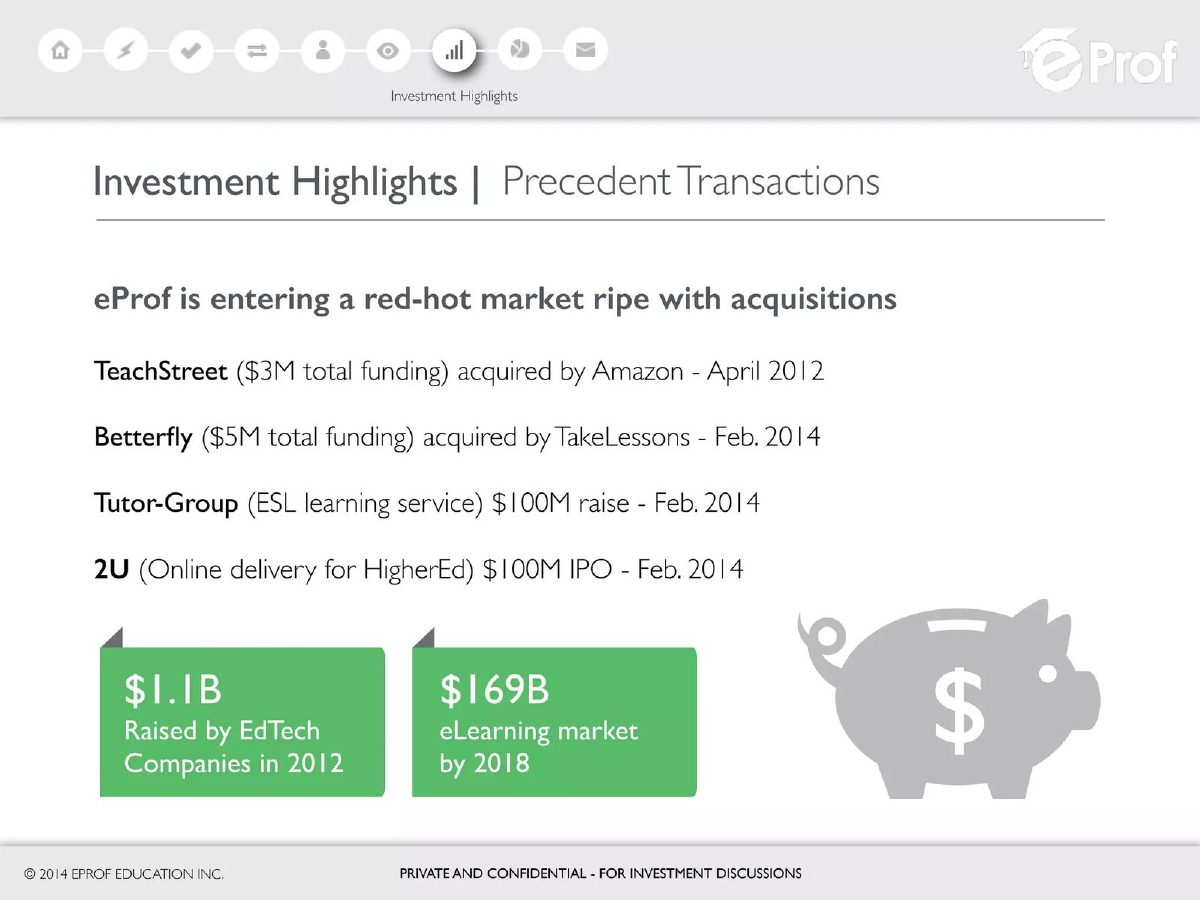
eProf deck, slide 23. Exact stored slide matched to this analysis.
Our analysis: A market-activity list titled as precedent transactions.
Evidence and limitation: No acquisition prices; two of the four events are a funding round and an IPO.
What a founder can adapt: Give prices (or "undisclosed") and move the raise and IPO to a separate market-activity line.
Supporting analysis
What the deck claims: TeachStreet ($3M total funding) acquired by Amazon, April 2012; Betterfly ($5M total funding) acquired by TakeLessons, Feb. 2014; Tutor-Group $100M raise, Feb. 2014; 2U $100M IPO, Feb. 2014; "$1.1B Raised by EdTech Companies in 2012"; "$169B eLearning market by 2018".
Presentation choice: Dates and buyers are given, which shows the sector attracts acquirers.
When it does not fit: Don't use the targets' funding totals in place of acquisition prices.
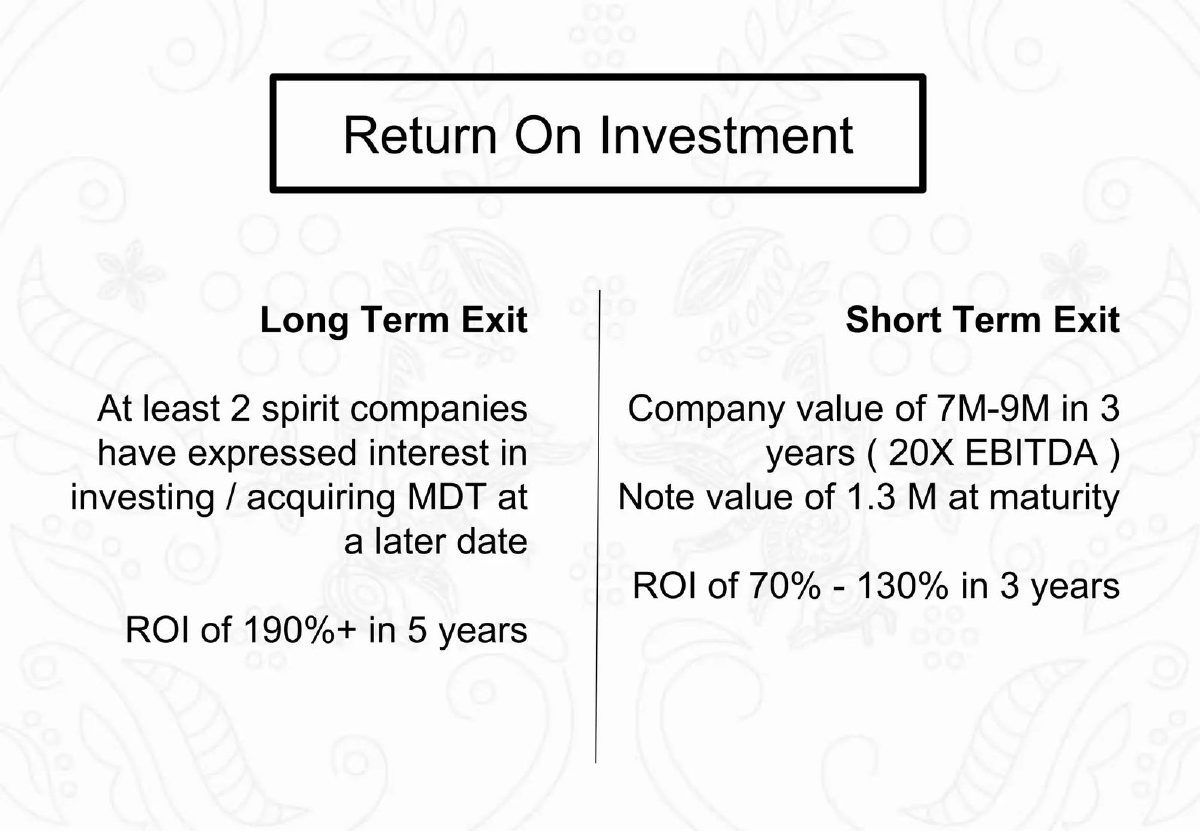
Miel de Tierra deck, slide 21. Exact stored slide matched to this analysis.
Our analysis: A self-valuation at a stated multiple with no deals to support it.
Evidence and limitation: Our calculation: 20x EBITDA at $7M to $9M implies $350,000 to $450,000 EBITDA in year three. No comparables, note principal or names of interested companies.
What a founder can adapt: Add two or three spirits acquisitions with their multiples, and state the note's principal and terms.
Supporting analysis
What the deck claims: Long term exit: "At least 2 spirit companies have expressed interest in investing / acquiring MDT at a later date"; "ROI of 190%+ in 5 years". Short term exit: "Company value of 7M-9M in 3 years ( 20X EBITDA )"; "Note value of 1.3 M at maturity"; "ROI of 70% - 130% in 3 years".
Presentation choice: It shows why comparables matter: the multiple drives the whole return claim.
When it does not fit: Don't state a multiple for your own exit without evidence that buyers pay it.
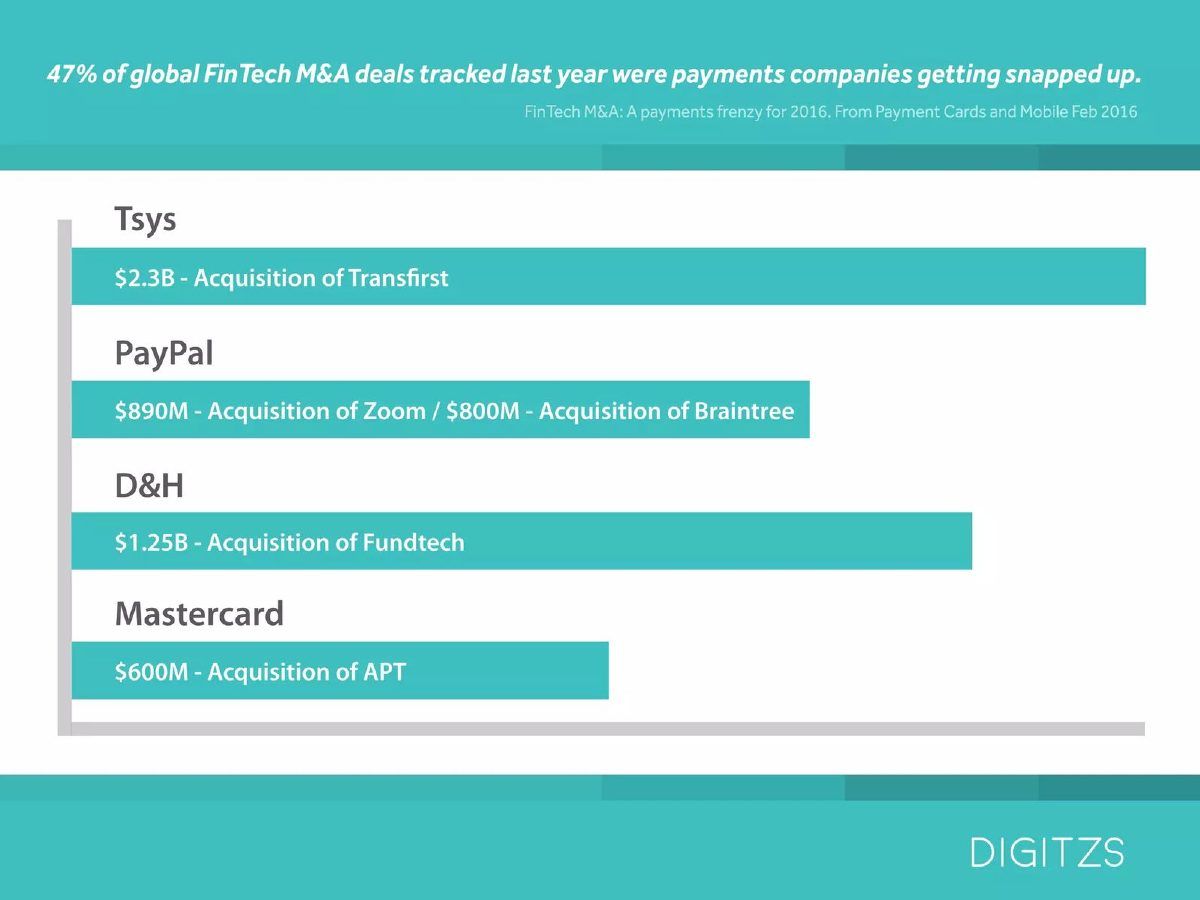
Payments company. Market-activity page on fintech M&A, 2016.
Digitzs deck, slide 11. Exact stored slide matched to this analysis.
Our analysis: A sourced market-activity headline with undated deals drawn off scale.
Evidence and limitation: By our measurement, bar lengths are not proportional to the amounts; deals are undated.
What a founder can adapt: Date each deal and draw bars to scale (or drop the bars and use a table).
Supporting analysis
What the deck claims: "47% of global FinTech M&A deals tracked last year were payments companies getting snapped up" (source: FinTech M&A: A payments frenzy for 2016, Payment Cards and Mobile, Feb 2016). Bars: Tsys $2.3B Transfirst; PayPal $890M Zoom / $800M Braintree; D&H $1.25B Fundtech; Mastercard $600M APT.
Presentation choice: Citing the source of the headline statistic is a habit most exit slides lack.
When it does not fit: Don't combine two separate deals (Zoom and Braintree) in one bar.
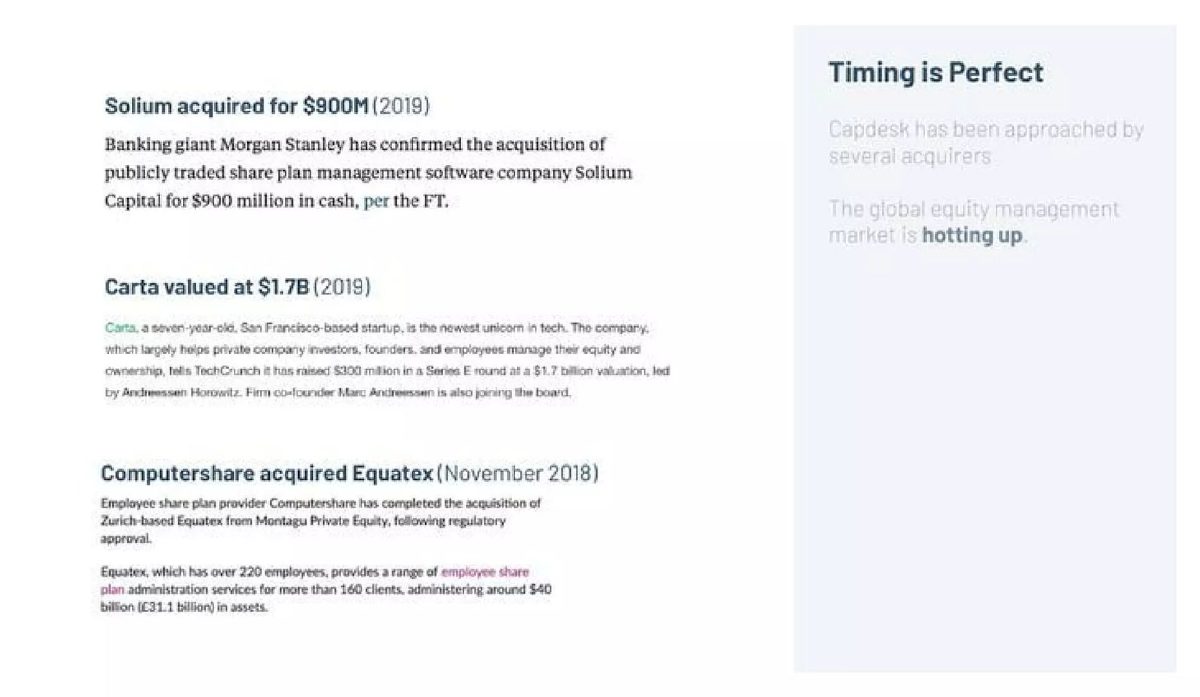
Equity management software company. "Timing is Perfect" page.
Capdesk deck, slide 8. Exact stored slide matched to this analysis.
Our analysis: Press-sourced sector deals beside an unsupported acquirer-interest claim.
Evidence and limitation: One priced acquisition, one funding valuation, one unpriced acquisition; the approach claim has no detail.
What a founder can adapt: Say "price undisclosed" for Equatex, move Carta to a separate line, and describe any approach by industry and date.
Supporting analysis
What the deck claims: "Solium acquired for $900M (2019)", by Morgan Stanley, "$900 million in cash, per the FT"; "Carta valued at $1.7B (2019)", a $300 million Series E; "Computershare acquired Equatex (November 2018)", over 220 employees, more than 160 clients, around $40 billion (£31.1 billion) in assets administered, no price. "Capdesk has been approached by several acquirers."
Presentation choice: Quoting the source (the FT, TechCrunch) makes each deal checkable.
When it does not fit: "Approached by several acquirers" without detail adds little.
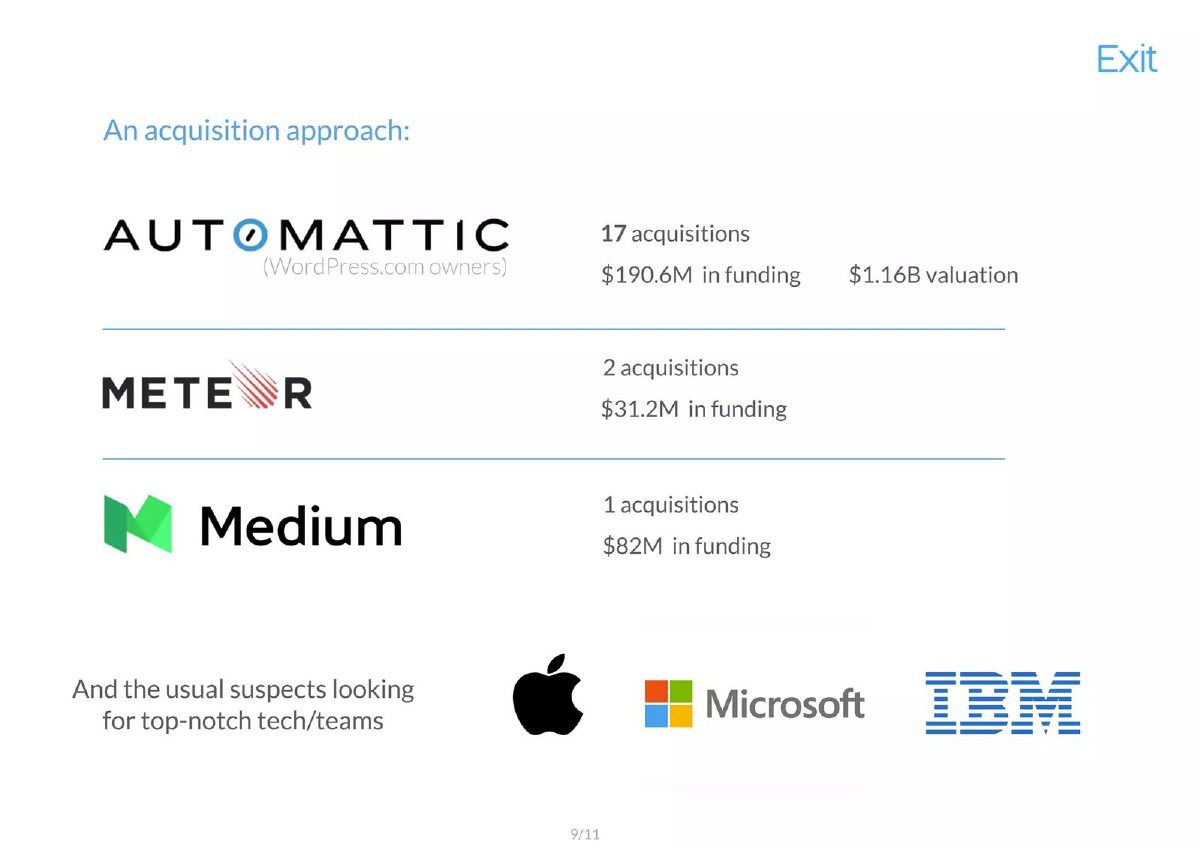
WordPress mobile app platform. "Exit: An acquisition approach" page (9/11).
Worona deck, slide 9. Exact stored slide matched to this analysis.
Our analysis: An acquirer map, not a comparable-exits list.
Evidence and limitation: No deal prices or examples of what these companies bought.
What a founder can adapt: Add one or two actual acquisitions by each buyer with target type and price (or "undisclosed").
Supporting analysis
What the deck claims: Automattic (WordPress.com owners): 17 acquisitions, $190.6M in funding, $1.16B valuation. Meteor: 2 acquisitions, $31.2M in funding. Medium: 1 acquisitions, $82M in funding. "And the usual suspects looking for top-notch tech/teams": Apple, Microsoft, IBM logos.
Presentation choice: Naming likely buyers and their acquisition counts is a reasonable starting point for an exit slide.
When it does not fit: Logos of large tech companies alone do not show interest in your category.
Each cell reports only what the slide itself states. "Not stated" means the page gives no figure.
Example
Value types shown
Prices?
Dates?
Multiple and base
Tied to own plan?
Ohos
Acquisitions, IPO valuations
Yes
IPOs only
Yes; base not stated
No
Medifies
Acquisitions
Most
Yes
8x revenue (unsourced)
Yes ($20M to $160M)
Keeper
Market caps, IPO, acquisitions
Yes
Yes
Not stated
No
Mandalay
Acquisitions, funding, market caps
Yes
Not stated
Spotify only (our calc.)
No
LX Ventures
Acquisitions, funding
Yes
Yes
Funding given (our calc.)
Market-share line only
Vue Storefront
Acquisitions
Yes
Yes, with founding
Not stated
Category precedent
Audiomob
Acquisitions
Yes
Yes
Not stated
No
eProf
Acquisitions, raise, IPO
No
Yes
Not stated
No
Miel de Tierra
Own valuation
n/a
3-year horizon
20x EBITDA (no comparables)
Yes
Digitzs
Acquisitions
Yes
Not stated
Not stated
Market activity
Capdesk
Acquisitions, funding valuation
Partly
Yes
Not stated
Approach claim
Worona
Acquirer profiles
No
Not stated
Not stated
Acquirer map
Key Takeaways
One kind of value per list. Keeper and Mandalay mix acquisition prices, market caps, IPO values and a private funding valuation; they measure different things.
Say what a multiple is of. Ohos' "Multiple/Cap" column gives no base; Cornerstone's 10x matches valuation over capital raised (our calculation), not revenue.
Give prices. eProf's "Precedent Transactions" lists two acquisitions with the targets' funding but no prices, plus a funding round and an IPO.
Date the deals. Audiomob's four adtech exits span 2009 to 2019; Vue Storefront's took 12 to 20 years from founding (our calculation).
Connect the list to your plan, with the source of the multiple. Medifies' 8x times $20M equals $160M, but the 8x is unsourced.
Buyer lists without prices are acquirer maps, not comparables. Worona counts acquisitions by Automattic, Meteor and Medium but gives no deal values.
Build your comparables table
Fill in one row per acquisition. Leave a field as "undisclosed" rather than guess, and keep IPOs and funding rounds out of this table.
Target and buyer. Who was acquired, and by whom?
Date. Month and year of the deal.
Price. Disclosed price, or "undisclosed".
Target size. Revenue or stage at the time of the deal, if public.
Multiple. Price divided by what (revenue, EBITDA)? Same base for every row.
Source. Press release, filing or article for each figure.
Copyable framework: [Target] acquired by [buyer], [month year], [price] at [x]x [base] ([source]). Median of [n] deals: [x]x. Applied to our [year] [base] of [amount]: [value], an illustration, not a forecast.
Illustrative example 1 — written by us
Before: Huge exits in our space: $1B+, $750M, market leaders valued at billions.
After: Four acquisitions of B2B audio-ad platforms, 2021 to 2024: prices $40M to $180M, 4x to 7x trailing revenue (sources footnoted). At our year-4 revenue plan of $12M, the same range gives $48M to $84M; an illustration, not a forecast.
What improved: Placeholder figures showing the format: one value type, dated, priced, a named base and a stated range make the slide checkable.
What a comparable exit is supposed to show
An exit slide answers the investor's question of how they will eventually get their money back: an acquisition, a public listing, or occasionally a secondary sale or dividends. A comparable-exits slide supports that answer with evidence from the market. It can show three things: that buyers in the sector acquire companies like this one, roughly what they pay, and on what basis (a multiple of revenue, profit or something else).
Each of those claims needs different evidence. That buyers exist needs named deals. What they pay needs prices. On what basis needs the target's revenue or profit at the time of the deal, so the reader can compute a multiple. Most slides here provide the first, some provide the second, and very few provide the third. That is not a failure in itself; a deck does not have to value itself. But a slide that implies a valuation without the basis for it invites the reader to test the numbers, and several do not survive the test.
The comparison also has to be fair. A billion-dollar acquisition of a market leader with hundreds of millions in revenue says little about what a seed-stage company will fetch. The more similar the targets are in business model, size and stage, and the more recent the deals, the more the list tells the reader.
Keep one kind of value per list
Acquisition prices, IPO valuations, public market capitalisations and private funding-round valuations are different measurements. An acquisition price is what one buyer paid for control. An IPO valuation is the market value at listing. A market cap moves daily. A funding-round valuation is set by investors buying a minority stake, often with preferential terms. Putting them in one list suggests they are interchangeable, and they are not.
Keeper's page 16, "Dating apps bad at creating relationships, worth billions", is a bubble chart: Match Group "$9B" ("2025 market cap"), Bumble "$8.6B" ("IPO Price"), Grindr "$4.5B" ("2025 market cap"), Hyperconnect "$1.73B" ("Acquired by Match Group in 2021"), Tantan "$760M" ("Acquired by Momo in 2018") and Plenty of Fish "$575M" ("Acquired by Match Group in 2015"). Each bubble is labelled with its type, which is good. But the chart arranges them as one sequence, and the only true acquisition comparables are the three smaller ones, ranging from $575M to $1.73B across six years.
Mandalay Digital's page 25, "Compelling Valuations", groups comparables by product line. Mobile application management lists three cash acquisitions (Airwatch by VMware for $1.2BN, Fiberlink by IBM for "approximately $130M", Zenprise by Citrix for $355M). Search and discovery lists a funding round ("Everything.me raises $35M at $200M valuation nil revenue"). Shop and buy lists a valuation and a market cap ("Spotify valued at $3B with ~$250M revenue", "Glu Mobile (games) $180M market cap"). Billing lists two acquisitions ($60M and $104M). Grouping by product is useful, but within the slide the types change row by row. Only Spotify comes with revenue; by our calculation that is about 12 times revenue, and it is a private valuation, not an exit.
Ohos' page 11, "Notable Recent HR Tech Exits", uses a table with a "Path" column that separates acquisitions (SuccessFactors by SAP, Taleo by Oracle, Kenexa by IBM, Rypple by Salesforce) from IPOs (Cornerstone OnDemand, Workday). That labelling is right. The trouble is in the last column, discussed next.
Say what the multiple is a multiple of
Ohos' table has an "Exit Amount" column ($3.4B, $1.9B, $1.3B, $60M, "$464M valuation", "$4.49B valuation") and a "Multiple/Cap" column (10x, 6x, 4x, 20x, 10x, "$300M cap"). The page does not say what the multiples are of. By our calculation, Cornerstone OnDemand's $464M valuation is about 10.4 times the $44.7 (presumably $44.7M) it "raised prior to IPO", which matches the 10x; so at least that row is a multiple of capital raised. If the acquisition multiples were of revenue, they would imply revenues of about $340M (SuccessFactors), $317M (Taleo), $325M (Kenexa) and $3M (Rypple), all our calculations; if they were of capital raised, they would mean something quite different. For Workday, the same capital-raised basis would give about 5.4x ($4.49B against $832M, our calculation), but the column shows "$300M cap" instead of a multiple.
The fix is a column header such as "EV / trailing revenue" or "Exit value / capital raised", applied to every row, with the source of the underlying figure. Both are legitimate. A revenue multiple helps value the company; a multiple of capital raised speaks to investor returns. Mixing them in one column, or leaving the column undefined, prevents either reading.
LX Ventures' page 12 (Mobio Technologies) takes the capital-raised approach without calling it a multiple. Wildfire had "$14.1 million in VC funding" and was "Acquired by Google in July 2012 for $350 million"; GroSocial had "$1.45M million in VC funding" and was "Acquired by Infusionsoft in January 2013 for $25 million". By our calculation, those are about 25 times and 17 times capital raised. A peer comparable, WhoSay, shows "$19.3 million in VC funding" and its investors, but no exit. The same page puts the market at $38.4 billion and says "At 1% Market Share: $384M in revenues", which is arithmetically right (our calculation) but, as a top-down share assumption, not evidence of demand.
Prices, dates and the gap between a list and a plan
eProf's page 23, "Investment Highlights | Precedent Transactions", says "eProf is entering a red-hot market ripe with acquisitions" and lists four events: "TeachStreet ($3M total funding) acquired by Amazon - April 2012", "Betterfly ($5M total funding) acquired by TakeLessons - Feb. 2014", "Tutor-Group (ESL learning service) $100M raise - Feb. 2014" and "2U (Online delivery for HigherEd) $100M IPO - Feb. 2014". The two acquisitions give the targets' funding but not the prices paid, so a reader cannot tell whether investors made money. The other two events are a funding round and an IPO. In finance, "precedent transactions" usually means acquisitions with prices and multiples; this list has neither.
Audiomob's page 11, "AdTech Exits", gives prices and years for four acquisitions: Vungle by Blackstone Capital in 2019 ($750m), a company shown only by logo and described as "One of the first mobile advertising companies", acquired by Google in 2009 ($750m), AdsWizz by Pandora in 2018 ($145m) and Triton by E.W. Scripps in 2018 ($150m). The digital-audio deals (AdsWizz and Triton) are closest to Audiomob's own market and are much smaller than the two mobile deals. The slide gives no revenue for any target, and the second company is not named in text.
Vue Storefront's page 8, "What we do, was already done in the past with Backend Monolith Platforms", lists hybris (founded 1997, acquired by SAP in 2013 for $1.5B), Demandware (founded 2004, acquired by Salesforce in 2016 for $2.8B) and ATG (founded 1991, acquired by Oracle in 2011 for $1B). The founding years are a helpful addition: by our calculation, the three took 16, 12 and 20 years to exit. That is a realistic signal about timelines that most exit slides omit, even if the slide uses the list to argue category precedent rather than timing.
Medifies' page 17, "Exit Scenario – Acquisition", goes furthest in connecting comparables to a plan. It lists acquisitions by Cerner with prices ($27M, $28M, $47M, $69M, $18M and one without a price), "Comparable Exits" (GetWellNetwork acquiring Healthloop for $160M and Allscripts acquiring Practice Fusion for $200M, both 2018) and other deals without prices. A footnote says "Multiples are about 8x revenue in digital health and SaaS" and "If we exit in 2023 with $20M revenue for $160M"; the rest of the sentence, a return figure for the seed round, is partly covered by an image strip on the slide, so we do not quote it. Our calculation: 8 times $20M is $160M, so the arithmetic holds. The five priced Cerner deals add to $189M (our calculation). None of the listed deals comes with the target's revenue, so the 8x cannot be checked from the page, and no source is given for it.
When the slide values the company itself
Miel de Tierra's page 21, "Return On Investment", has no comparables at all. Under "Short Term Exit" it states "Company value of 7M-9M in 3 years ( 20X EBITDA )", "Note value of 1.3 M at maturity" and "ROI of 70% - 130% in 3 years"; under "Long Term Exit", "At least 2 spirit companies have expressed interest in investing / acquiring MDT at a later date" and "ROI of 190%+ in 5 years". By our calculation, $7M to $9M at 20 times EBITDA implies EBITDA of $350,000 to $450,000 in year three. The slide does not say why 20x is the right multiple for a spirits company, which acquisitions support it, or what the note's principal is, so the ROI range cannot be checked from the page. The two interested companies are unnamed.
A self-valuation of this kind is where comparables matter most. If a founder states a multiple, the slide should show two or three deals at or near that multiple, with the target's size, so the reader can judge whether it is plausible for a company at this stage.
Market-activity slides and acquirer maps
Some slides use deals to show that a market is active rather than to value the company. Digitzs' page 11 is headed "47% of global FinTech M&A deals tracked last year were payments companies getting snapped up", sourced to "FinTech M&A: A payments frenzy for 2016. From Payment Cards and Mobile Feb 2016". Bars show Tsys' $2.3B acquisition of Transfirst, PayPal's "$890M - Acquisition of Zoom / $800M - Acquisition of Braintree", D&H's $1.25B acquisition of Fundtech and Mastercard's $600M acquisition of APT. The headline has a cited source, which is good. By our measurement of the bar lengths, the bars are not drawn to scale: the D&H bar is longer than the PayPal bar although $1.25B is less than the combined $1.69B (our calculation), and Mastercard's bar is about half of Tsys' although $600M is about a quarter of $2.3B. Undated deals and bars not to scale weaken an otherwise sourced slide.
Capdesk's page 8 lists "Solium acquired for $900M (2019)" ("Banking giant Morgan Stanley has confirmed the acquisition" for "$900 million in cash, per the FT"), "Carta valued at $1.7B (2019)" (a Series E of $300 million) and "Computershare acquired Equatex (November 2018)", described as having over 220 employees and more than 160 clients, administering around $40 billion (£31.1 billion) in assets, with no price. A side panel says "Capdesk has been approached by several acquirers" and "The global equity management market is hotting up". Citing the press source is a good habit. The approach claim has no names, dates or terms, and the Carta figure is a funding valuation, not an exit.
Worona's page 9, "Exit: An acquisition approach", lists possible acquirers rather than deals: Automattic ("17 acquisitions", "$190.6M in funding", "$1.16B valuation"), Meteor ("2 acquisitions", "$31.2M in funding") and Medium ("1 acquisitions", "$82M in funding"), then "the usual suspects looking for top-notch tech/teams" with Apple, Microsoft and IBM logos. That is an acquirer map, which is a legitimate slide, but it shows only that these companies have bought something before. It gives no prices or examples of what they bought.
What investors will check on a comparable-exits slide
Are the targets similar? Business model, size and stage matter more than sector labels. A seed company citing billion-dollar acquisitions of market leaders is comparing itself with companies many times its size.
Are the deals recent? Valuations change with interest rates and sentiment. Audiomob's list spans a decade; Ohos' deals are from the early 2010s. Date every row so the reader can weigh it.
What is the multiple of? Revenue, EBITDA and capital raised give very different answers. Name the base in the column header and use the same one on every row.
Where do the figures come from? Digitzs and Capdesk cite sources; most slides here do not. A short source line per row, or a footnote, lets an investor check a deal quickly.
Does the list support the conclusion? Medifies' 8x claim needs targets' revenues to support it. Miel de Tierra's 20x needs any comparable at all. If the slide states a number for the company's own exit, the comparables must be able to produce it.
How to build a comparable-exits slide
Choose three to six acquisitions of companies similar to yours in model and, as far as possible, stage. Leave out market caps, IPO valuations and funding rounds, or put them in a clearly separate block.
For each deal, give the target, the buyer, the date, the price and, where public, the target's revenue at the time, so the reader can see the multiple. If the price was not disclosed, say "undisclosed" rather than leaving it blank, and do not replace it with the target's funding total.
If you show multiples, name the base in the header, use the same base throughout, and cite where the figures come from. If you apply a multiple to your own projections, show the calculation in one line, as Medifies does, and state which deals it comes from.
If buyers have approached you, say so only if you can describe the approach (industry, date, stage of discussion) without breaching confidentiality. An unqualified "approached by several acquirers", as on Capdesk's page, carries little weight.
Common mistakes
Mixing value types. Acquisition prices, IPO valuations, market caps and funding rounds belong in separate lists.
Unlabelled multiples. Say whether a multiple is of revenue, EBITDA or capital raised.
Funding in place of price. A target's funding total is not what it sold for.
Undated deals. Valuations change; date every deal.
Mismatched scale. Billion-dollar exits of market leaders say little about a seed company's outcome.
A self-valuation with no support. If you state a multiple for your own exit, show deals at that multiple.
Diagnostic checklist
Every row is the same kind of event.
Each deal names target, buyer, date and price (or "undisclosed").
Multiples name their base in the header.
Target size (revenue or stage) is given where public.
Sources are cited per deal or in a footnote.
Any valuation of your own company shows its calculation.
Charts are drawn to scale, or replaced by a table.
Frequently asked questions
Should my pitch deck include comparable exits?
Often, yes, especially for later seed and Series A decks where investors think about returns. Keep it to a few similar, recent, priced acquisitions rather than a list of the largest deals in your sector.
Can I include IPOs and market caps?
Yes, but in a separate group labelled as public comparables. Keeper and Mandalay mix them with acquisitions, which makes the list harder to read.
What multiple should I show?
The one your sector's buyers use, usually revenue for software and EBITDA for profitable traditional businesses. Name it and apply it to every row. Ohos' table shows what happens when the base is left out.
Is it wise to value my own company on the exit slide?
Only as a clearly labelled illustration, with the multiple sourced to the deals shown. Medifies' one-line calculation is checkable; Miel de Tierra's 20x EBITDA has no comparables behind it.
What if deal prices were not disclosed?
Say "undisclosed". The deal still shows that buyers exist. Do not substitute the target's funding total, as eProf's list does.
How we chose these examples
Search (2026-09-30): the durable corpus index (docs/seo/artifacts/corpus-search, 70,729 unique pages, deduplicated by deck-file sha256 + page) was searched for pages naming two or more acquisitions with prices, and for acquisition multiples ("x revenue", "x EBITDA", "precedent transactions", "comparable exits"); 44 and 19 pages matched.
Fourteen candidate pages were rendered from the original public deck files and read from the images; twelve are used: Ohos 11, Medifies 17, Keeper 16, Mandalay Digital 25, LX Ventures 12, Vue Storefront 8, Audiomob 11, eProf 23, Miel de Tierra 21, Digitzs 11, Capdesk 8 and Worona 9.
Left out: Beehiiv 5 (a market-news list with the same lesson as eProf, rendered at low resolution), Unitesus 17 (deck file unavailable), MLPA, November and Green Endeavors (companies' own acquisition strategies, not exits), Instructure, Vintage Wine Estates and Solaris (public-company pages), Fayceoff 2 and Redakt 9 (a single deal cited as market context), OfferSavvy and Coding Autism (already in the exit strategy guide).
Deal facts are the companies' statements and were not checked against outside sources; all calculations are ours and labelled. This guide describes common valuation practice in general terms and is not financial advice. How we built this: drafted and checked with AI assistance (editorial model review against the original slide images); no human editor has reviewed this guide.