Second Products and Cross-Sell on a Pitch Deck: Show
Going from one product to several is a common pitch. Four real decks show how to present a second product or cross-sell plan: attach rate, share of revenue.
Second Products and Cross-Sell on a Pitch Deck: Show the Attach Rate, Separate Actuals, Say How You'll Build It
Many decks promise that one product will become several: a payments add-on, a financing option, an insurance bundle, a marketplace on top of the software. Investors like the idea because a second product sold to the same customers can raise revenue per customer without a second acquisition cost. They also know most second products sell worse than planned. This guide looks at four companies that presented a move from one product to several, Beam Dental, Ageras, Algolia and Holdbar, and at what made each version convincing or thin: whether customers have already bought the second product, how much revenue it brings, whether it will be built or bought, and how clearly the vision is labelled as a vision.
TL;DR
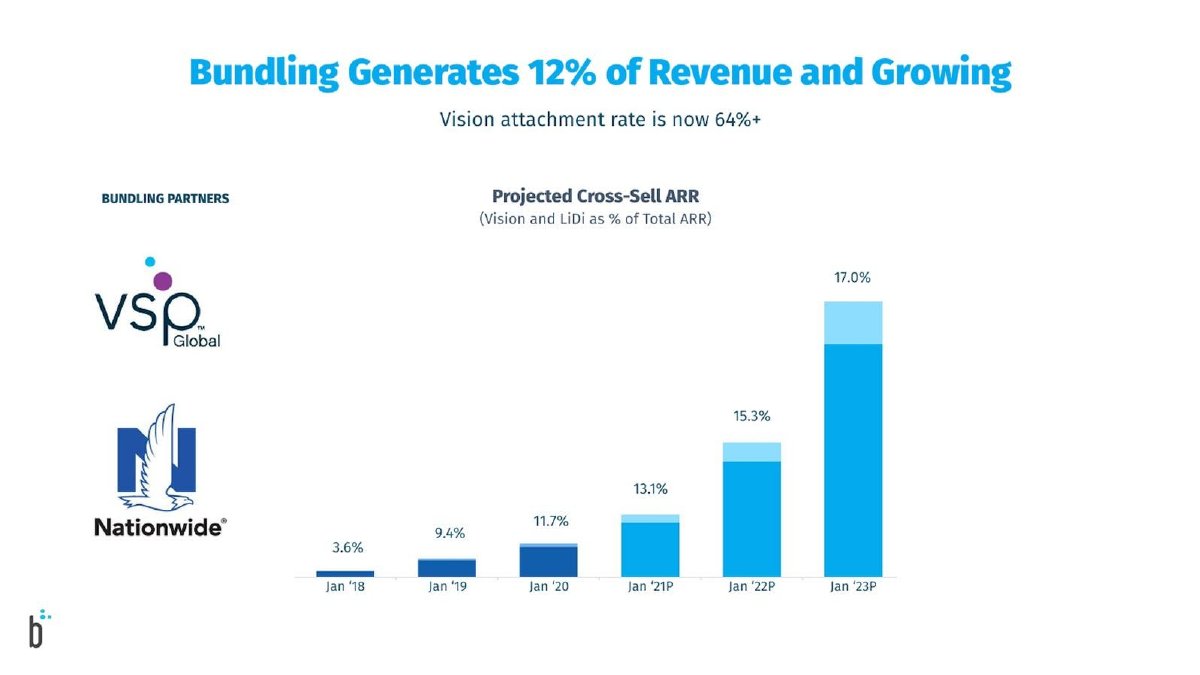
Show how many existing customers already buy the second product and what share of revenue it brings, with actual figures kept apart from forecasts. Beam Dental's slide does this: 'Bundling Generates 12% of Revenue and Growing', 'Vision attachment rate is now 64%+', with a chart that marks forecast years 'P'. If the second product doesn't exist yet, say so, say whether you'll build or buy it, and name the first one you'll launch. Ageras says plainly that it will add products 'either building or acquiring'; Holdbar labels its slide 'Multi-product vision', which is honest about what it is.
Four slides that present a second product
Each slide is read at full size. Quotes are exact.
Beam Dental business model slide — slide 12
Dental insurance for employers, bundling partners' vision and life/disability cover. Bundling slide (undated).
Beam Dental deck, slide 12. Exact stored slide matched to this analysis.
Our analysis: The most measured second-product slide in the set.
Evidence and limitation: Attach rate and revenue share given; forecasts marked 'P'; attach base and bar shading unexplained; headline 12% matches no single bar.
What a founder can adapt: State the attach base and label the bar segments.
Supporting analysis
What the deck claims: "Bundling Generates 12% of Revenue and Growing"; "Vision attachment rate is now 64%+"; cross-sell share of ARR 3.6%, 9.4%, 11.7% actual, then 13.1%, 15.3%, 17.0% projected.
Presentation choice: Shows attach rate and revenue share together, with actuals and forecasts apart.
When it does not fit: An attach rate without saying attached to what.
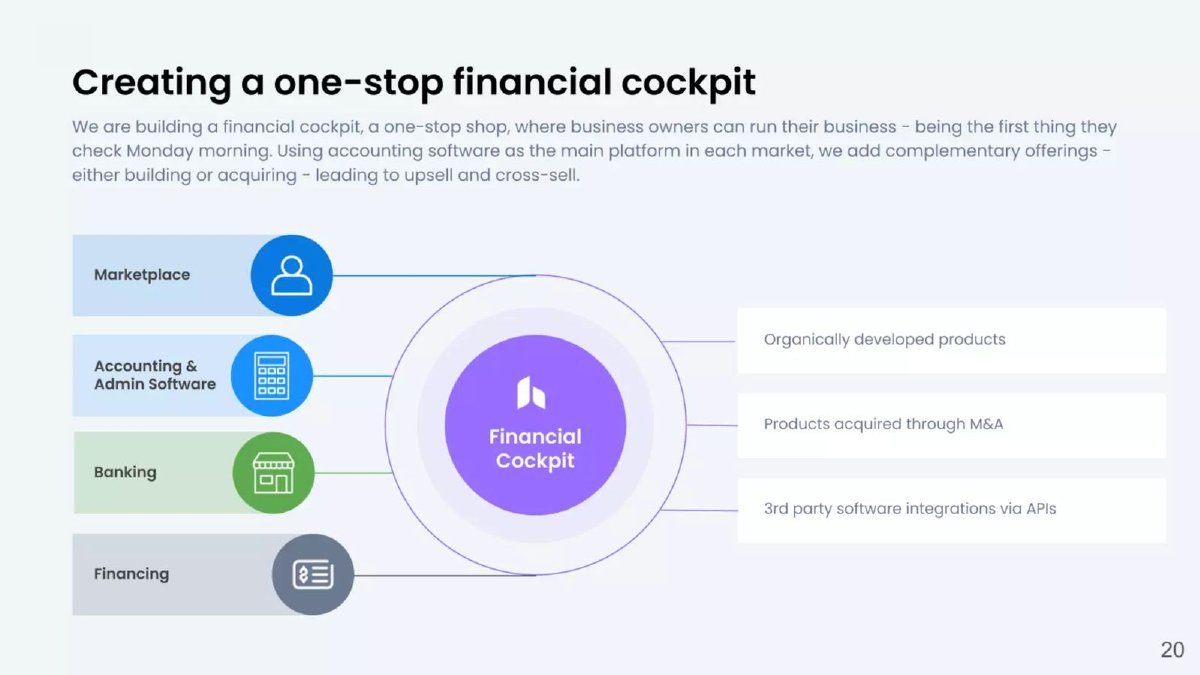
Accounting software and services for small businesses. Product strategy slide (private equity raise).
Ageras deck, slide 20. Exact stored slide matched to this analysis.
Our analysis: A clear method with no evidence of which products work.
Evidence and limitation: Anchor product and three routes named; no product marked live or planned; no attach figure.
What a founder can adapt: Mark each product live or planned and give one attach rate.
Supporting analysis
What the deck claims: "Using accounting software as the main platform in each market, we add complementary offerings - either building or acquiring - leading to upsell and cross-sell"; four products; organic, M&A and API routes.
Presentation choice: Shows how to state build, buy or partner for each new product.
When it does not fit: Identical boxes for live and planned products.
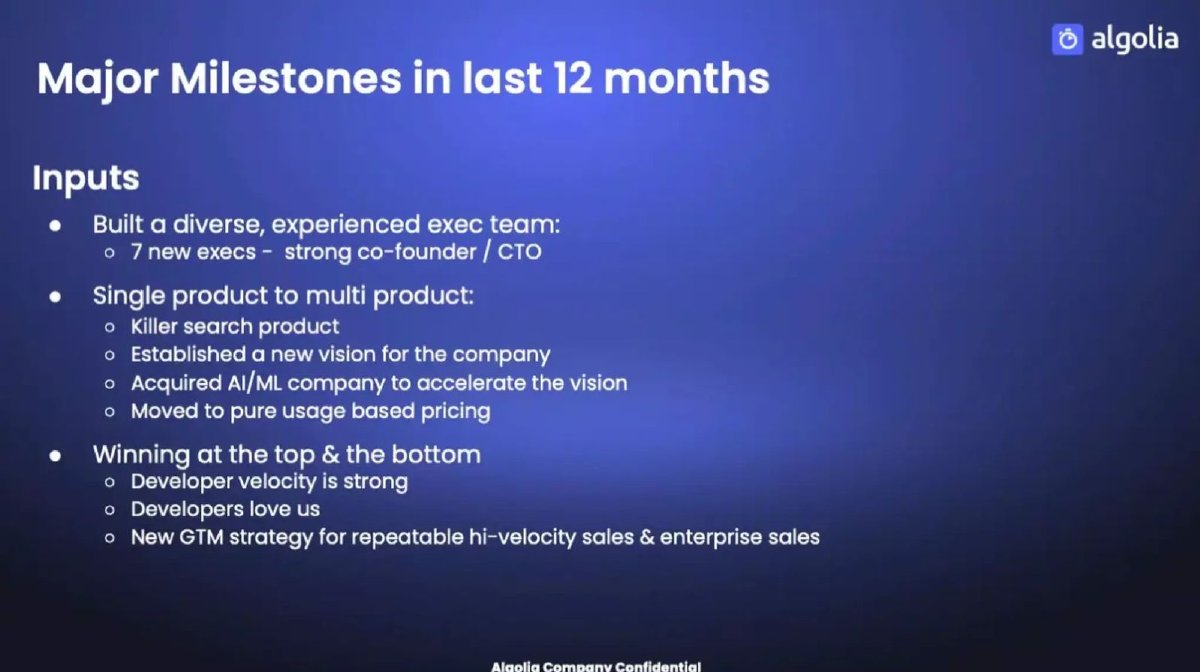
Search software for websites and apps. Milestones slide (undated).
Algolia deck, slide 14. Exact stored slide matched to this analysis.
Our analysis: Frames the move as done, but shows only the decision.
Evidence and limitation: Listed under 'Inputs'; acquisition and pricing change named; no second product, customer or revenue shown.
What a founder can adapt: Name the second product and one result from it.
Supporting analysis
What the deck claims: "Single product to multi product: Killer search product; Established a new vision for the company; Acquired AI/ML company to accelerate the vision; Moved to pure usage based pricing".
Presentation choice: Shows the pricing change that often comes with several products.
When it does not fit: A vision listed as a milestone.
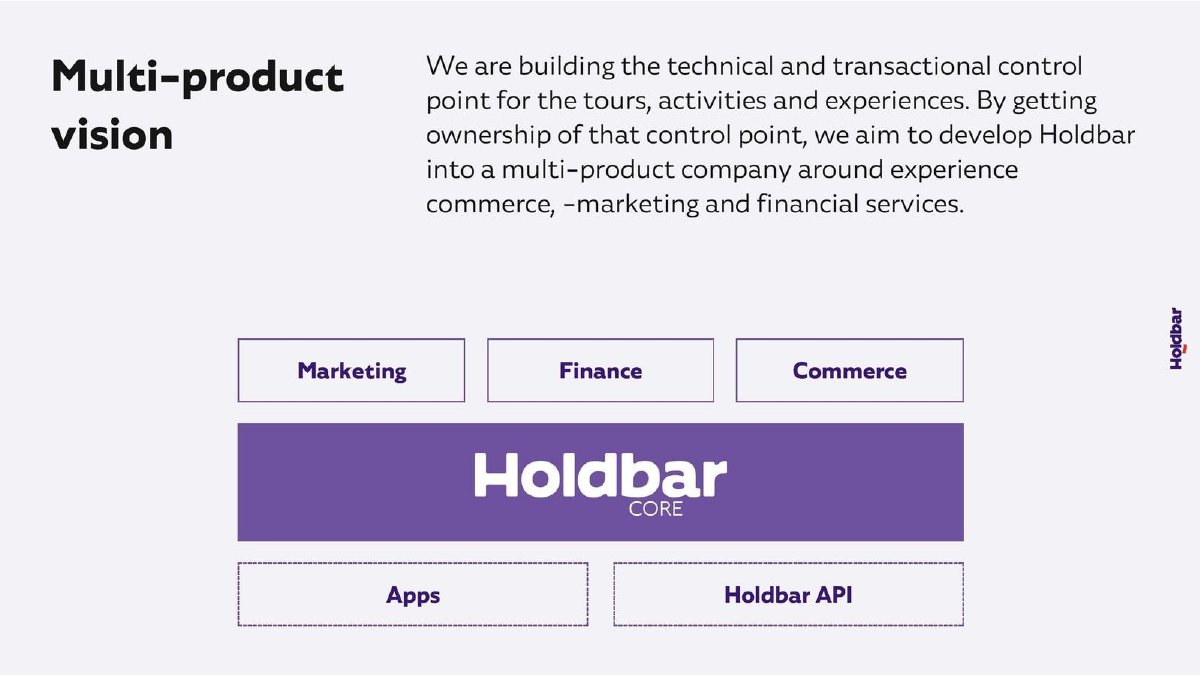
Booking software for tours and activities. Vision slide (undated).
Holdbar deck, slide 6. Exact stored slide matched to this analysis.
Our analysis: Honest about being a plan, with a sound reason and no first step.
Evidence and limitation: Labelled as a vision; reason given (control of bookings and payments); no order, timing or demand shown.
What a founder can adapt: Name the first add-on, its timing and why it comes first.
Supporting analysis
What the deck claims: "Multi-product vision"; "By getting ownership of that control point, we aim to develop Holdbar into a multi-product company around experience commerce, -marketing and financial services".
Presentation choice: Shows how to label future products clearly.
When it does not fit: Three equal boxes with no priority.
Status, attach rate, revenue share, how it's supplied, and what comes next.
Example
Live or planned shown
Attach rate
Revenue share
Build/buy/partner
Next product named
Beam Dental
Live (actuals and forecasts marked)
64%+ (vision), base unstated
About 12%
Partner (VSP, Nationwide)
No
Ageras
No
No
No
Build, acquire or integrate
No
Algolia
Decision only
No
No
Acquired a company
No
Holdbar
Labelled vision
No
No
No
No
Key Takeaways
Give the attach rate: share of customers who buy the second product.
Give its share of revenue, with actuals and forecasts marked apart.
Say how it is sold: bundled, added at signup, or sold later.
Say whether you will build, buy or partner for each product.
Name the next product, not just a set of boxes.
Label a vision as a vision, and keep it off the traction slide.
Prepare your second-product slide
Answer these before writing the slide.
Status. Which products are live, in pilot or planned?
Attach. What share of which customers buy each live add-on?
Revenue. What share of revenue do add-ons bring, by actual period?
Supply. Will you build, buy or partner for each product?
Reason. What in the core product makes customers likely to buy the next one?
Next. Which product comes first, when, and why?
Copyable framework: "[Add-on]: [x]% of revenue; [y]% of [base] buy it. Next: [product] in [period], [build/buy/partner], because [link to core]."
Illustrative example 1 — written by us
Before: "Vision attachment rate is now 64%+"
After: "64% of [new employer groups since date] add vision at signup; add-ons are [x]% of ARR."
What improved: Our illustrative rewrite of Beam Dental's line. Bracketed details are not stated on the slide.
The question this guide answers
This guide answers one founder question: we sell one product today and plan to add more for the same customers. How do I show that on a deck so it reads as a real business plan, not wishful thinking?
Our land-and-expand draft covers growing inside an account by selling more seats or usage of the same product. Our revenue mix guide covers how to show several revenue streams that already exist. Our product roadmap draft covers feature timelines. None of them answers how to present a second product sold to the same customers: how to prove they buy it, how to show its revenue honestly, and how to present one that isn't built yet. That is this guide's subject.
How we chose and read the examples
We searched extracted text across the library for 'second product', 'multi-product' and 'cross-sell', and kept slides where a private company presented moving from one product to several. Many matches came from listed companies' investor presentations or used 'cross-sell' as a single bullet among many; we set those aside. We also set aside Dame's 'Our Story' slide, which mentions a second product only as a date in a company timeline.
We kept four slides with distinct approaches: Beam Dental's bundling slide (a measured attach rate and revenue share), Ageras's 'financial cockpit' slide (a build-or-buy plan around a core product), Algolia's 'Major Milestones in last 12 months' slide (the move presented as a completed step) and Holdbar's 'Multi-product vision' slide (a plan with no evidence yet). The Beam, Algolia and Holdbar slides show no date; Ageras's slide is from a deck raising private equity money. Each was rendered from the source deck and read at full size. Any calculations are ours. We did not check any claim against outside sources.
Why investors probe second products
The economics are attractive on paper. A customer you already acquired costs little to sell to again, so revenue from a second product can come at a much lower acquisition cost than revenue from a new customer. That is why the claim appears so often.
Most of the risk is in execution. A second product needs its own build, its own support and often a different buyer inside the customer. Many companies find that customers who love the first product have no budget or need for the second. Investors want to see whether you have evidence of demand or only a diagram.
It changes what the round pays for. If the money will fund building or buying new products, the investor is backing a new bet, not just scaling a proven one. That should show in the use of funds and in the risks you name.
It can distract. Early companies that spread across several products sometimes lose focus on the one that works. A credible slide shows that the core product is growing and that the second follows from it, rather than replacing it.
A measured attach rate: Beam Dental
Beam Dental, a US dental insurance company selling to employers, has a slide headed 'Bundling Generates 12% of Revenue and Growing'. Under it: 'Vision attachment rate is now 64%+'. On the left, under 'BUNDLING PARTNERS', are the logos of VSP Global and Nationwide. On the right, a bar chart titled 'Projected Cross-Sell ARR (Vision and LiDi as % of Total ARR)' shows: Jan '18 3.6%, Jan '19 9.4%, Jan '20 11.7%, Jan '21P 13.1%, Jan '22P 15.3%, Jan '23P 17.0%. The forecast bars are marked 'P' and split into a darker and a lighter segment; the slide has no legend for the two shades.
This is the strongest example in the set because it gives the two numbers that matter. The attach rate (64%+ for vision) says that most customers offered the second product take it. The revenue share (about 12%) says how much it adds to the business. The chart shows three actual years and three forecast years, and the 'P' labels keep them apart. The partner logos explain how the second product is supplied: Beam bundles other insurers' vision and life and disability ('LiDi') cover rather than underwriting them itself. That's a sensible way to add a product without building it.
Some details are missing. 'Vision attachment rate' doesn't say attached to what: new policies, all customers, or customers offered vision. The headline's 12% doesn't match any single bar; the nearest actual figure is 11.7% for January 2020, so it may be a more recent reading. The two shades in the forecast bars go unexplained, so a reader can't tell what each represents. The forecast also grows more slowly than the actuals did: from 3.6% to 11.7% took two years, while the plan adds about 5 points over the next three. That's a cautious forecast, which is good, but the slide doesn't say why growth slows.
A build-or-buy plan around a core product: Ageras
Ageras, a European company selling accounting software and services to small businesses, has a slide headed 'Creating a one-stop financial cockpit'. The text reads: 'We are building a financial cockpit, a one-stop shop, where business owners can run their business - being the first thing they check Monday morning. Using accounting software as the main platform in each market, we add complementary offerings - either building or acquiring - leading to upsell and cross-sell.' A diagram links four products, Marketplace, Accounting & Admin Software, Banking and Financing, to a central 'Financial Cockpit'. Three boxes on the right list how products arrive: 'Organically developed products', 'Products acquired through M&A' and '3rd party software integrations via APIs'.
The useful part is the method. Ageras names the anchor product (accounting software), says the rest will be added around it, and lists three routes: build, acquire or integrate. An investor learns that the round may fund acquisitions, which is material, and that some products may be partners' rather than Ageras's own. 'The first thing they check Monday morning' is also a clear statement of the habit the company wants to own.
What the slide lacks is evidence of which products already exist and how customers use them. The four product boxes look identical, so a reader can't tell which are live, which were acquired and which are planned, or how many accounting customers also use banking or financing. Adding one column, live or planned, and one attach figure for the best-performing add-on would turn the diagram into evidence.
The move presented as a completed step: Algolia
Algolia, a search software company, has a slide headed 'Major Milestones in last 12 months' with a section 'Inputs'. One bullet is 'Single product to multi product:', with four sub-points: 'Killer search product', 'Established a new vision for the company', 'Acquired AI/ML company to accelerate the vision' and 'Moved to pure usage based pricing'. Other bullets cover seven new executives and a new go-to-market strategy.
Placing it on a milestones slide frames the move as something done, not just planned, and the sub-points show what it involved: an acquisition to get technology faster, and a pricing change. That combination is worth noting. Moving from one product to several often forces a pricing change, because customers need a way to buy several products without negotiating each one, and Algolia lists both together.
The weakness is that 'single product to multi product' is listed under 'Inputs', and the slide gives no outputs for it: no second product named, no customers using it, no revenue. 'Established a new vision' is an intention, not a milestone. A reader learns the company has decided to become multi-product and made an acquisition to do it, but not whether any customer has bought anything new. We did not look elsewhere in the deck for that evidence; this guide judges the slide on what it shows.
A vision labelled as a vision: Holdbar
Holdbar, a Danish booking software company for tours and activities, has a slide headed 'Multi-product vision'. The text reads: 'We are building the technical and transactional control point for the tours, activities and experiences. By getting ownership of that control point, we aim to develop Holdbar into a multi-product company around experience commerce, -marketing and financial services.' A diagram shows 'Holdbar CORE' as a wide bar, with three boxes above it, Marketing, Finance and Commerce, and two dashed boxes below, Apps and Holdbar API.
The label is the lesson. 'Vision' and 'we aim to' tell the reader exactly what kind of claim this is, which is more honest than presenting future products in the same style as current ones. The reasoning is also clear: because Holdbar processes its customers' bookings and payments (the 'control point'), it is in a position to sell them marketing and financial products later. That's a real argument for why a second product might work.
It's still only a plan. The three top boxes have no order, no timing and no evidence that customers want them. A stronger version would name the first add-on, say why it comes first (for example, because customers already ask for it or because the data to build it already passes through the core product), and say what it would take to launch it.
What to put on a second-product slide
Status of each product. Mark which products are live, which are in pilot and which are planned. Readers assume anything in the same style is equally real.
Attach rate. For each live add-on, the share of customers who buy it, with the base stated: all customers, new customers, or customers who were offered it.
Revenue share. What share of revenue or recurring revenue the add-ons bring, with actual periods separated from forecasts.
How it is sold. Bundled at signup, offered at renewal, sold by the same team or a new one. This says how much new sales effort is needed.
Build, buy or partner. Say how each product will exist, and if acquisitions are part of the plan, say so; it affects the use of funds.
Why customers will buy it. The best reason is a link to the core product: data it already holds, a payment it already processes, a problem customers raise in sales calls.
What comes first. One named next product, with timing and the reason it is first.
Where the slide belongs
If add-ons already bring revenue, put the attach rate and revenue share on the business model or traction slide, as Beam does. That is evidence, and it belongs with evidence.
If they are planned, put them on a vision or roadmap slide near the end, as Holdbar does, and keep them out of the traction and revenue figures. Mixing planned products into a revenue forecast without saying so is one of the most common ways a model loses credibility.
If the round will fund building or buying them, link the slide to the use of funds: how much goes to the core product, how much to new products.
A template you can adapt
Headline: '[Add-on] now [x]% of revenue; [y]% of [base] customers buy it.'
Chart: share of revenue from add-ons by period, actuals solid, forecasts marked.
How: 'Sold [bundled / at signup / at renewal] by [team]; supplied by [us / partner].'
Next: '[Product] in [period]: [reason it follows from the core product]. [Build / buy / partner].'
These four slides show how founders presented moving from one product to several. They can't show whether the second products succeeded, whether Beam's forecast was met or whether Ageras made the acquisitions it described. We did not check any figure against outside sources.
Treat them as patterns. Beam gives an attach rate and revenue share with forecasts marked, but leaves the attach base and chart shading unexplained. Ageras explains how products will be added but not which exist. Algolia frames the move as a milestone but gives no result. Holdbar honestly labels a vision and explains why it could work, but names no first step.
Common mistakes
Live and planned look alike. Future products drawn in the same style as current ones.
Attach rate without a base. A percentage with no statement of which customers it covers.
Forecast mixed with actuals. Add-on revenue projected with no marker for future periods.
Vision as a milestone. A decision to become multi-product listed as an achievement.
No first step. Several future products with no order or timing.
Diagnostic checklist
Each product marked live, pilot or planned.
Attach rate with its base.
Add-on revenue share, actuals apart.
Build, buy or partner stated.
Next product named with timing.
Frequently asked questions
Should an early-stage deck mention future products at all?
Briefly, if they explain why the market is bigger than the first product suggests. Label them as plans and keep them out of traction and revenue figures.
What is a good attach rate?
It depends on how the add-on is sold; a bundle offered at signup will attach far more often than a product sold later. Say how it is sold, then give the rate.
How we chose these examples
Corpus: published pitch deck teardowns on StartupFundraising.com. Founder-uploaded private decks are excluded.
Selection (2026-10-01): we searched extracted text for second product, multi-product and cross-sell phrases; set aside listed-company presentations, single-bullet mentions and Dame's timeline mention; kept four private-company slides with distinct approaches.
Review: the four slides were rendered from the source decks on 2026-10-01 and read in full at full size against company, deck and page number (editorial model review, with AI assistance in drafting; not human-reviewed). No claim was checked against outside sources.