Land and Expand Slide: How to Show Accounts Growing After
"Land and expand" is a common go-to-market claim. Six real slides show how to name the first sale, the next step and the accounts that already grew.
Land and Expand Slide: Show Where You Land, What You Sell Next and Accounts That Grew
"Land and expand" means starting with a small first sale to one team, then growing the account by selling to more teams, more uses or more seats. Many business software decks claim it. Few show it. Investors want to know what the first sale is, what is sold next, how long expansion takes and whether real accounts have done it. This guide uses six real slides to show the difference between a land-and-expand slide that is evidence and one that is a slogan.
TL;DR
Name what the first sale is and what it is worth, name what you sell next, and show two or three real accounts with their starting amount, current amount and the time between. Duco does this best: for three clients it gives the starting annual revenue ("£180k ARR insertion point"), the later figure ("£610k ARR within 1 year 3 months"), what was added, and a chart of each account over time.
Six land-and-expand slides, read in full
Each slide was rendered from the original deck at full size and read in full. Figures are as the slides state them; we did not check them against outside sources.
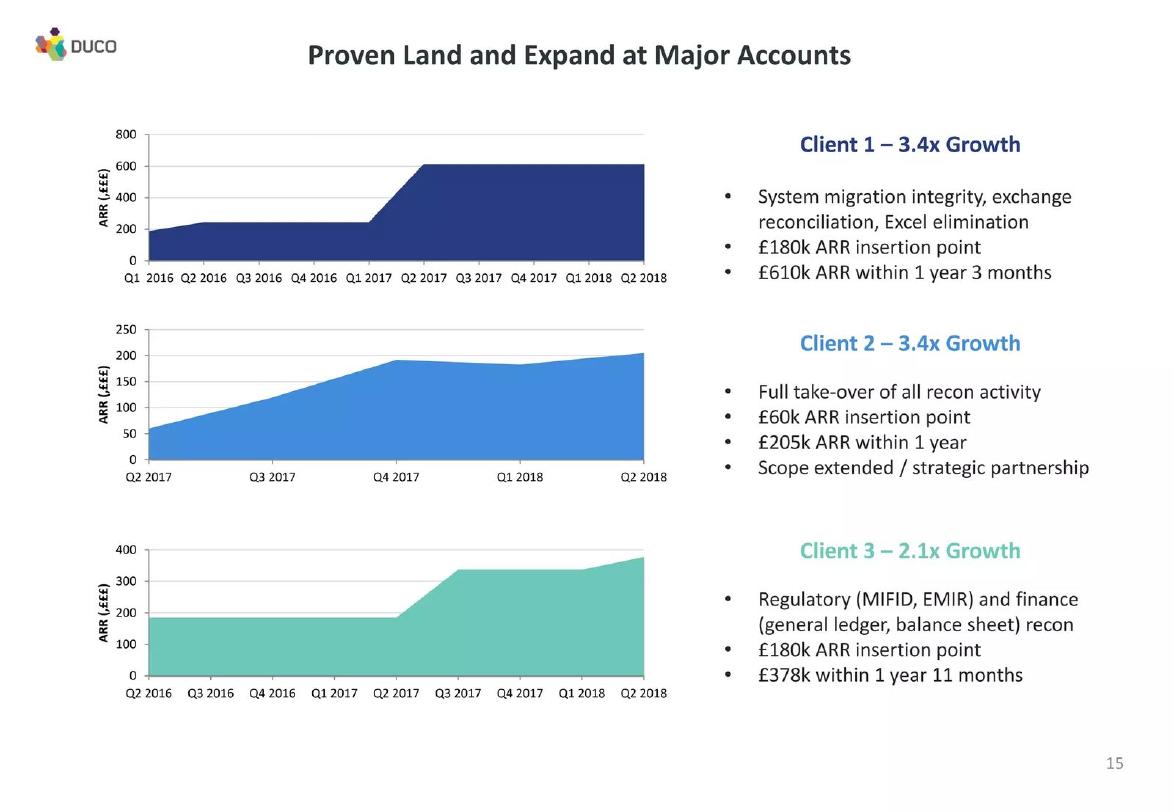
Duco go to market slide — slide 16
Data reconciliation software for financial firms. Account expansion slide.
Duco deck, slide 16. Exact stored slide matched to this analysis.
Our analysis: The clearest land-and-expand evidence in the set.
Evidence and limitation: Start, later figure and time span for three accounts, with what was added and a chart for each.
What a founder can adapt: Say how many accounts exist and how these three were chosen; keep each multiple consistent with its figures, as here.
Supporting analysis
What the deck claims: "Proven Land and Expand at Major Accounts"; "Client 1 – 3.4x Growth": "£180k ARR insertion point", "£610k ARR within 1 year 3 months"; "Client 2": "£60k ARR insertion point", "£205k ARR within 1 year"; "Client 3 – 2.1x Growth": "£180k ARR insertion point", "£378k within 1 year 11 months".
Presentation choice: The reader can check the growth and see that it came from new uses in the same firm.
When it does not fit: Showing only the best accounts without saying they are the best.
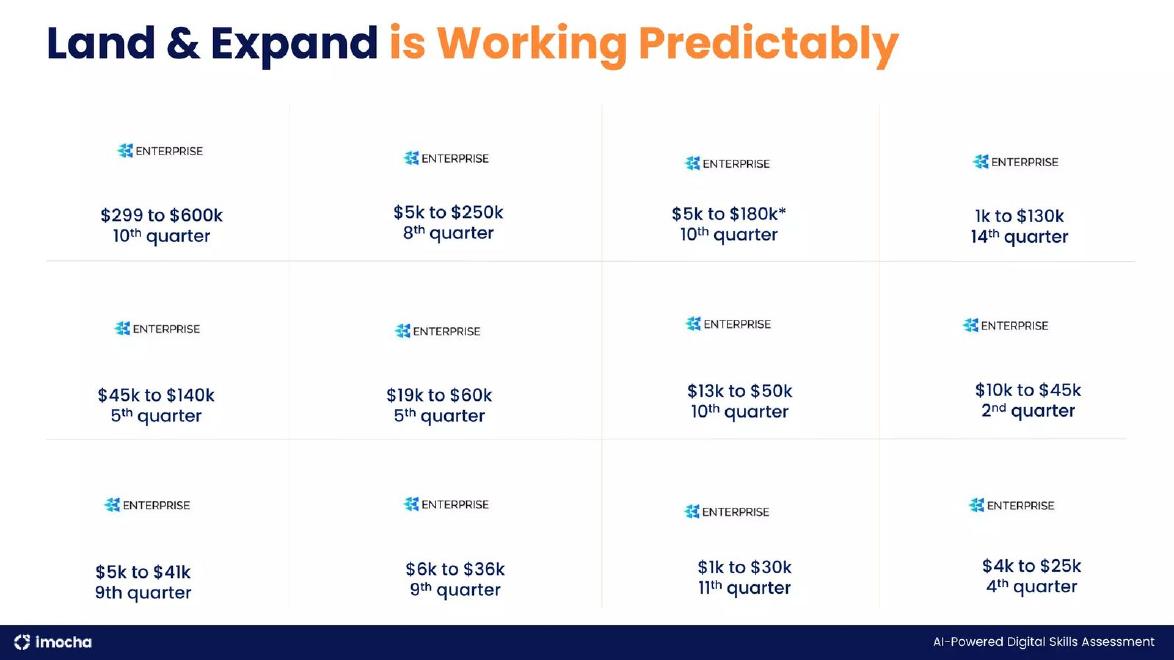
iMocha deck, slide 8. Exact stored slide matched to this analysis.
Our analysis: Breadth of examples, but no definition of the figures and no note on what was added.
Evidence and limitation: Twelve accounts with start and current amounts and a quarter count.
What a founder can adapt: Say what the amounts measure, what "quarter" counts from, and what each account added.
Supporting analysis
What the deck claims: "Land & Expand is Working Predictably"; twelve "ENTERPRISE" boxes, e.g. "$299 to $600k, 10th quarter", "$5k to $250k, 8th quarter", "$5k to $180k*, 10th quarter", "$10k to $45k, 2nd quarter".
Presentation choice: Many accounts make the pattern look less like one lucky customer.
When it does not fit: An asterisk with no note, and "Predictably" without the share of all accounts that grew.
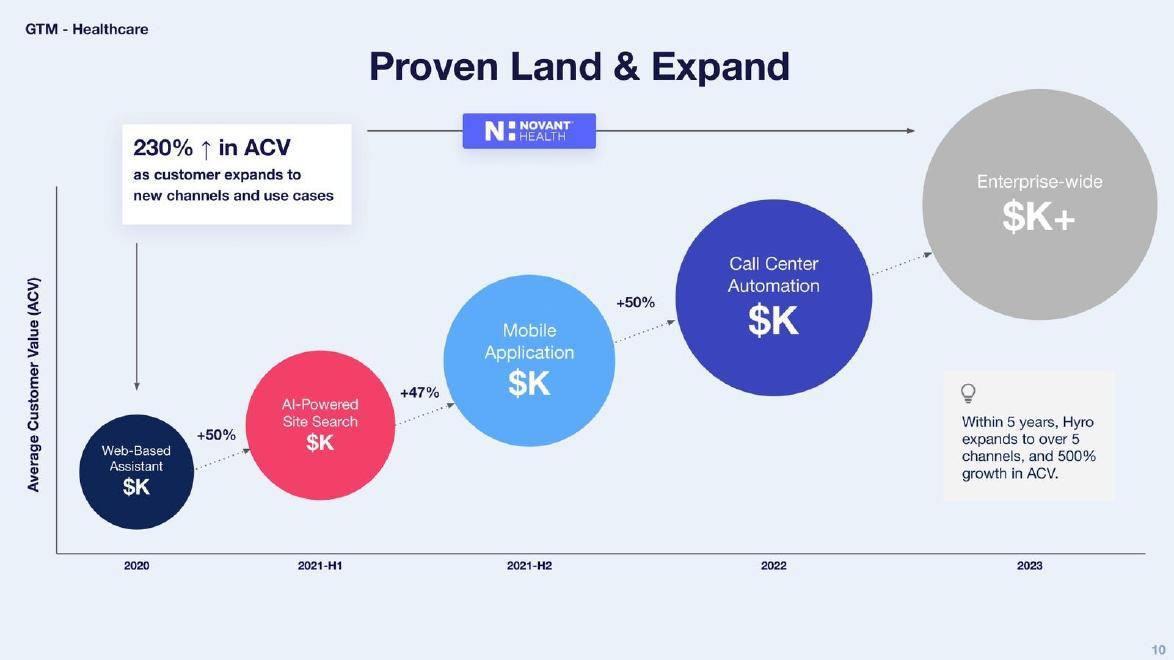
Hyro deck, slide 10. Exact stored slide matched to this analysis.
Our analysis: The clearest picture of what is sold next; amounts hidden and future drawn like past.
Evidence and limitation: Named products in order with dates and percentage increases for one named customer.
What a founder can adapt: Give at least the starting amount and draw the forecast step differently.
Supporting analysis
What the deck claims: "Proven Land & Expand"; Novant Health path: "Web-Based Assistant" (2020), "AI-Powered Site Search" (+50%), "Mobile Application" (+47%), "Call Center Automation" (+50%), "Enterprise-wide $K+" (2023); "230% ↑ in ACV"; "Within 5 years, Hyro expands to over 5 channels, and 500% growth in ACV."
Presentation choice: Shows the sales motion step by step.
When it does not fit: Labelling one customer's path "Average Customer Value".
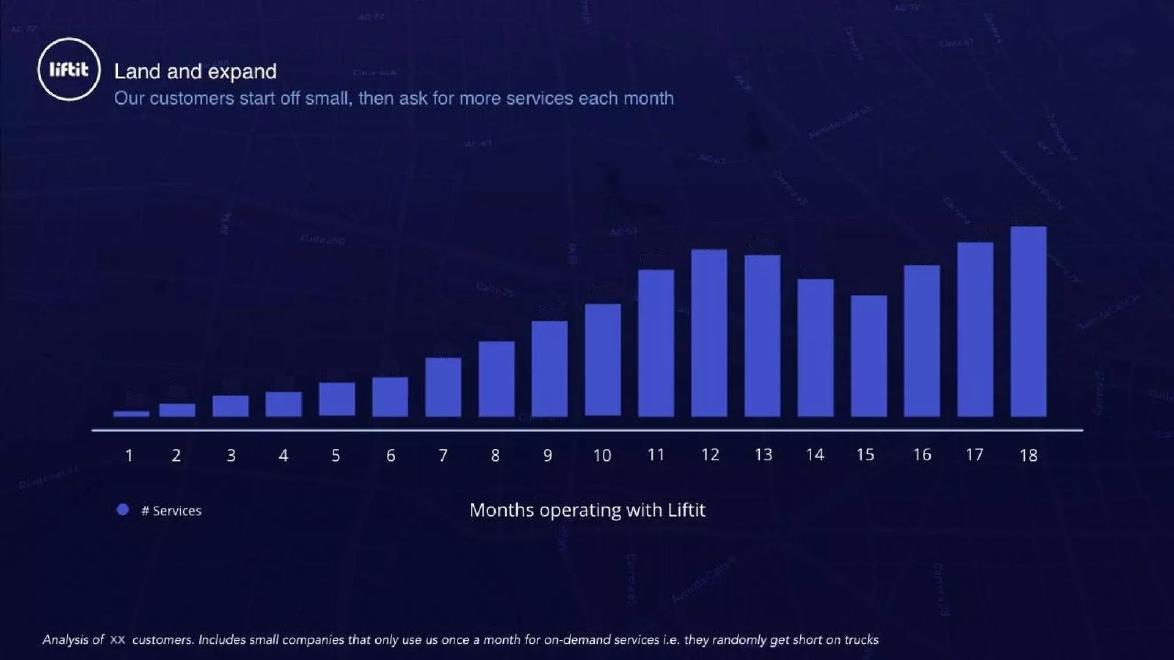
Trucking for businesses in Latin America. Expansion chart.
Liftit deck, slide 9. Exact stored slide matched to this analysis.
Our analysis: The right method, left unfinished: no count and no values.
Evidence and limitation: An average across customers by tenure, with an honest note on who is included.
What a founder can adapt: Fill in the count, label two or three bars, and say how departed customers were treated.
Supporting analysis
What the deck claims: "Land and expand: Our customers start off small, then ask for more services each month"; "# Services" by "Months operating with Liftit" 1 to 18; "Analysis of XX customers. Includes small companies that only use us once a month for on-demand services".
Presentation choice: Shows the typical path, not the best accounts.
When it does not fit: Placeholder text such as "XX" left in a shared deck.
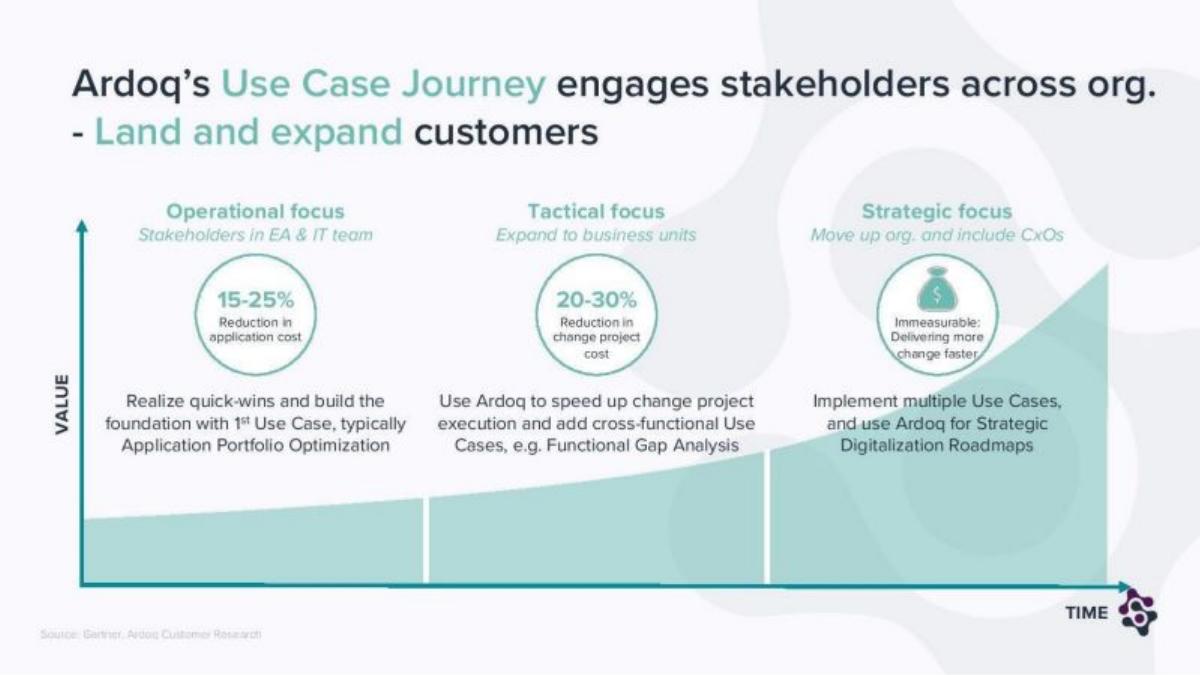
Ardoq deck, slide 5. Exact stored slide matched to this analysis.
Our analysis: A useful description of the intended path, not proof that accounts follow it.
Evidence and limitation: A named buyer at each stage; customer savings, not Ardoq revenue.
What a founder can adapt: Add one real account with its revenue at each stage.
Supporting analysis
What the deck claims: "Ardoq's Use Case Journey engages stakeholders across org. - Land and expand customers"; "Operational focus: Stakeholders in EA & IT team" ("15-25% Reduction in application cost"); "Tactical focus: Expand to business units" ("20-30%"); "Strategic focus: Move up org. and include CxOs" ("Immeasurable"); "Source: Gartner, Ardoq Customer Research".
Presentation choice: Shows how the buyer changes as the account grows.
When it does not fit: Ending the path on "Immeasurable".
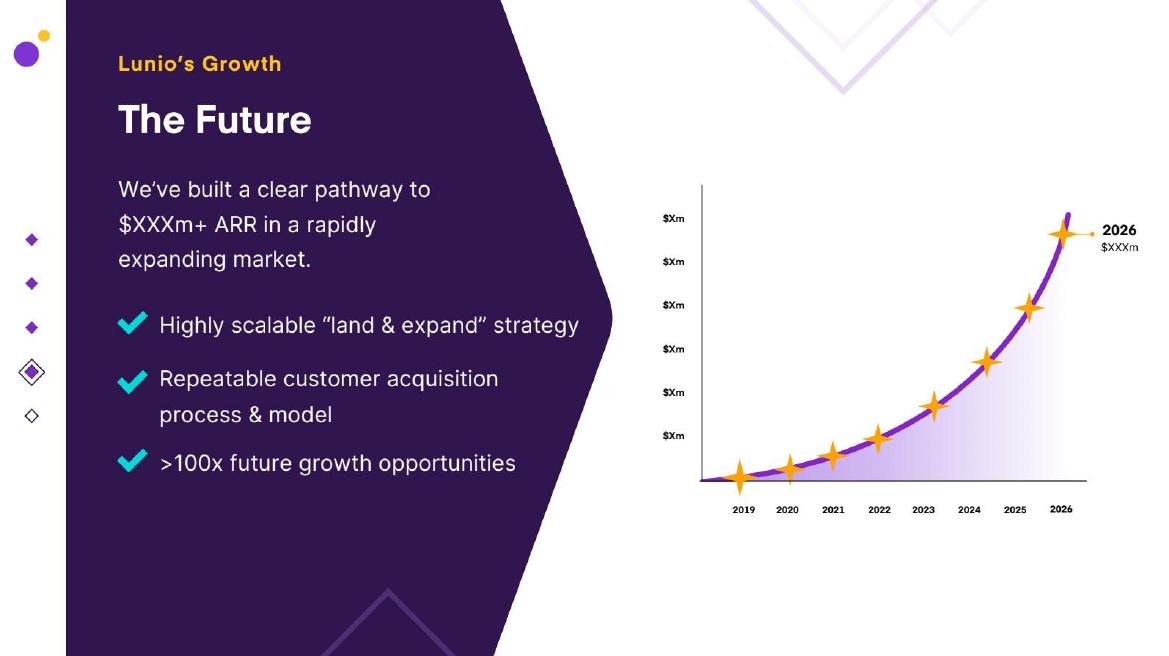
Lunio deck, slide 10. Exact stored slide matched to this analysis.
Our analysis: A warning: land and expand as a slogan.
Evidence and limitation: None: a bullet beside a forecast curve with figures removed.
What a founder can adapt: Point to an account that expanded, or drop the bullet.
Supporting analysis
What the deck claims: "The Future"; "We've built a clear pathway to $XXXm+ ARR"; "Highly scalable "land & expand" strategy"; ">100x future growth opportunities"; curve 2019 to 2026 with "$Xm" axis values.
Presentation choice: Shows what investors see when the claim has no path or accounts.
When it does not fit: Claiming land and expand on a forecast slide.
Whether each slide names the first sale, the next step, real accounts, how typical they are, and keeps past apart from future.
Example
First sale named
Next step named
Real accounts
How typical
Past vs future
Duco
Yes, with amount
Per account
3, with figures
No
Past only
iMocha
Amount only
No
12, with figures
No
Past only
Hyro
Product, no amount
Yes, in order
1, % only
No
Mixed
Liftit
No
No
Average, no values
Count left blank
Past only
Ardoq
Yes, team and use
Yes, by buyer
No
No
Plan
Lunio
No
No
No
No
Future only
Key Takeaways
Name the first sale: product, team and starting amount.
Name what is sold next, in order.
Show real accounts: start, now, and months between.
Say how typical those accounts are.
A forecast curve is not evidence of expansion.
Build your land-and-expand slide
Answer each prompt before writing "land and expand".
Land. What is the first sale: which product, to which team, for how much?
Expand. What do you sell next, and in what order?
Accounts. Which two or three accounts have expanded: start, now, months between, what was added?
Base. Out of how many accounts, and what does the typical account look like?
Future. Which steps are planned, and how will you show them differently?
Copyable framework: We land with [product] for [team] at [amount]. Next: [step 2], then [step 3]. [Account A]: [start] to [now] in [months], added [what]. [n] of [total] accounts have expanded; median [multiple] in [months].
Illustrative example 1 — written by us
Before: "Highly scalable land and expand strategy."
After: "We land with payroll checks for HR at $12k a year, then add hiring checks and finance. Three of our 9 accounts have expanded; the largest went from $12k to $70k in 14 months by adding two teams."
What improved: Our illustrative rewrite; the figures are invented for the example. It names the land and the path, gives one account's growth and says how typical it is.
The question this guide answers
Founders selling to businesses ask how to show investors that customers grow after the first sale. The net revenue retention guide covers the summary figure: how much revenue a group of customers brings in a year later. The sales cycle guide covers how long the first sale takes. The time-to-value guide covers how fast a customer sees results. None of them covers the slide that explains the path: where you enter an account, what you sell next, and which accounts have followed that path.
The distinction matters. A net retention figure says expansion happens on average. A land-and-expand slide says how it happens, which tells an investor whether the sales team can repeat it. An investor who sees "land and expand" as a bullet with no path and no accounts will treat it as a hope. One who sees three named steps and three accounts that took them will treat it as a sales plan.
How we chose and read the examples
We searched saved slide text in the teardown library for "land and expand" and "land & expand". We left out listed companies, investment fund decks, and slides where the phrase appeared only as one bullet among many. From the remaining slides we chose the smallest set that shows the range: account-by-account evidence, a table of accounts, one account's path, an average across customers, a qualitative path, and a forecast with no evidence.
Six slides from six startup decks remained: Duco (data reconciliation software for financial firms), iMocha (skills testing software), Hyro (AI assistants for healthcare), Liftit (trucking for businesses in Latin America), Ardoq (enterprise architecture software) and Lunio (ad-fraud protection). Each slide was rendered from the original deck at full size and read in full; Ardoq's small labels were enlarged further. Quotes and figures are the slides' own. We did not check them against outside sources.
The strongest pattern: real accounts with a start, a finish and what was added
Duco titles its slide "Proven Land and Expand at Major Accounts". It shows three area charts of annual recurring revenue (in thousands of pounds) by quarter, each beside a short case. "Client 1 – 3.4x Growth": "System migration integrity, exchange reconciliation, Excel elimination"; "£180k ARR insertion point"; "£610k ARR within 1 year 3 months". "Client 2 – 3.4x Growth": "Full take-over of all recon activity"; "£60k ARR insertion point"; "£205k ARR within 1 year"; "Scope extended / strategic partnership". "Client 3 – 2.1x Growth": regulatory and finance reconciliation; "£180k ARR insertion point"; "£378k within 1 year 11 months".
Four things make this slide strong. Each account has a starting amount, a later amount and the time between, so the reader can check the growth multiple. The bullets say what was added, so the reader can see that expansion came from new uses inside the same firm, not price rises. The charts show the shape: for Client 1 and Client 3, revenue was flat for about a year and then stepped up, which tells an investor expansion comes in large jumps, not steady creep. And "insertion point" names the land clearly.
One thing is missing. The clients are not named, which is common and acceptable, but the slide does not say how many accounts exist in total or how these three were chosen. If they are the three best of fifty, the slide shows what is possible, not what is typical. The growth multiples do match the figures (£180k to £610k is 3.4x), which a careful reader will check. One line such as "3 of our 12 largest accounts; median account grew 1.8x in 18 months" would answer it.
Many accounts at once, without saying what was added
iMocha titles its slide "Land & Expand is Working Predictably". It is a grid of twelve boxes, each headed "ENTERPRISE" with a small logo, and each giving a start and current figure with a quarter: "$299 to $600k, 10th quarter"; "$5k to $250k, 8th quarter"; "$5k to $180k*, 10th quarter"; "1k to $130k, 14th quarter"; down to "$4k to $25k, 4th quarter" and "$10k to $45k, 2nd quarter".
Showing twelve accounts is better than showing one; it makes the pattern look less like a single lucky customer. The quarter figure gives a time span for each. The growth is dramatic: several accounts started at a few thousand dollars and reached six figures.
But the slide leaves key questions open. It does not say what the figures measure, annual contract value or total spend to date, or what "10th quarter" counts from. It does not say what was added: more tests, more seats, more departments. One figure carries an asterisk with no note on the slide. Every box reads "ENTERPRISE" instead of a name or an industry, so the reader cannot tell whether these are twelve different kinds of customer or one kind. And "Predictably" claims a repeatable pattern; a grid of chosen accounts cannot show that without the share of all accounts that grew.
One named account's path, with amounts hidden
Hyro, under the label "GTM - Healthcare", titles its slide "Proven Land & Expand". It follows one named customer, Novant Health, across a timeline from 2020 to 2023. Bubbles grow along an axis labelled "Average Customer Value (ACV)": "Web-Based Assistant" (2020), "AI-Powered Site Search" (2021-H1, +50%), "Mobile Application" (2021-H2, +47%), "Call Center Automation" (2022, +50%) and a grey "Enterprise-wide" bubble for 2023. A box reads "230% ↑ in ACV as customer expands to new channels and use cases", and a note says "Within 5 years, Hyro expands to over 5 channels, and 500% growth in ACV."
This is the clearest picture in the set of what is sold next. Each step is a named product, in order, with a date and a percentage increase. An investor can see the sales motion: start with a website assistant, then add search, mobile and the call centre.
Three things weaken it. Every amount reads "$K", so the reader never learns the size of the first sale or the current account. The axis says "Average Customer Value" but the path follows one customer, so it is unclear whether the percentages describe Novant Health or an average. And the grey 2023 bubble and the five-year note are forecasts drawn in the same style as past results. Showing the real figures, or at least the starting figure, and drawing the future step in a clearly different style would fix all three.
An average across customers, with the count left blank
Liftit, which arranges trucks for businesses, titles its slide "Land and expand" with the subtitle "Our customers start off small, then ask for more services each month". A bar chart shows "# Services" against "Months operating with Liftit" from 1 to 18. The bars rise from very small in month 1 to their highest in month 18, with a dip in months 14 and 15.
Using an average across customers by month of tenure is the right idea; it shows the typical path rather than the best accounts. The footnote is honest about the base: "Includes small companies that only use us once a month for on-demand services i.e. they randomly get short on trucks."
But the footnote begins "Analysis of XX customers": the count was never filled in. The bars have no values, so the reader cannot tell whether a customer goes from 2 services to 40 or from 20 to 60. And the slide does not say whether customers who stopped using Liftit are included; if they drop out, later months show only the survivors, which flatters the curve. A count, values on two or three bars, and a note on how departed customers were treated would make this a strong slide.
A qualitative path through the organisation
Ardoq titles its slide "Ardoq's Use Case Journey engages stakeholders across org. - Land and expand customers". It shows three stages along a rising curve of "VALUE" over "TIME". "Operational focus: Stakeholders in EA & IT team", with "15-25% Reduction in application cost" and "Realize quick-wins and build the foundation with 1st Use Case, typically Application Portfolio Optimization". "Tactical focus: Expand to business units", with "20-30% Reduction in change project cost". "Strategic focus: Move up org. and include CxOs", with "Immeasurable: Delivering more change faster". A faint note reads "Source: Gartner, Ardoq Customer Research".
This slide does something the others do not: it names who the buyer is at each stage. The land is the enterprise architecture and IT team; the expansion is into business units and then senior executives. That tells an investor how the sales relationship has to change as the account grows.
What it cannot establish is that any account has made the journey. The percentages are savings for the customer, not revenue for Ardoq, and they are ranges with a shared source line that mixes an analyst firm with Ardoq's own research. The last stage is labelled "Immeasurable". There is no account count, no revenue per stage and no time span. As a description of the intended path it is useful; as proof of land and expand it needs at least one account and its revenue at each stage.
Warning: land and expand as a bullet beside a forecast
Lunio, under "Lunio's Growth", titles its slide "The Future". It says "We've built a clear pathway to $XXXm+ ARR in a rapidly expanding market." Three ticks follow: "Highly scalable "land & expand" strategy", "Repeatable customer acquisition process & model" and ">100x future growth opportunities". On the right, a curve with stars rises from 2019 to 2026, with every axis value shown as "$Xm" and the end point "2026 $XXXm".
The slide claims land and expand without describing what is landed, what is expanded or any account that grew. The figures have been removed, likely for sharing, which leaves a curve with no scale; most of it is the future. ">100x future growth opportunities" is not something a reader can check.
If a deck has evidence of expansion elsewhere, this slide should point to it. If it does not, the bullet is better removed than left as a claim with nothing behind it.
What a land-and-expand slide needs to show
Across the six slides, a convincing slide has five parts. The land: what the first sale is and what it is worth. Duco gives this as an "insertion point"; iMocha gives starting amounts; Hyro names the first product but hides the amount. The expand: what is sold next, in order. Hyro and Ardoq show this best; Duco gives it per account.
The evidence: real accounts with a start, a later figure and the time between. Duco and iMocha give this. The base: how typical those accounts are, out of how many. Liftit tries, with an average across customers, but leaves the count blank; no slide in the set says how its examples were chosen. And the separation of past from future: Hyro mixes them, Lunio is almost entirely future.
Few slides have all five. A founder who adds the base, one line on how many accounts have expanded and what the typical account looks like, will have a stronger slide than any in this set.
If you have only a few customers
Early companies often have one or two accounts that grew and many that have not had time to. That is fine to show, as long as the slide is honest about it. Name the one account that expanded, give its start and current figure and what was added, and say how many other accounts are still at the first stage and how long they have been customers.
If no account has expanded yet, describe the intended path as a plan, as Ardoq does, and give the nearest early sign: pilots in a second team, requests for another product, or a contract that already includes an option to add more. Do not title it "Proven".
Common mistakes
Slogan without a path. Name the first sale and what comes next.
Best accounts presented as typical. Say how many accounts exist and how many expanded.
Figures undefined. Say whether amounts are annual value or total spend, and what the time count starts from.
Forecast drawn like history. Use a different style for planned steps.
Placeholders left in. Replace "XX" and unexplained asterisks before sharing.
Diagnostic checklist
First sale named, with an amount.
Next steps named, in order.
Two or three accounts: start, now, months, what was added.
How many accounts, and how typical the examples are.
Past and planned shown differently.
Frequently asked questions
Is a net revenue retention figure enough to show land and expand?
It shows expansion happens on average. A land-and-expand slide adds how it happens: the first sale, the next steps and real accounts.
Can I hide customer names and amounts?
Names, yes. Hide amounts only if you must; at least give the start and current figure or the multiple and time span.
Should I show my best accounts?
You can, but say they are the best and give the typical account too.
What if no account has expanded yet?
Describe the intended path as a plan and give the nearest early sign, such as a pilot in a second team. Do not call it proven.
How we chose these examples
Corpus: published pitch deck teardowns on StartupFundraising.com. Founder-uploaded private decks are excluded.
Selection (2026-10-01): we searched extracted slide text for "land and expand" phrasing, excluded listed-company and fund decks and passing mentions, and kept the smallest set of six slides from six startup decks that covers the range of approaches.
Review: all six slides were rendered from the source decks at full size on 2026-10-01 and read in full against company, deck and page number; Ardoq's small labels were enlarged further (editorial model review, with AI assistance in drafting). No person has yet completed a human review. Figures were not checked against outside sources.