Ardoq’s 14-slide deck, used for its 2022 Series D round, is a masterclass in enterprise software positioning. The narrative centers on the shift from manual, consultant-heavy Enterprise Architecture (EA) to automated, data-driven platforms. The deck relies heavily on external validation, citing Gartner and Forrester multiple times to establish market leadership. With a reported $11.1M ARR as of Q3 2021 and 82% year-over-year growth, the financials support a robust 'land and expand' model. While the deck lacks a traditional team slide or a specific 'ask' for the $125M round, it compensates wit…
Key takeaways
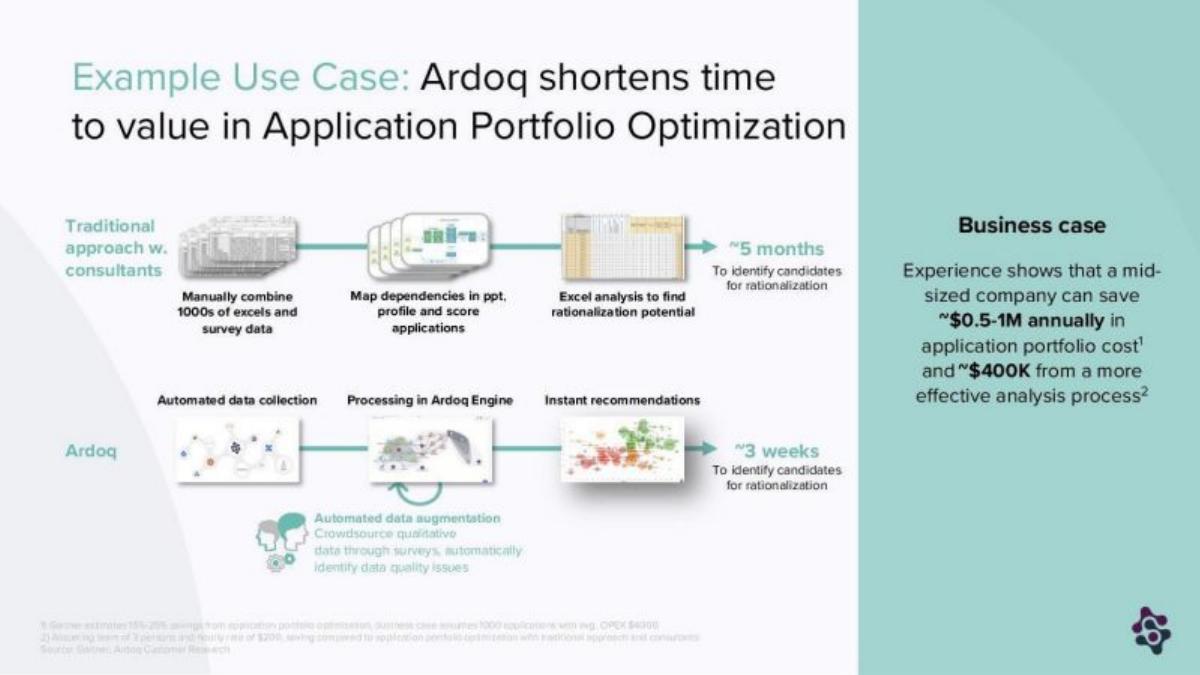
- Ardoq claims a significant efficiency advantage, reducing the time to identify rationalization candidates from 5 months to 3 weeks (Slide 4).
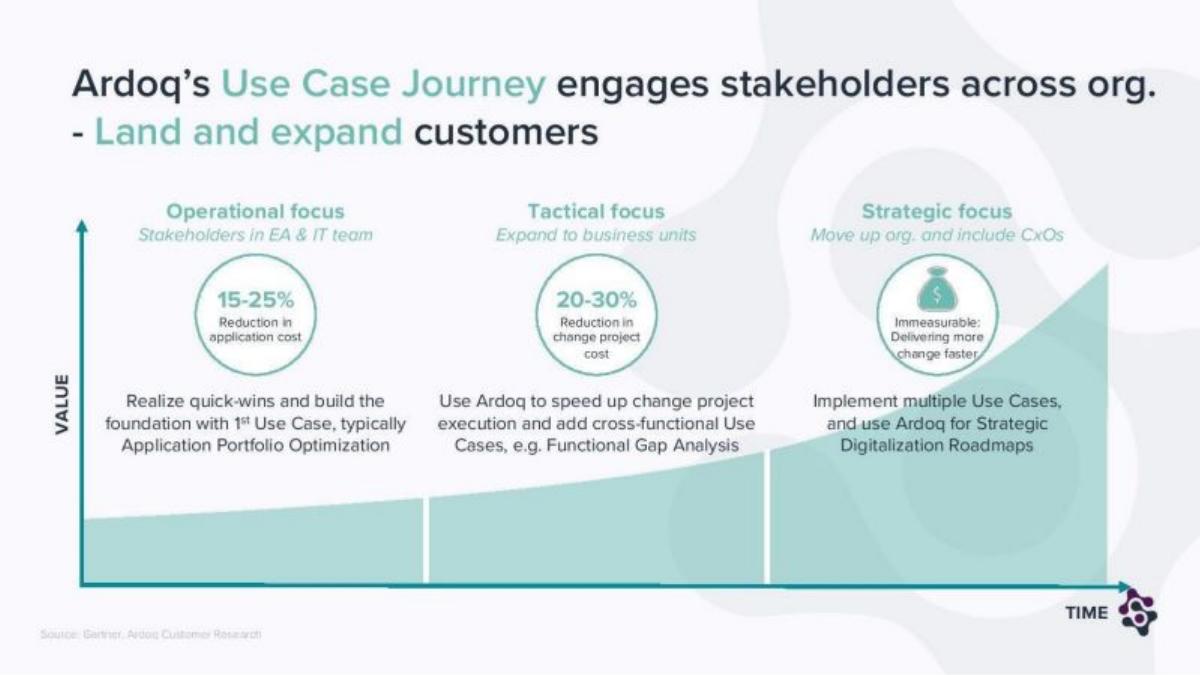
- The company utilizes a 'land and expand' journey that moves from operational application cost reduction (15-25%) to strategic digitalization roadmaps (Slide 5).
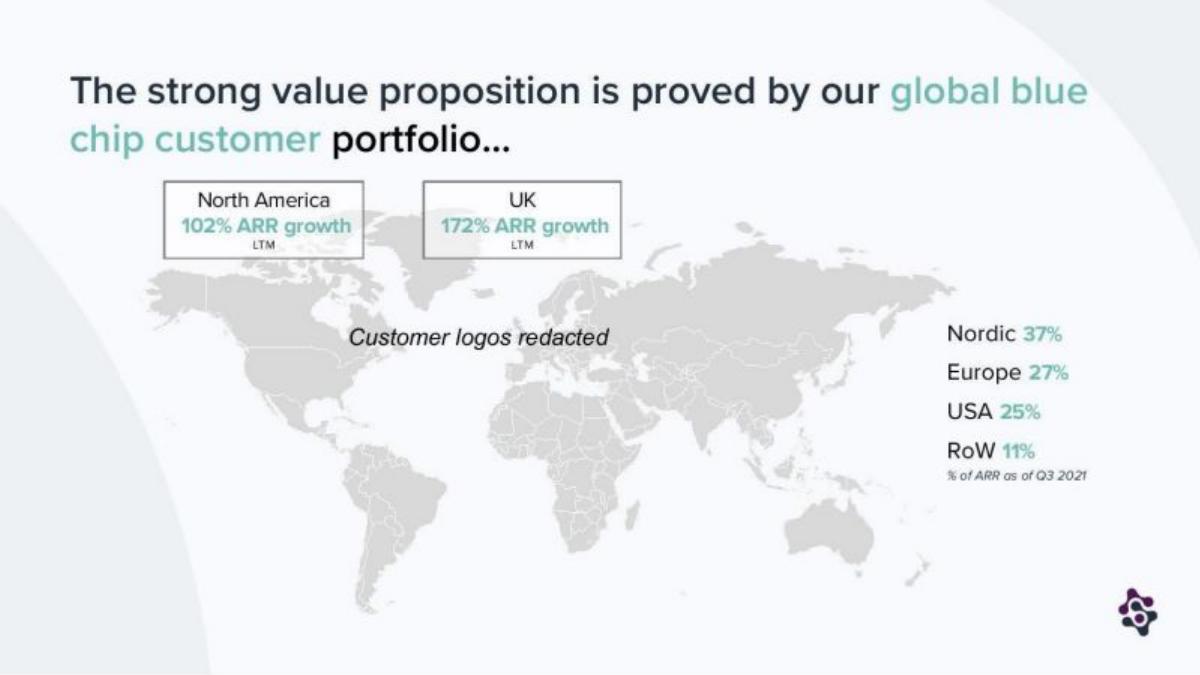
- Geographic ARR distribution shows a strong presence in the Nordics (37%) and Europe (27%), with rapid growth in the UK at 172% LTM (Slide 6).
- Third-party validation is a core theme, with Ardoq being named a Gartner Peer Insights Customers' Choice in 2021 (Slide 7).
- The deck positions Ardoq as a 'Digital Native' platform, contrasting it against 'Legacy EA Platforms' from the 1990s and 2000s (Slide 8).
- Financial highlights from Q3 2021 include an 82% ARR growth YoY, a 5.5x LTV/CAC ratio, and an 83% gross margin (Slide 12).
- The market opportunity is framed by a 10-12% CAGR in the EA market, with adjacent opportunities in Cyber Security ($150B) and GRC ($36B) (Slide 11).
- The technical differentiator is the 'Ardoq Intelligence Graph,' which supports automated data collection and various add-on modules (Slide 9).
Introduction and Vision
Slide 1: Title Slide
The deck opens with a standard title slide featuring the Ardoq logo and the name of the presenter, Erik Bakstad, Co-Founder & CEO. The design is clean, utilizing the company's brand colors of teal and purple with abstract geometric shapes.
Slide 2: The Hook
Slide 2 uses a minimalist approach to address the psychological barrier to corporate change. The text reads: "We Love Change. Said no one. Ever. We are here to change that." This slide serves as a thematic bridge to the problem of digital transformation, which is often hindered by the complexity of legacy systems and organizational inertia.
The Solution and Business Case
Slide 3: The SaaS Platform for Digital Transformation
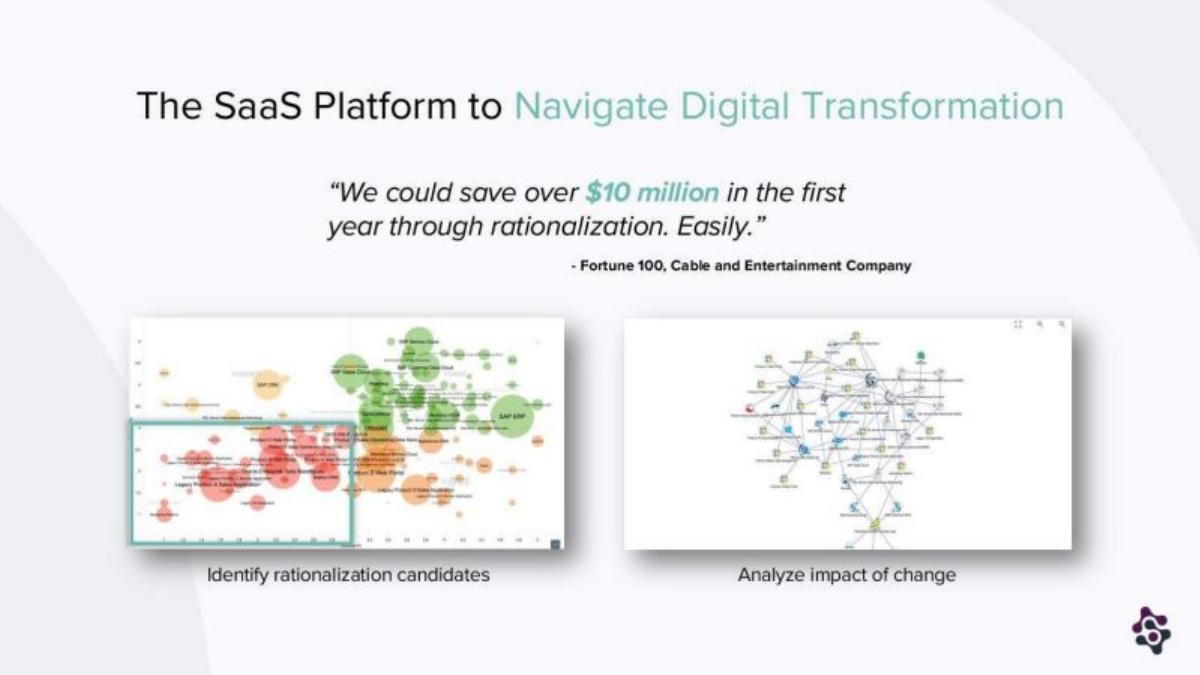
Slide 3 defines Ardoq as "The SaaS Platform to Navigate Digital Transformation." It includes a powerful testimonial from a Fortune 100 Cable and Entertainment Company claiming they could "save over $10 million in the first year through rationalization. Easily." Two screenshots demonstrate the product's interface: one for identifying rationalization candidates and another for analyzing the impact of change. This slide immediately anchors the product in high-dollar ROI.
Slide 4: Example Use Case
This slide provides a direct comparison between the "Traditional approach w. consultants" and the "Ardoq" approach. The traditional method involves manually combining thousands of excels and mapping dependencies in PowerPoint, taking approximately 5 months. Ardoq claims to automate data collection and processing via its engine, reducing the time to "~3 weeks." The business case notes that a mid-sized company can save "~$0.5-1M annually in application portfolio cost" and "~$400K from a more effective analysis process."
Slide 5: The Use Case Journey
Slide 5 illustrates the 'Land and Expand' strategy. The journey is divided into three stages:
Operational focus: 15-25% reduction in application cost, targeting EA & IT teams. · Tactical focus: 20-30% reduction in change project cost, expanding to business units. · Strategic focus: Described as 'Immeasurable' value, moving up the organization to include CxOs for strategic digitalization roadmaps.
This progression shows investors how Ardoq increases its footprint and stickiness within a customer over time.
Market Validation and Traction
Slide 6: Global Blue Chip Portfolio
Slide 6 displays a world map showing ARR growth by region. Key figures include 102% ARR growth LTM in North America and 172% ARR growth LTM in the UK. The regional breakdown of ARR as of Q3 2021 is: Nordic (37%), Europe (27%), USA (25%), and Rest of World (11%). Although customer logos are redacted in this version, the slide emphasizes a global, diversified revenue base.
Slide 7: Customer Feedback
This slide focuses entirely on third-party validation. It highlights Ardoq's position as a "Gartner Peer Insights Customers' Choice 2021" and shows a rating of 4.6 stars from 85 reviews. By placing themselves in the top-right quadrant of the 'Voice of the Customer' chart, Ardoq reinforces its reputation for user satisfaction relative to competitors like LeanIX and BizzDesign.
Slide 8: Market Fragmentation
Slide 8 argues that the EA-tools market is fragmented and that "digital native platforms with a SaaS business model and data driven approach" will be the new leaders. A timeline contrasts 'Legacy EA Platforms' (launched in the 1990s and 2000s) like MEGA and Software AG against 'Digital Native EA Platforms' (2010s) like Ardoq and LeanIX. This positioning frames Ardoq as the modern alternative to aging incumbents.
Technology and Market Opportunity
Slide 9: Technical Differentiation
Slide 9 details the "Ardoq Intelligence Graph," described as an "ultra-flexible platform built on graph database." The architecture includes add-on modules (Insights generator, Engagement Platform, Scenarios) and automated data collection workflows. Integrations with AWS, ServiceNow, Excel, Docker, Zapier, and Azure are highlighted to show how the platform fits into existing enterprise ecosystems.
Slide 10: Analyst Recognition
Slide 10 doubles down on analyst reports, showing Ardoq's position in the Forrester Wave (March 2021) and the Gartner Magic Quadrant (November 2021). In both charts, Ardoq is highlighted in a red box, situated among the leaders and strong performers. This slide is intended to de-risk the investment by showing that the industry's most respected gatekeepers have vetted the technology.
Slide 11: Market Growth and Adjacencies
Ardoq frames the Enterprise Architecture market as "no longer niche." They cite a 10-12% market CAGR from 2020 to 2025. The slide breaks down the opportunity into:
$2B: Companies looking to kick-start EA practices. · $300M-$500M: Companies looking to replace legacy EA tools. · Adjacencies: Cyber Security and Risk Management (~$150B) and Enterprise Governance, Risk, and Compliance (~$36B).
This suggests that Ardoq's total addressable market (TAM) is far larger than the core EA space.
Financials and Conclusion
Slide 12: SaaS Metrics
Slide 12 is the most data-dense slide in the deck. It shows a bar chart of ARR growth from Q3 2016 to Q3 2021. The ARR reached $11.1M in Q3 2021 , up from $6.1M in Q3 2020 (an 82% increase). Other 'top-tier SaaS Metrics' listed include a 5.5X LTV/CAC and an 83% Gross margin YTD. The chart shows a clear inflection point in growth starting in late 2019.
Slide 13: Vision Statement
The penultimate slide states the company's aspiration: "We aspire to be the global benchmark for profitable transformation." It mirrors the design of the hook slide, providing a bookend to the presentation.
Slide 14: Final Slide
The final slide is a promotional graphic for the source of the deck, bestpitchdeck.com, and does not contain Ardoq-specific information.
What Works in the Ardoq Deck
The Ardoq deck is highly effective because it prioritizes external validation over internal claims. By citing Gartner and Forrester on four separate slides (7, 8, 10, 11), the company leverages the credibility of established analysts to justify its Series D valuation. The comparative ROI on Slide 4 is another strength; it doesn't just say the product is better, it quantifies the time saved (5 months vs. 3 weeks) and the dollar value of that time. Finally, the financial transparency on Slide 12, showing a 5.5x LTV/CAC and 83% gross margins, provides the 'hard' data required for late-stage investors to model their returns.
What is Missing from the Ardoq Deck
The most glaring omission is a Team slide. While this is common in later rounds where the focus shifts to metrics, investors still typically want to see the leadership team's pedigree, especially in a $125M round. There is also no Ask slide or Use of Funds breakdown. While we know from catalogue facts that they raised $125M, the deck itself does not specify how that capital will be deployed—whether for R&D, international sales expansion, or M&A. Lastly, the competitive analysis is limited to Gartner quadrants; a more detailed 'feature-by-feature' comparison against key rivals like LeanIX could have strengthened the case for their 'Intelligence Graph' superiority.
Founder Takeaways
Founders should copy Ardoq's 'Use Case Journey' (Slide 5) . Many decks fail to show how a product evolves from a niche tool to a strategic enterprise necessity. Ardoq clearly maps how they move from the IT department to the C-suite. Additionally, the 'Legacy vs. Digital Native' timeline (Slide 8) is a brilliant way to frame a market. It doesn't just list competitors; it categorizes them as 'old' and 'obsolete,' positioning the founder's company as the inevitable future. Finally, if you have third-party awards or analyst mentions , don't bury them. Ardoq makes them the centerpiece of their narrative, which is the most efficient way to build trust quickly in a high-stakes fundraising environment.
Frequently asked questions
- What is Ardoq's primary value proposition for enterprise customers?
- Ardoq positions itself as a SaaS platform to navigate digital transformation by automating the mapping of IT landscapes. According to Slide 4, it replaces manual, consultant-led processes that take 5 months with an automated engine that delivers results in 3 weeks. This allows companies to identify 'rationalization candidates'—essentially cutting redundant software costs—saving mid-sized companies an estimated $0.5M to $1M annually.
- How does Ardoq demonstrate its market leadership in the deck?
- The deck leans heavily on industry analysts. Slide 7 highlights their status as a 'Gartner Peer Insights Customers' Choice 2021,' while Slide 10 shows their position in the 'Leaders' or 'Strong Performers' sections of the Forrester Wave (March 2021) and the Gartner Magic Quadrant (November 2021). This external validation is crucial for Series D rounds to prove the product has won the market's trust.
- What are the key financial metrics shared in the Ardoq deck?
- Slide 12 provides a snapshot of the company's health as of Q3 2021. It reports an ARR of $11.1 million, representing 82% year-over-year growth. Efficiency metrics are also strong, with a 5.5x LTV to CAC ratio and an 83% gross margin. The ARR growth chart shows a clear acceleration, jumping from $6.1M to $11.1M in just one year.
- What is missing from the Ardoq Series D pitch deck?
- Notably, the deck lacks a dedicated 'Team' slide, which is unusual for a pitch deck but common in late-stage rounds where the company's performance and market position are the primary focus. It also lacks a specific 'Use of Funds' or 'The Ask' slide, though catalogue facts indicate they successfully raised $125 million. There is also no detailed breakdown of the competitive landscape beyond high-level Gartner quadrants.
- How does Ardoq plan to expand its market reach according to the slides?
- Slide 11 outlines 'attractive adjacencies' beyond the core Enterprise Architecture market. By positioning itself at the intersection of EA, Ardoq eyes the $150B Cyber Security and Risk Management market, the $36B GRC (Governance, Risk, and Compliance) market, and the $1.5B Master Data Management market. This suggests a strategy of horizontal expansion into broader IT governance.