Preclinical Data in a Biotech Pitch Deck: How to Show Lab
How to present preclinical evidence to investors before you have patients: name the test, the comparison, the sample and the result.
Preclinical Evidence Slide: Show What You Tested, Against What, and What Happened
"IV Lung SORTs demonstrate selectivity and high potency across species." "Ourotech can predict this better than the competition." "Our first asset has been revived and has animal data — confirming its huge potential." Before a biotech or drug-discovery startup has patients, its traction is laboratory and animal data. Investors read those slides closely, because a preclinical result is only as strong as the test behind it: what was measured, against what comparison, in how many samples, and whether the result was predicted in advance. This guide compares three real slides, from a lab model set against a human reference to a claim with no data at all, and shows how to present your own results so a scientific reviewer can judge them.
TL;DR
A preclinical evidence slide should name the experiment (cell assay, computational benchmark, animal model), the measure and its unit, the comparison (a standard method, a control or a human reference), the sample size, and the result as a number or labelled chart. Say whether the result was predicted before the test or found afterwards, and what it does not yet show. A checkmark that says "validated" is not evidence; the test and the number are.
Three real slides presenting preclinical evidence
Each slide is shown as it appears in the company's original deck, with what it says, what we checked and what an investor still cannot tell. They run from a lab model compared with a human reference to a claim with no data.
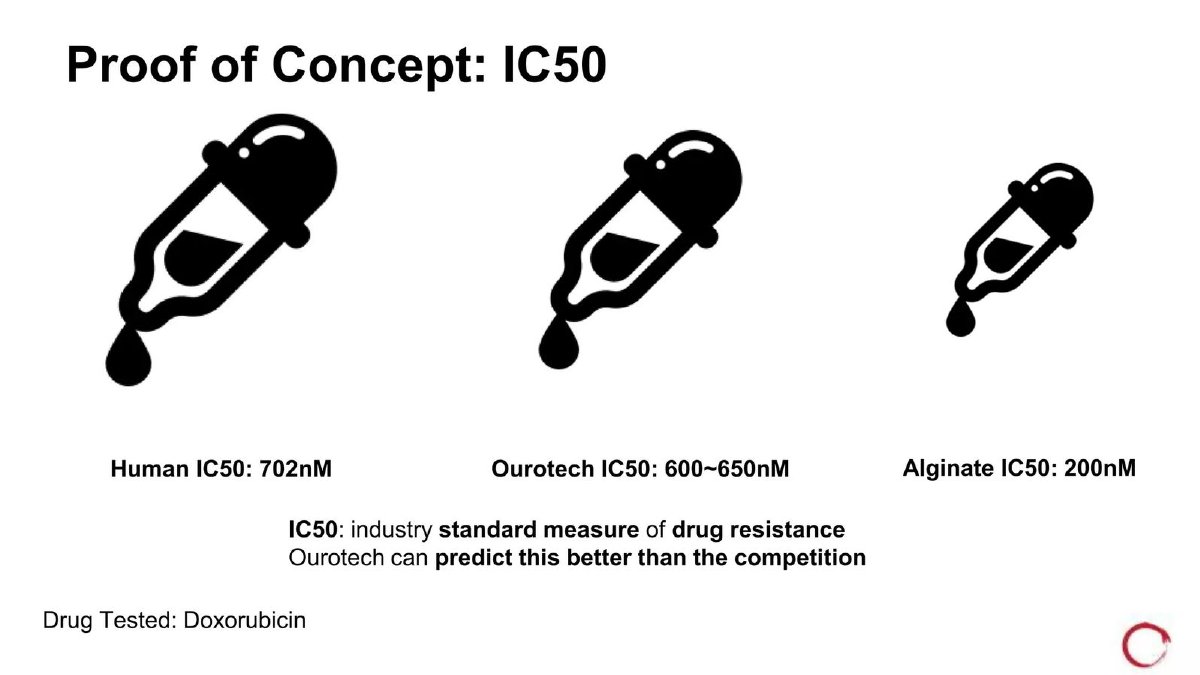
Ourotech traction slide — slide 9
3D lab-grown tissue models for testing cancer drugs; page 9 of its February deck.
Ourotech deck, slide 9. Exact stored slide matched to this analysis.
Our analysis: Comparing a lab model with a human reference is exactly the right test for a company selling models that predict patient response, and the gap against alginate is large. But it rests on one drug and an unsourced human value, so it shows a promising first result, not a general advantage. Adding more drugs, the cell type and the source for the human value would turn it into evidence.
Evidence and limitation: Our checks: Ourotech's 600 to 650 nM is 50 to 100 nM from the human reference of 702 nM, about 7% to 15% lower; alginate's 200 nM is about 72% lower. The slide doesn't say where the human figure comes from, which cancer cells were used, how many repeats were run, or why alginate represents "the competition."
What a founder can adapt: "IC50 across [n] drugs: our model within [x]% of patient-derived values vs [y]% for [named standard model] ([cell type], [repeats])."
Supporting analysis
What the deck claims: "Proof of Concept: IC50." Three droppers: "Human IC50: 702nM", "Ourotech IC50: 600~650nM", "Alginate IC50: 200nM". "IC50: industry standard measure of drug resistance. Ourotech can predict this better than the competition." "Drug Tested: Doxorubicin."
Presentation choice: It compares a lab model with a human reference, on one drug.
When it does not fit: Don't claim superiority from one drug and an unsourced reference.
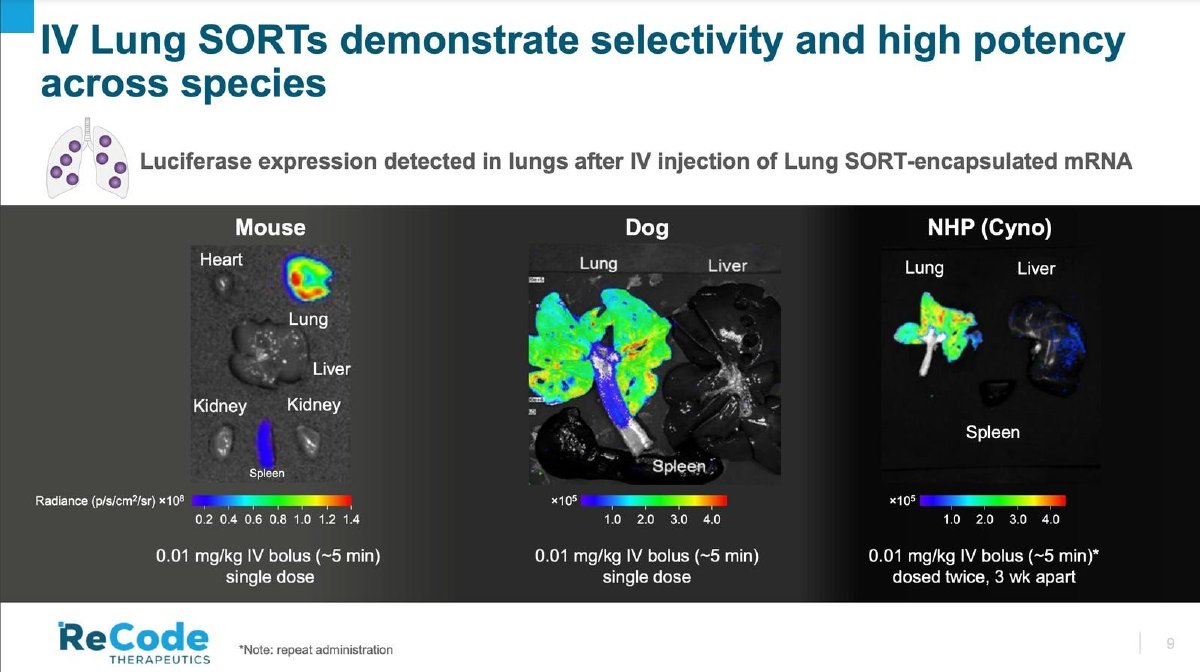
Lipid nanoparticle delivery of genetic medicines to specific organs; page 9.
ReCode Therapeutics deck, slide 9. Exact stored slide matched to this analysis.
Our analysis: Showing the same result in three species, including a primate, is strong evidence for a delivery platform, and the dosing detail is what a specialist looks for. A generalist will read the colours as equal across species when the scales differ by a factor of about 1,000. A lung-to-liver signal ratio for each species, with animal counts, would make the selectivity claim checkable.
Evidence and limitation: Our checks: the slide gives the dose, route and schedule for each species, and the reporter (luciferase) used to show where the mRNA was expressed. The colour scales differ: mouse radiance is ×10⁸ (0.2 to 1.4), dog and NHP ×10⁵ (1.0 to 4.0), so colours can't be compared across panels. No number gives the share of signal in the lung, and animal counts aren't shown.
What a founder can adapt: "Lung:liver signal ratio [x] (mouse, n=[a]), [y] (dog, n=[b]), [z] (NHP, n=[c]) at 0.01 mg/kg."
Supporting analysis
What the deck claims: Headline "IV Lung SORTs demonstrate selectivity and high potency across species." "Luciferase expression detected in lungs after IV injection of Lung SORT-encapsulated mRNA." Three imaging panels: Mouse (heart, lung, liver, kidneys, spleen), Dog (lung, liver, spleen) and NHP (Cyno) (lung, liver, spleen). Each shows strongest signal in the lung. Doses: "0.01 mg/kg IV bolus (~5 min) single dose" for mouse and dog; "dosed twice, 3 wk apart" for NHP, with note "repeat administration."
Presentation choice: It shows cross-species in vivo evidence with dose detail.
When it does not fit: Don't place panels with different colour scales side by side without saying so.
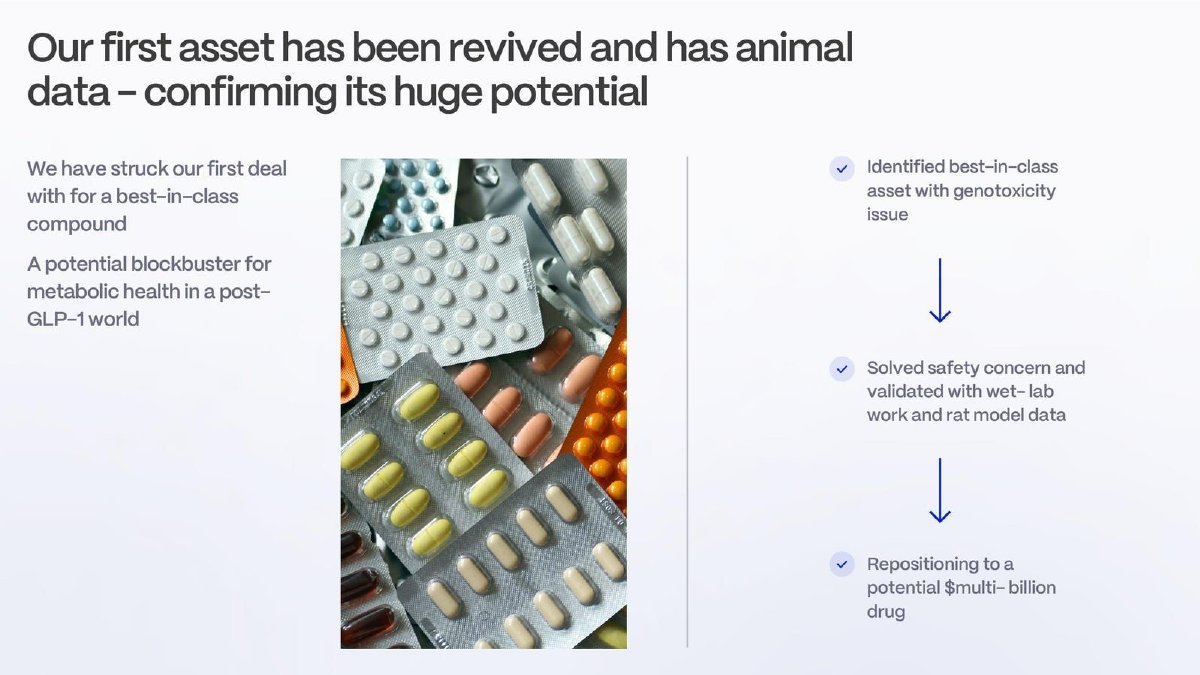
AI platform for reviving drugs that failed on safety; page 9 of a seed-stage deck.
Ignota Labs deck, slide 9. Exact stored slide matched to this analysis.
Our analysis: The structure, problem then fix then evidence, is the right story for a turnaround company. But the slide tells the reader that data exists rather than showing it, and pairs it with "confirming," "blockbuster" and "multi-billion." One result, such as the genotoxicity assay before and after the fix, or the rat dose tolerated, would do more than the adjectives.
Evidence and limitation: Our checks: the slide names the original problem (genotoxicity, damage to genetic material) and the evidence type (wet-lab work and rat model data), but gives no result, measure, comparison or sample. The deal partner's name appears to be missing from "our first deal with for."
What a founder can adapt: "Genotoxicity: [assay] positive at [x] µM before; negative up to [y] µM after. Rat: [dose] tolerated for [days], n=[a]."
Supporting analysis
What the deck claims: Headline "Our first asset has been revived and has animal data — confirming its huge potential." Left: "We have struck our first deal with for a best-in-class compound. A potential blockbuster for metabolic health in a post-GLP-1 world." Right, three ticked steps: "Identified best-in-class asset with genotoxicity issue" → "Solved safety concern and validated with wet-lab work and rat model data" → "Repositioning to a potential $multi-billion drug." A stock photo of pills.
Presentation choice: It shows a preclinical claim with no data, and what is missing.
When it does not fit: Don't write "validated" or "confirming" without the result beside it.
Columns report what each slide puts on the page; a strong preclinical slide has all four.
Slide
Evidence type
Comparison
Sample shown
Result as number
Ourotech p9
In vitro model vs human
Human reference; alginate
No (one drug)
Yes
ReCode p9
In vivo, three species
Other organs
Species yes; animals no
No (images)
Ignota p9
In vitro and rat (stated)
None
No
No
Key Takeaways
Name the experiment type: computational, in vitro (cells) or in vivo (animals).
State the measure and unit, and what a better value means.
Always show a comparison: a standard method, a control or a human reference.
Give the sample size: compounds, assays, animals, species.
Say whether predictions were made before the lab test.
State what the result doesn't show yet, such as efficacy, safety or human relevance.
Build your preclinical evidence slide
Answer each prompt for your single strongest result before designing the slide.
Experiment. Computational, in vitro or in vivo? Formal study or exploratory?
Measure. What did you measure, in what unit, and is higher or lower better?
Comparison. What standard method, control, existing drug or human reference did you compare against?
Sample. How many compounds, assays, repeats, animals or species? How many tests failed?
Order. Were predictions made before the lab test, or results selected afterwards?
Not yet shown. What is the next question this data cannot answer, and which study in this round answers it?
Copyable framework: [Experiment]: [measure] [result] vs [comparison] ([n] [units], [prospective/post hoc]). Not yet shown: [next question], answered by [study] in [timeframe].
Illustrative example 1 — written by us
Before: Human IC50: 702nM. Ourotech IC50: 600~650nM. Alginate IC50: 200nM. Ourotech can predict this better than the competition.
After: Doxorubicin IC50 in [cell type]: our model 600–650 nM vs 702 nM in patients ([source]) and 200 nM in alginate ([n] repeats). Next: [n] more drugs by [quarter].
What improved: Built from Ourotech's page 9. The cell type, source of the human value, repeats and next drugs are placeholders the slide does not give.
Illustrative example 2 — written by us
Before: Solved safety concern and validated with wet-lab work and rat model data.
After: Genotoxicity assay: positive before modification, negative up to [x] µM after; rats tolerated [dose] for [days] (n=[a]).
What improved: Built from Ignota Labs' page 9. All results are placeholders.
What this guide adds to the biotech and clinical guides
The clinical evidence guide covers outcome studies for digital-health and device companies with patients, and leaves drug pipelines out. The biotech solution guide asks founders to give a measured gain with a source, and the biotech pipeline guide shows where each programme stands. None of them explains how to present the experimental evidence that comes before the clinic: the lab assays, computational benchmarks and animal studies that are the main traction for most seed and Series A biotech companies.
This guide is for founders of drug-discovery, platform, delivery and lab-model companies. It is about how to present results on a slide, not how to design experiments or what regulators require; for that, take scientific and regulatory advice. It is not legal, medical or investment advice.
Know which kind of evidence you have
Preclinical evidence falls into three broad kinds, and investors weigh them differently. Computational evidence shows that a model or algorithm predicts something correctly, usually tested against compounds or targets whose answer is already known. In vitro evidence comes from cells or tissue in the lab: potency, binding, toxicity in a dish. In vivo evidence comes from living animals: where a drug goes, whether it works in a disease model, what dose is tolerated.
The FDA describes preclinical research as in vitro and in vivo work done before testing in people, mainly to find out whether a drug could cause serious harm, and notes that these studies are usually small but must give detailed dosing and toxicity information. Formal safety studies for a regulatory filing follow good laboratory practice rules. Say on the slide which kind your result is, and whether it was a formal study or exploratory work. Exploratory data is normal at seed stage; calling it validation is the mistake. (U.S. Food and Drug Administration)
Show the comparison, not just the result
A preclinical number means little on its own. A model that is right 99% of the time sounds impressive until you learn the standard method is right 98% of the time. A drug concentration in a lab model means nothing unless the reader knows what it should be.
Put the comparison on the slide: the industry-standard algorithm, the untreated control, the existing drug, or the human reference value your model is meant to match. If you are claiming to beat competitors, name the competing method and show its figure from the same experiment. Putting your figure and the comparison side by side, as Ourotech does with a human value and a competing model, lets the reader see the size of the gap at a glance.
If your evidence is computational
Platform companies often lead with a model rather than a molecule. A computational result is persuasive when it is tested the way a sceptical scientist would test it: on cases where the right answer is already known, kept separate from the data the model learned from, and compared with the method a buyer would otherwise use. Say all three on the slide or in a footnote.
Report the result at the point that matters for the decision. If a chemist will only test the top ten predictions, say how often the right answer is in the top ten, not in the top fifty. If your chart is a curve, mark the point your headline number comes from. And name the comparison method; "industry standard" without a name invites the question of which one, and whether it was run fairly.
Then show at least one prediction tested in the lab. A benchmark shows the model can find known answers; a prospective test, where the model names new compounds or targets before anyone tests them, shows it can find new ones. Report it as a hit rate, "14 of 30 predicted compounds were active below 1 µM", so the failures are visible. Those numbers are our illustration, not from any deck.
Give the sample and say what was predicted in advance
Investors and their scientific advisers will ask how many compounds, assays, animals or species the result rests on, and how many tests were run in total. "Many compounds" is not a sample size; "23 of 31 predicted compounds showed potency below 100 nM" is. If some tests failed, a hit rate is more credible than a list of successes.
The strongest evidence comes from predictions made before the experiment: the platform names compounds or targets, and the lab tests them afterwards. Results selected after the fact, such as the best animal image or the one compound that worked, are weaker. A line saying "predictions locked before testing" or "selected post hoc" helps a reviewer weigh what they see.
Make images and charts readable to a non-specialist
Lab images, such as tissue staining or imaging of where a drug ends up in the body, are persuasive to scientists and puzzling to generalists. Add a one-line headline that says what the image proves, label the organs or cells that matter, and keep colour scales comparable across panels. If each panel has its own scale, say so, or the reader will compare colours that don't mean the same thing.
Where you can, put a number beside the image: the share of the signal that reached the target organ, or the ratio between target and other organs. One number lets an investor repeat your result to a partner who never saw the slide.
State what the result does not yet show
Every preclinical result has limits: cell results may not carry over to animals, animal results may not carry over to people, and a delivery result doesn't show the drug works. Naming the next question your data has to answer, and when you will answer it, shows you understand the risk. Tie it to the use of funds: "This round funds a disease-model efficacy study in two species by Q3."
Avoid words such as "confirming," "proven" or "blockbuster" next to early data. Specialist investors discount them, and generalists may later feel misled.
Keep the appendix ready. A specialist investor will usually ask for the underlying data before a second meeting: the full dose-response curves, the number of repeats, the animals used and any results that did not work. Having a short data pack prepared, with the same figures as the slide, shortens diligence and shows that the headline number was not picked from a larger set of weaker results.
Worked example: a computational discovery platform (hypothetical)
This is our illustration, not a figure from any deck. A startup's model predicts which proteins a compound will bind. It tested the model on 400 compounds with known targets and then ran lab tests on new predictions.
Weak version: "Platform validated: near-perfect accuracy and many wet-lab hits." Strong version: "Benchmark: true target in top 10 predictions for 97% of 400 known compounds, versus 72% for the standard method. Prospective test: we predicted new targets for 40 compounds before lab work; 26 (65%) bound with potency under 100 nM in two assays. Not yet shown: activity in animal models."
The strong version gives the reader the comparison, the sample, the order of prediction and testing, and the open question.
Common mistakes
"Validated" with no result. Show the measure and the number, not a checkmark.
No comparison. A result needs a baseline, control or reference beside it.
Vague sample. "Many" or "often" hides the hit rate.
Unclear headline figure. Say which point on a curve or which condition a percentage comes from.
Mismatched image scales. Label differing colour scales or add a ratio.
Hype on early data. "Confirming" and "blockbuster" next to rat data undermine trust.
Diagnostic checklist
The experiment type is named.
The measure, unit and direction are stated.
A comparison is shown from the same experiment.
Sample size is given, including failures where relevant.
Prospective or post hoc is stated.
Images have labels and comparable or stated scales.
The next unanswered question is named and tied to the round.
Frequently asked questions
How do I present preclinical data in a pitch deck?
Name the experiment, the measure and unit, the comparison and the sample size, and give the result as a number or a labelled chart. Say whether predictions were made before testing and what the data doesn't yet show.
Is animal data enough for a seed biotech round?
It depends on the investor and the programme, but most seed biotech companies raise on lab or animal data. What matters on the slide is that the data is specific and honest about its limits.
What is the difference between in vitro and in vivo evidence?
In vitro evidence comes from cells or tissue in the lab; in vivo evidence comes from living animals. The FDA describes both as preclinical research done before testing in people. (U.S. Food and Drug Administration)
How do I show an AI drug-discovery platform works?
Test it on cases where the answer is known and compare it with a standard method, then test new predictions in the lab and report how many worked. A benchmark plus a prospective hit rate is far stronger than either alone.
How we chose these examples
Discovery (2026-10-04, run 128): following run 127's plan, we listed private biotech and medtech decks not yet used in any guide and read Aurion Biotech, Spinea Medical, Ignota Labs, Heart Metrics and ReCode Therapeutics page by page from the deck index, then searched other unused discovery-platform decks (Deep Genomics, Cellarity, Pepper Bio, Ourotech, Prosoma) for validation pages. Closest content: clinicalEvidence.ts (digital-health outcome studies, drug pipelines excluded), biotechSolution.ts (asks for a measured gain; no lab or animal results), biotechPipeline.ts and drafts/executiveSummaryMechanismToEvidence.ts. None teaches how to present preclinical results.
Three pages from three decks were read from images rendered from the original deck files: Ourotech 9, ReCode 9 and Ignota Labs 9. All are published teardowns. Update (2026-10-07, v2): two examples from a fourth deck, and every figure and comparison taken from them, were removed because every page of that deck is marked "Private"; every page of the three remaining decks was reviewed visually and its top and bottom edges were read by text recognition at double size, with no confidentiality or distribution notice (ReCode's cover calls the deck a "Non-confidential Overview"). Not used: Deep Genomics p9 and Cellarity p6 to p8 (indexed as public-source text and mostly diagrams or programme lists), Prosoma p5 (clinical, not preclinical), Aurion p14 to p15 (clinical data in patients). The images were prepared at 1,200 pixels wide and uploaded through the standing slide-image workflow.
Percentages and gaps were recalculated from printed figures; chart values read by eye are approximate. The worked example and the hit-rate example under computational evidence are our illustrations. Company figures and scientific claims are reported as printed and not verified. The FDA source was read in its published text. Slide readings and analysis are an AI editorial model review, not human-checked, and are not scientific or regulatory advice.