Progress Since Your Last Round: How to Show What the Last
Raising again? Investors want to know what changed since the last round. Four real slides show how to give the starting point.
Progress Since Your Last Round: Show the Starting Point, Not Just the Result
When a company raises its second or third round, investors ask a question that a first-time founder never faces: what did you do with the last money? The answer usually lands on one slide, often headed 'since our seed round' or 'since Series A'. That slide is the closest thing a deck has to a report card. It can show that the team turns capital into progress at a known rate, which is what a new investor is really betting on. It can also say very little, if it lists activity without a starting point, gives a multiple without a base, or claims to have delivered on promises the reader never saw. This guide looks at four real slides that describe progress between rounds and shows what each lets an investor check.
TL;DR
Give the date and size of the last round, where each measure stood then, where it stands now, and what you said the money would achieve. Then mark which goals were met, which were missed and why. Dutch, a pet telehealth company, heads a Series A slide 'We've come a long way since our seed round' and lists four done items, one of which gives a before and after: its 2021 state expansion list went 'From 12 to 32 states'. Peppy, a workplace health company, opens with '>8x ARR growth since series A', a multiple with no starting ARR and no date for the Series A. IMMO, a residential property company, writes 'Since series A funding, IMMO team delivered successful portfolio proof case and unlocked scalable institutional capital' over five unquantified achievements. Rohlik, an online grocer, titles a chart 'We have constantly delivered what we promised…' and plots monthly orders from July 2014 to December 2021, but never shows what was promised or when it raised.
Four slides that describe progress between rounds
Each slide is read at full size. Quotes are exact; chart readings are our estimates.
Dutch traction slide — slide 13
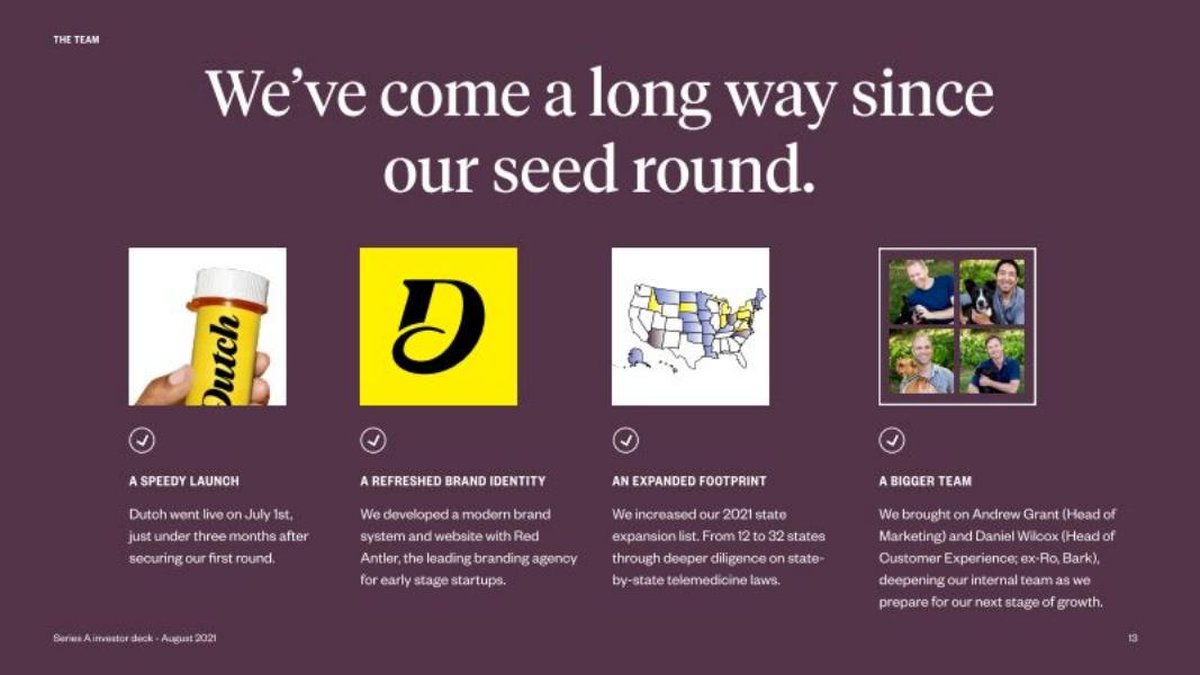
Online veterinary care. Series A deck, August 2021; four done items since seed.
Dutch deck, slide 13. Exact stored slide matched to this analysis.
Our analysis: Good timing anchor; mostly activities, no results or original plan.
Evidence and limitation: Launch tied to the round's date; one before-and-after, which describes a plan list rather than live states.
What a founder can adapt: Label plans as plans; add early results after launch.
Supporting analysis
What the deck claims: "We've come a long way since our seed round." "Dutch went live on July 1st, just under three months after securing our first round." "From 12 to 32 states".
Presentation choice: Shows progress measured from the round's closing.
When it does not fit: A before-and-after that reads as operations but measures a plan.
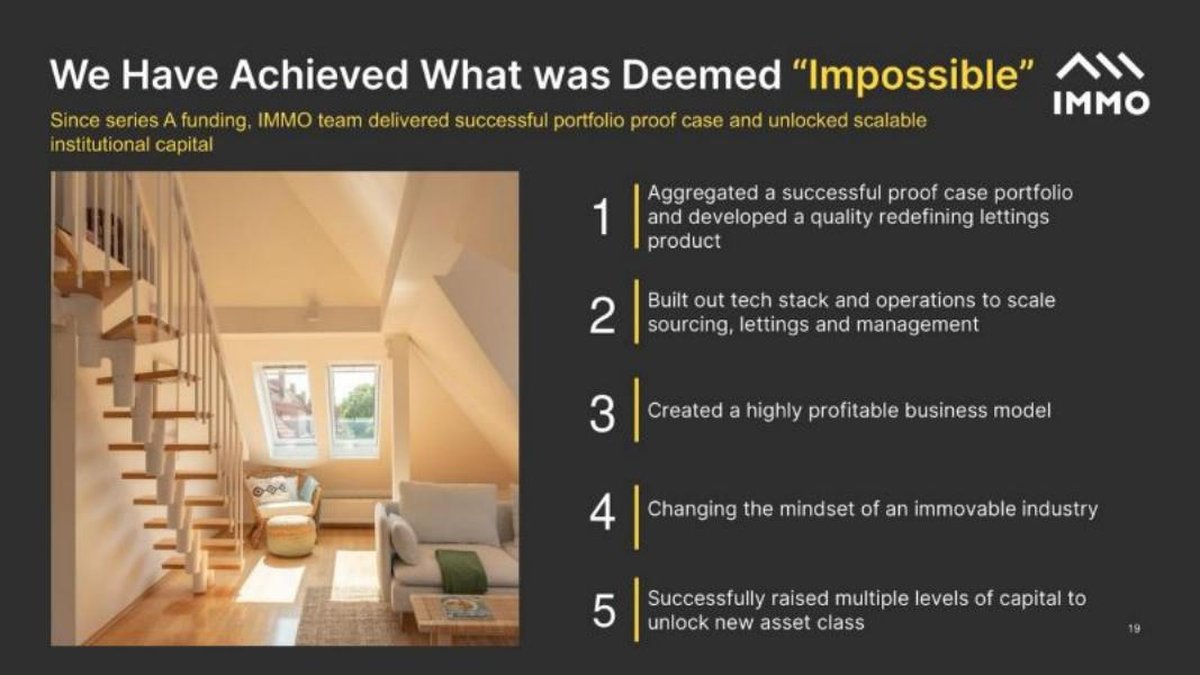
Residential property buying and letting. Five achievements since Series A.
IMMO deck, slide 19. Exact stored slide matched to this analysis.
Our analysis: Right structure, nothing a reader can check on this slide.
Evidence and limitation: Goal and result framing; no figure or date on any item.
What a founder can adapt: Give one figure per achievement.
Supporting analysis
What the deck claims: "Since series A funding, IMMO team delivered successful portfolio proof case and unlocked scalable institutional capital"; "Created a highly profitable business model".
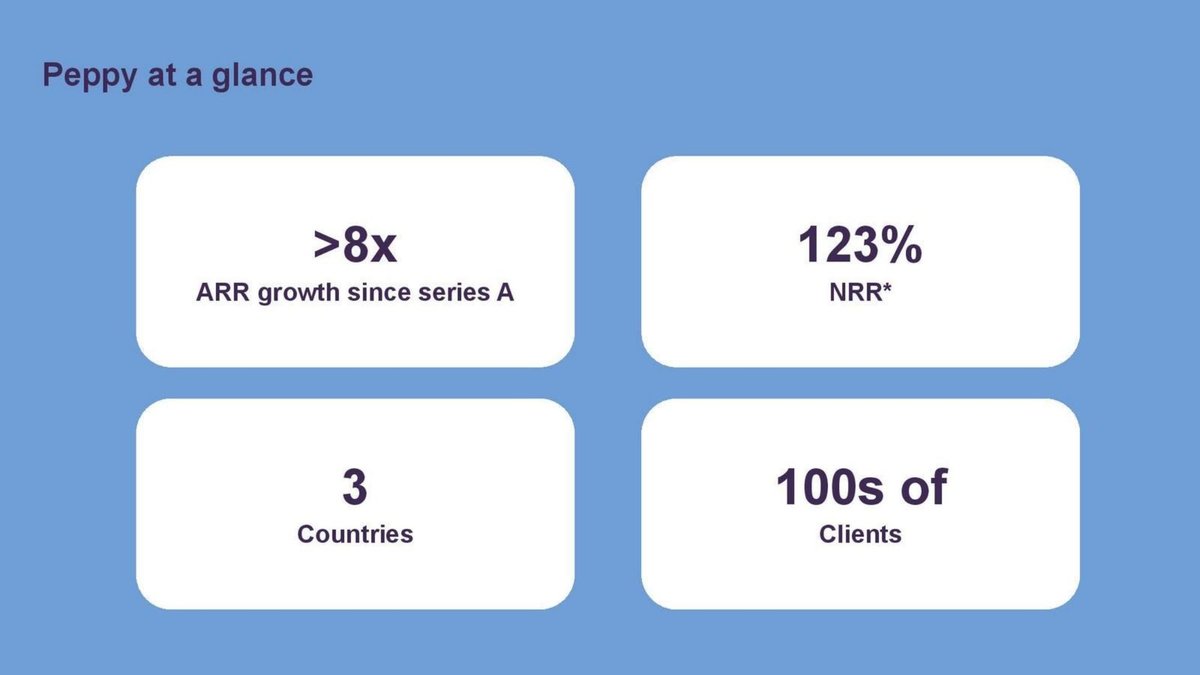
After: ">8x ARR in [n] months since our Series A ([month year]); ARR now £[range]."
What improved: Our illustrative rewrite of Peppy's tile. Bracketed details are not stated on the slide.
The question this guide answers
This guide answers one founder question: when I raise again, how do I show what my company achieved with the previous round, so that a new investor can judge how well we use capital?
Our milestones-to-date draft covers how to lay out a company's track record from formation onwards: stacked achievements, dated timelines, annotated revenue charts. Our metric-dates draft covers how to date a single figure. Our funding-to-date draft covers how to list the money already raised. None of them makes the gap between two rounds its subject. A milestone timeline answers 'what has this company done'. A progress-since-last-round slide answers a narrower and harder question: 'given the money and time you had since you last raised, how much did you move, against what you said you would do?' That needs a starting point at the last round, an end point now, and the plan the previous investors bought.
The question matters because a follow-on round is priced partly on this answer. A new lead is trying to estimate how much progress the next round will buy. The best evidence is how much the last one bought.
How we chose and read the examples
We searched extracted slide text across the library for phrases such as 'since our seed round', 'since series A', 'since we raised', 'progress since' and 'delivered what we promised'. Most matches came from listed companies describing progress since an IPO or from funds; we excluded those, along with mining and bank presentations. Four private-company slides remained that make an explicit claim about progress between rounds or against promises. Each takes a different approach: a list of done items with one before-and-after figure, a single multiple, a list of qualitative achievements, and a long-run chart under a 'delivered what we promised' headline.
Each slide was rendered from the source deck and read at full size; the small text on the Dutch and IMMO slides was enlarged further before quoting. Quotes are exact. Chart readings on the Rohlik slide are our estimates from the axis. We did not check any figure or claim against outside sources, including the dates and sizes of the rounds the slides refer to.
What an investor reads into this slide
Speed. How long did it take to do what was done? A launch three months after closing a round says something different from a launch eighteen months after.
Efficiency. How much moved per unit of money? A company that doubled revenue on a small seed round and one that doubled it on a large one have shown different things, even though the multiple is the same.
Honesty about the plan. Previous investors were shown a plan. A new investor may be able to see it, or ask an existing investor about it. If the slide quietly drops goals that were missed, the gap will often surface in diligence, and it will look worse then than it would have on the slide.
Learning. Missed goals are normal. What a new investor wants to know is what the team learned from them and how the new plan reflects that. A slide that only lists wins gives no view of this.
Done items with one before-and-after: Dutch
Dutch, which offers online veterinary care, has a slide in its Series A deck, dated 'August 2021' in the footer, headed 'We've come a long way since our seed round.' Four columns follow, each with a picture, a tick and a short paragraph. 'A speedy launch': 'Dutch went live on July 1st, just under three months after securing our first round.' 'A refreshed brand identity': 'We developed a modern brand system and website with Red Antler, the leading branding agency for early stage startups.' 'An expanded footprint': 'We increased our 2021 state expansion list. From 12 to 32 states through deeper diligence on state-by-state telemedicine laws.' 'A bigger team': 'We brought on Andrew Grant (Head of Marketing) and Daniel Wilcox (Head of Customer Experience; ex-Ro, Bark), deepening our internal team as we prepare for our next stage of growth.'
The slide does two things well. It ties progress to the round's date: launching 'just under three months after securing our first round' tells the reader exactly how fast the team moved, without needing the closing date. And one item gives a starting point and an end point: 12 states to 32. A before-and-after is the core of this kind of slide, and here it is.
Read closely, though, the 12-to-32 figure is a change in a plan, not in operations: the 2021 'state expansion list' grew. The slide doesn't say how many states Dutch was live in at the time. An investor could easily read it as 32 states served. The other three items are activities — a launch, a brand, two hires — with no results attached. A company two months after launch may have little else to show, and that is a fair constraint; the slide would be stronger if it said so and gave whatever early figures existed (customers, visits, repeat use since 1 July). It also doesn't say what the seed round was meant to achieve, so the reader can't tell whether launching in July was ahead of plan or behind it.
A multiple without a base: Peppy
Peppy, which provides health support to employees through their employers, has a slide headed 'Peppy at a glance' with four tiles: '>8x ARR growth since series A', '123% NRR*', '3 Countries' and '100s of Clients'. The asterisk on the NRR tile is not explained on the slide.
A multiple is a natural way to show progress between rounds: it compresses the whole period into one number, and it lets a company show growth without disclosing revenue. '>8x since series A' is a strong claim and is clearly tied to the round.
What it can't show is scale or speed. Eight times a small figure is still a small figure, and eight times over three years is a different story from eight times over twelve months. The slide gives neither the starting ARR, nor the current ARR, nor the date of the Series A. An investor can't tell whether this is a company at £1 million ARR or £10 million, and can't compute a growth rate. A range ('ARR £[x]m at Series A, [month year]; £[y]m today') or, if the company prefers not to disclose, the months elapsed ('>8x ARR in [n] months since Series A') would make the multiple usable. The '100s of Clients' tile has the same problem in a milder form: it is a range that gives no start point at the last round.
Achievements without measures: IMMO
IMMO, which buys and lets residential property, has a slide headed 'We Have Achieved What was Deemed "Impossible"'. A subtitle reads: 'Since series A funding, IMMO team delivered successful portfolio proof case and unlocked scalable institutional capital'. Five numbered items follow: 'Aggregated a successful proof case portfolio and developed a quality redefining lettings product'; 'Built out tech stack and operations to scale sourcing, lettings and management'; 'Created a highly profitable business model'; 'Changing the mindset of an immovable industry'; and 'Successfully raised multiple levels of capital to unlock new asset class'.
The framing is right. The subtitle names the round, says what was meant to be proved (a portfolio proof case and access to institutional capital) and claims both were done. That is the shape of a good progress slide: here was the goal, here is the result.
The content doesn't carry it. None of the five items has a number or a date. 'A successful proof case portfolio' could be ten flats or a thousand. 'Highly profitable' has no margin. 'Multiple levels of capital' has no amounts or sources. Other slides in the deck may supply some of this, and a reader working through the whole deck may find it, but this slide asks to be read as the summary of the period, and on its own it can't be checked. Even a single figure per item — properties acquired, occupancy, yield, debt facility size — would turn claims into evidence. The headline's 'Deemed "Impossible"' also invites the question 'by whom?', which the slide doesn't answer.
'Delivered what we promised' with no promises shown: Rohlik
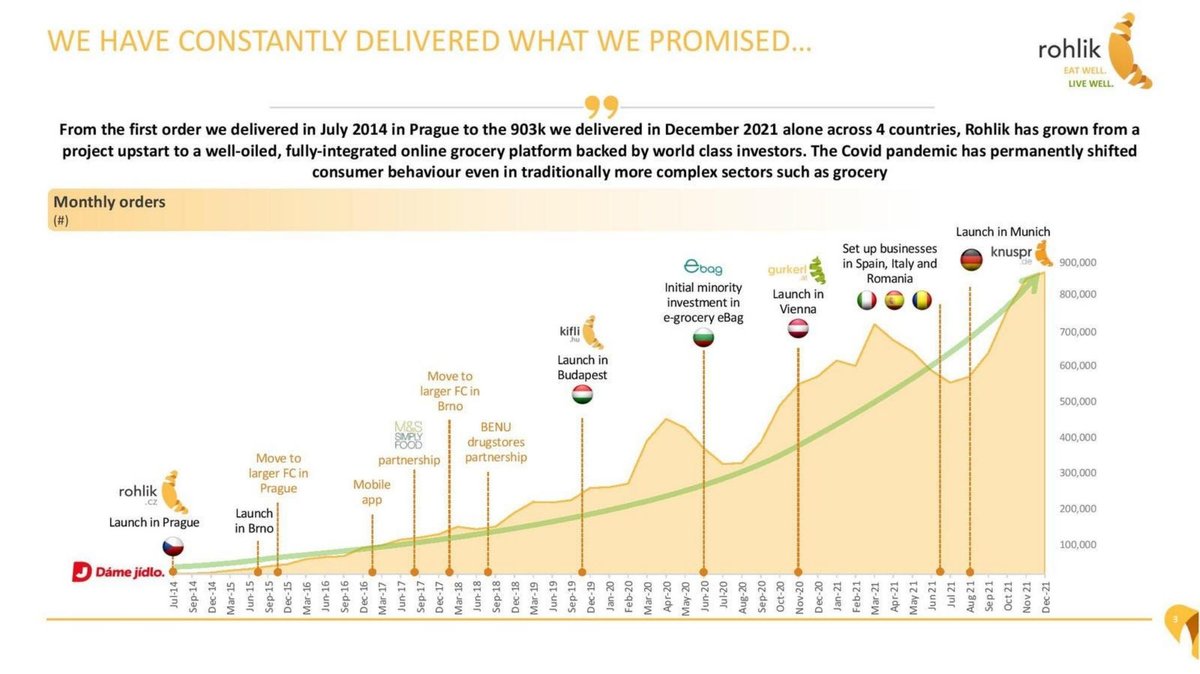
Rohlik, the Czech online grocer, has a slide headed 'We have constantly delivered what we promised…'. A paragraph beneath reads: 'From the first order we delivered in July 2014 in Prague to the 903k we delivered in December 2021 alone across 4 countries, Rohlik has grown from a project upstart to a well-oiled, fully-integrated online grocery platform backed by world class investors.' It continues with a line about Covid shifting consumer behaviour. Below is an area chart titled 'Monthly orders (#)', from Jul-14 to Dec-21, rising to close to 900,000 by our reading. Markers along the curve note launches in Prague, Brno, Budapest, Vienna and Munich, moves to larger fulfilment centres, a mobile app, partnerships with M&S Simply Food and BENU drugstores, an 'initial minority investment in e-grocery eBag', and setting up businesses in Spain, Italy and Romania.
As a track-record chart it is strong. It is dated to the month, the measure is clear, and every event is placed on the curve so the reader can see what came before and after each one. The dip in mid-2020 and in mid-2021 is left visible rather than smoothed away, which is to Rohlik's credit.
As evidence for its headline, it is incomplete. The slide says the company delivered what it promised, but shows no promises: no plan from an earlier round, no target set against the actual, and no funding rounds on the timeline. A reader has to take the claim on trust. Adding the earlier rounds as markers on the chart, and for the most recent round a line or two of 'we said / we did' ('Series [x], [month year]: planned [n] markets and [m] monthly orders by [date]; reached [n] and [m]'), would let the chart prove the headline instead of decorating it.
How to build the slide
Start with the round. One line: stage, amount, closing month. 'Seed, $[x]m, closed [month year].' Everything below is measured from that point. Dutch does this implicitly ('just under three months after securing our first round'); stating it outright is clearer.
Pick the two to four measures that the last round was meant to move. These are usually the ones you used to raise it: revenue or ARR, customers, a product milestone, a regulatory step, key hires. Don't add new measures that happen to look good unless you say why they matter now.
Show each as then and now. 'ARR: £[a] at seed, £[b] now.' If you won't disclose amounts, give a multiple with its time window ('[n]x in [m] months') and, if you can, a range for scale. Peppy's '>8x' would become checkable with either.
Compare with the plan. If you told the last investors you would reach a figure or a milestone by a date, show it beside the result. Mark each goal as met, missed or changed. Rohlik's headline is exactly this claim; the slide needs the plan to support it.
Explain misses briefly. One line each: what happened and what you changed. A missed goal with a clear reason and a revised plan is often more persuasive to an experienced investor than a slide of unbroken wins.
Keep activities, results and plans apart. A launch, a rebrand or a hire is an activity; customers, revenue or retention after the launch is a result; an expansion list is a plan. Dutch's 12-to-32 states is a plan; label it as such.
State the time and money used, if you can. 'Spent $[x] of $[y] raised over [n] months' lets the investor judge efficiency directly. It overlaps with a runway slide, so a reference may be enough.
Where the slide goes
Early. For a follow-on round, this is often the second or third slide, right after the company summary, because it answers the first thing a new investor asks. Dutch places it later, in a team section, which makes sense for a slide that is half about hires; a slide that leads with results belongs earlier.
If you also have a full milestones timeline, keep both: the timeline for the whole story, this slide for the last period against its plan. Use the same figures in each.
Measure row: '[Measure]: [value at last round] → [value now] (plan: [target by date]; [met / missed / changed])'.
Multiple without disclosure: '[n]x [measure] in [m] months since [stage]; now [range]'.
Miss: '[Goal] missed: [reason]. Changed: [what]. New target: [figure by date].'
What these examples can and cannot show
These four slides show how founders have described progress between rounds. They can't show whether the claims were accurate, what each earlier round was meant to achieve, or how investors reacted. We did not check the date or size of any round, Dutch's state count, Peppy's ARR multiple, IMMO's capital raised or Rohlik's order figures against outside sources. Rohlik chart readings are our estimates.
Treat them as patterns. Dutch shows how to tie progress to the round's date and gives one before-and-after, though for a plan rather than a result. Peppy shows a multiple that needs its base. IMMO shows the right frame with nothing measurable inside it. Rohlik shows a well-built track-record chart under a headline it can't prove on its own.
Common mistakes
No starting point. A current figure with nothing to compare it to.
Baseless multiple. '8x' with no base and no time window.
Activities as progress. Launches and hires listed with no results.
Unshown promises. Claiming to have delivered against a plan the reader can't see.
Plan read as result. An expansion list that looks like live markets.
Diagnostic checklist
Last round named with month and amount.
Each measure shown then and now.
Multiples carry a base or time window.
Results compared with the original plan.
Misses stated with what changed.
Frequently asked questions
Should I show goals we missed?
Yes, briefly, with the reason and what you changed. Existing investors know the plan, and a new investor may ask them.
What if we pivoted since the last round?
Say so on this slide: what the round was for, why you changed course and what the new direction has achieved since.
How we chose these examples
Corpus: published pitch deck teardowns on StartupFundraising.com. Founder-uploaded private decks are excluded.
Selection (2026-10-01): we searched extracted slide text for phrases describing progress since a funding round or against earlier promises, excluded listed companies, funds, mining and bank presentations, and kept four private-company slides each taking a different approach.
Review: the four slides were rendered from the source decks on 2026-10-01 and read in full at full size against company, deck and page number, with small print enlarged (editorial model review, with AI assistance in drafting; not human-reviewed). Chart readings are estimates from the axis. No figure, round date or round size was checked against outside sources.