Social Media Followers on a Pitch Deck: When an Audience
Follower counts persuade investors only when they connect to something the business needs: customers, cheap acquisition or a launch audience.
Social Media Followers on a Pitch Deck: When an Audience Counts as Traction
Consumer founders often put their Instagram, TikTok or Facebook numbers on the traction slide. Sometimes that's the most honest evidence they have; sometimes it fills space that sales figures should occupy. Investors know a follower costs nothing to give and can be bought, so a bare count rarely moves them. What moves them is a following tied to something the business needs. This guide uses four real slides to show the difference.
TL;DR
Show a following when it does a job in your argument, and present it so the reader can judge it: give each platform separately, with a date and how fast it grew, and connect it to sales, sign-ups or acquisition cost. Bitspawn's slide gives three platforms separately with start dates and pairs them with a dated sign-up chart, but doesn't show whether followers became users. Angeleno Artistry puts '10k+ Instagram Followers' below 750 paying customers and $60k of revenue, which is the right order. Clean Kitchen Club's '100K+ followers across our platforms' merges every platform into one undated number. Bravo Sierra mixes followers, 'reach' and views into one panel. Followers support a claim of cheap, owned reach; they are not customers.
Four ways to present a following, from dated and separate to merged
Each slide is read at full size. Quotes are exact.
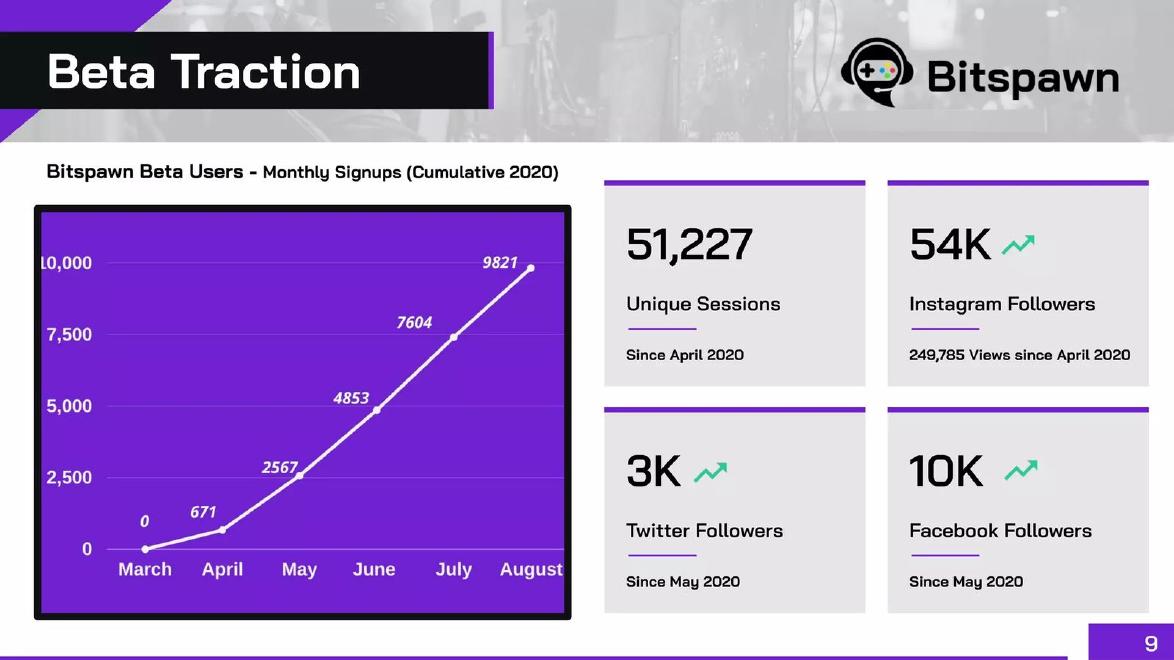
Bitspawn traction slide — slide 9
Esports platform in beta. Sign-up chart with four metric panels.
Bitspawn deck, slide 9. Exact stored slide matched to this analysis.
Our analysis: Well separated and dated; no link between followers and sign-ups.
Evidence and limitation: Per-platform counts with start dates, next to the product's sign-up metric.
What a founder can adapt: Add the share of sign-ups that came from social.
Supporting analysis
What the deck claims: "54K Instagram Followers, 249,785 Views since April 2020"; "3K Twitter Followers Since May 2020"; "10K Facebook Followers Since May 2020"; beside "Monthly Signups (Cumulative 2020)" reaching 9,821 in August.
Presentation choice: Shows the clearest way to lay out a following.
When it does not fit: Growth arrows with no growth figure.
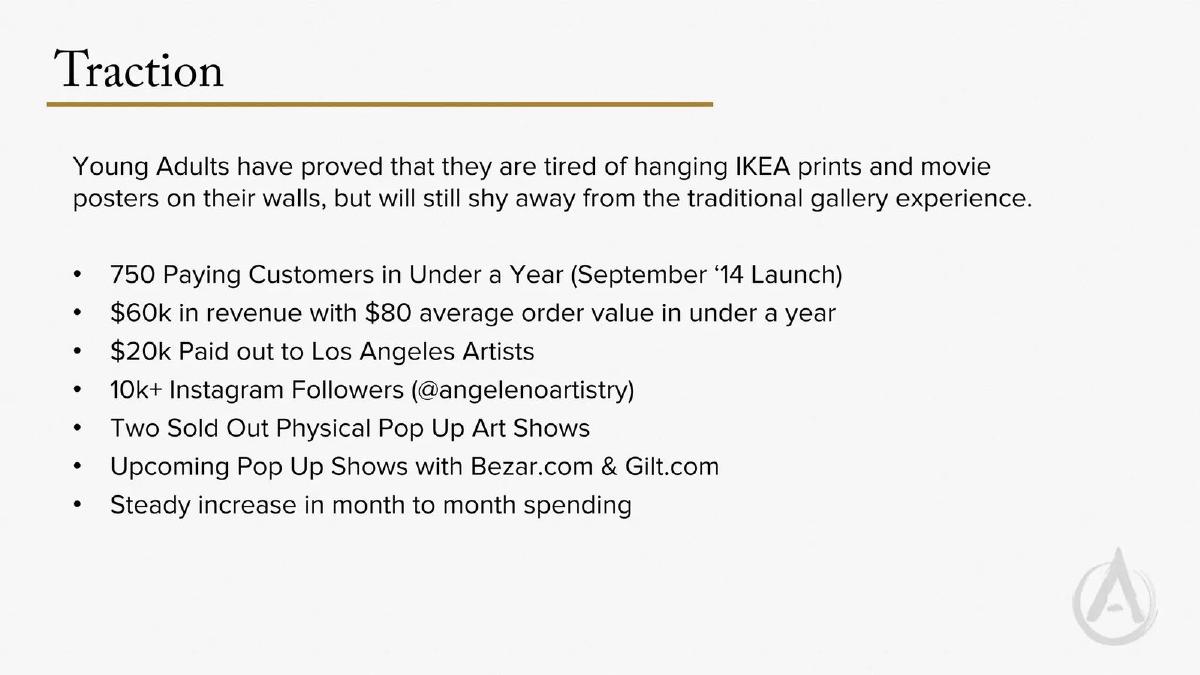
Online art marketplace for Los Angeles artists. Seven-bullet traction list.
Angeleno Artistry deck, slide 3. Exact stored slide matched to this analysis.
Our analysis: Right order of evidence; followers not connected to sales.
Evidence and limitation: Followers listed fourth, after customers, revenue and artist payouts; handle given.
What a founder can adapt: Say what share of orders came through Instagram.
Supporting analysis
What the deck claims: "750 Paying Customers in Under a Year (September '14 Launch)"; "$60k in revenue with $80 average order value in under a year"; "10k+ Instagram Followers (@angelenoartistry)".
Presentation choice: Shows a following kept in its place below commercial results.
When it does not fit: Leaving the reader to guess whether the audience drives sales.
Show growth over a stated period, not just a total.
Put customers and revenue above followers.
Connect followers to an outcome: sign-ups, sales or lower acquisition cost.
Don't add followers, reach and views together.
Plan your audience line
Answer these before adding follower counts.
Purpose. What does the following prove: cheap acquisition, launch audience or demand?
Platforms. What is the count on each platform, and on what date?
Growth. From what number, over what period, and was any of it paid?
Outcome. What share of sign-ups or sales came from social?
Order. Is the following below your customer and revenue evidence?
Copyable framework: "Instagram: [X] followers ([date]), up from [Y] in [month]; [Z]% of orders came from social, all organic."
Illustrative example 1 — written by us
Before: "Strong community with 100K+ followers across our platforms"
After: "Instagram [X]K, TikTok [Y]K ([date]); our [site] opening sold [N] meals in week one from social posts alone."
What improved: Our illustrative rewrite. The bracketed figures are left blank because the slide doesn't give them.
The question this guide answers
This guide answers one founder question: should I put my social media following on my pitch deck, and if so, how do I present it so it counts?
Our waitlist guide warns against merging waitlist sign-ups with followers, and our media and food traction guides mention audiences in passing. Our influencer marketing guide covers paying other people's audiences to promote you. None of them is about a company's own following as evidence: when it helps, which details make it credible, and where on the slide it belongs. That's a common decision for consumer brands, apps and creators, and it's easy to get wrong.
How we chose and read the examples
We searched extracted slide text across the library for follower counts, such as '54K Instagram followers' or '300K followers'. There were 57 matches. Many referred to influencers, celebrities or advisors rather than the company's own accounts, so we set those aside. We excluded listed-company presentations and kept four private-company slides where the company's own following is presented as evidence and where each shows a different way of presenting it: Bitspawn, Angeleno Artistry, Clean Kitchen Club and Bravo Sierra.
Each slide was rendered from its source deck and read at full size. Bitspawn's slide also appears in our cumulative-versus-period guide, where the lesson is about its sign-up chart; here the lesson is about its follower panels. We did not check any follower count against the platforms or any other figure against company records.
What a follower count can and cannot show
A follower is someone who tapped a button once. It costs them nothing, many accounts are inactive, and followers can be bought. That's why an investor reads a follower count as weak evidence on its own.
But a following can support real claims. It can show that a brand reaches people without paying for each one, which matters when acquisition cost is a worry. It can show an audience ready for a launch. And, combined with sales data, it can show that people who follow go on to buy.
To support those claims, a count needs context: which platform, when the count was taken, how fast it grew and from what start, and ideally a link to an outcome, such as the share of sales from social or the cost per customer from organic posts. Without that, a reader can't tell a 50,000 audience built in six months of real engagement from one built over five years with paid promotion.
Platforms separated and dated: Bitspawn
Bitspawn's 'Beta Traction' slide has a line chart on the left, 'Bitspawn Beta Users - Monthly Signups (Cumulative 2020)', rising from 0 in March to 9,821 in August. On the right are four panels: '51,227 Unique Sessions Since April 2020'; '54K Instagram Followers, 249,785 Views since April 2020'; '3K Twitter Followers Since May 2020'; and '10K Facebook Followers Since May 2020'. The three follower panels carry green rising arrows.
This is the clearest presentation of the four. Each platform has its own number. Each has a start date, so the reader knows the counts were built over a few months, not years. And the follower numbers sit beside the actual product metric, sign-ups, which keeps them in their place.
What's missing is the link. 54,000 Instagram followers and 9,821 sign-ups are on the same slide, but nothing says how many sign-ups came from Instagram. If most did, that's a strong acquisition story; if few did, the followers are an audience the product hasn't converted. The arrows also suggest growth without saying how much. One line, such as 'About [X]% of sign-ups came from social, by referral source', would turn three vanity numbers into an acquisition channel.
Followers kept below revenue: Angeleno Artistry
Angeleno Artistry's 'Traction' slide is a list of seven bullets. In order: '750 Paying Customers in Under a Year (September '14 Launch)'; '$60k in revenue with $80 average order value in under a year'; '$20k Paid out to Los Angeles Artists'; '10k+ Instagram Followers (@angelenoartistry)'; 'Two Sold Out Physical Pop Up Art Shows'; 'Upcoming Pop Up Shows with Bezar.com & Gilt.com'; and 'Steady increase in month to month spending'.
The order is right. Paying customers and revenue come first, followers come fourth. A reader sees that this is a business with sales and also an audience, not an audience hoping to become a business. The handle is given, so anyone can look the account up.
The figures can be cross-checked in one direction: 750 customers at an $80 average order would be about $60,000 if each customer ordered once, which matches the revenue line. That consistency helps credibility. What the slide doesn't do is connect the 10,000 followers to the 750 customers. For an art brand selling to young adults, Instagram is probably the main discovery channel, and saying so with a share of orders would make the follower count part of the sales argument rather than a separate boast.
Platforms merged, no date: Clean Kitchen Club
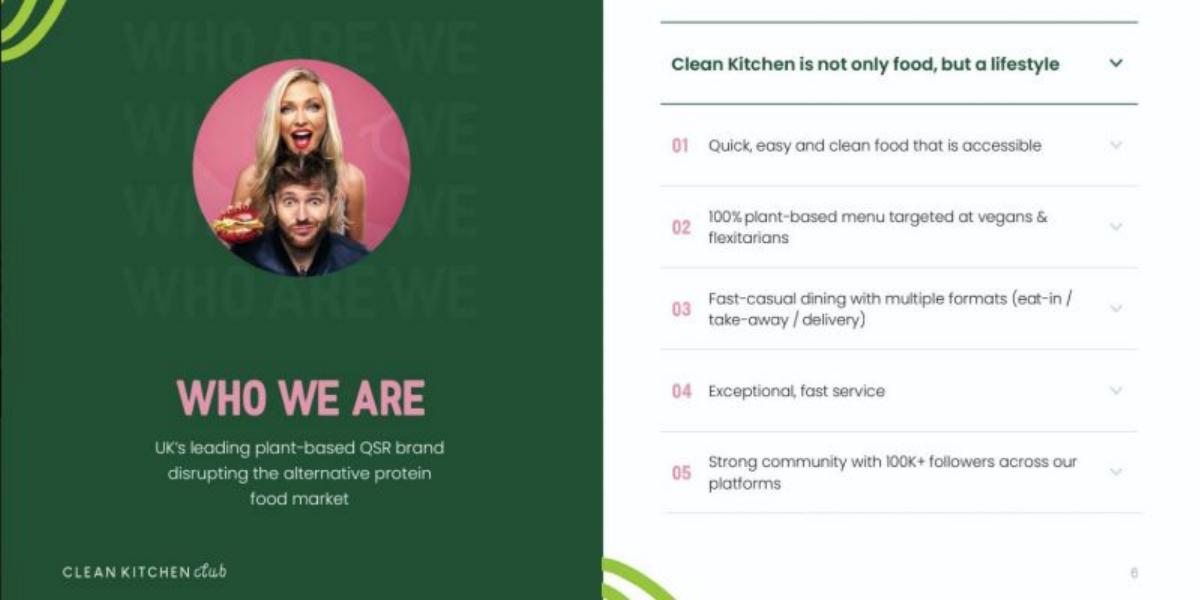
Clean Kitchen Club's 'Who We Are' slide describes the company as the 'UK's leading plant-based QSR brand disrupting the alternative protein food market'. A five-point list on the right ends with: '05 Strong community with 100K+ followers across our platforms'.
For a restaurant brand, a large local following can matter: it can fill a new location on opening day without paid advertising. But this count gives the reader nothing to judge that by. 'Across our platforms' adds together accounts that may overlap, so one person following on Instagram and TikTok counts twice. There's no date, no split by platform and no growth. And the word 'community' implies engagement the slide doesn't measure.
The fix is straightforward: list the main platforms separately with a date, and, if the following really drives openings or orders, say how. For example, a new site's first-week sales after an announcement only on social would be much stronger evidence than the total.
The 'leading' claim beside it has no measure either. That's a separate problem, covered in our market leadership guide, but it compounds this one: two unmeasured claims on the same slide.
Followers, reach and views in one panel: Bravo Sierra
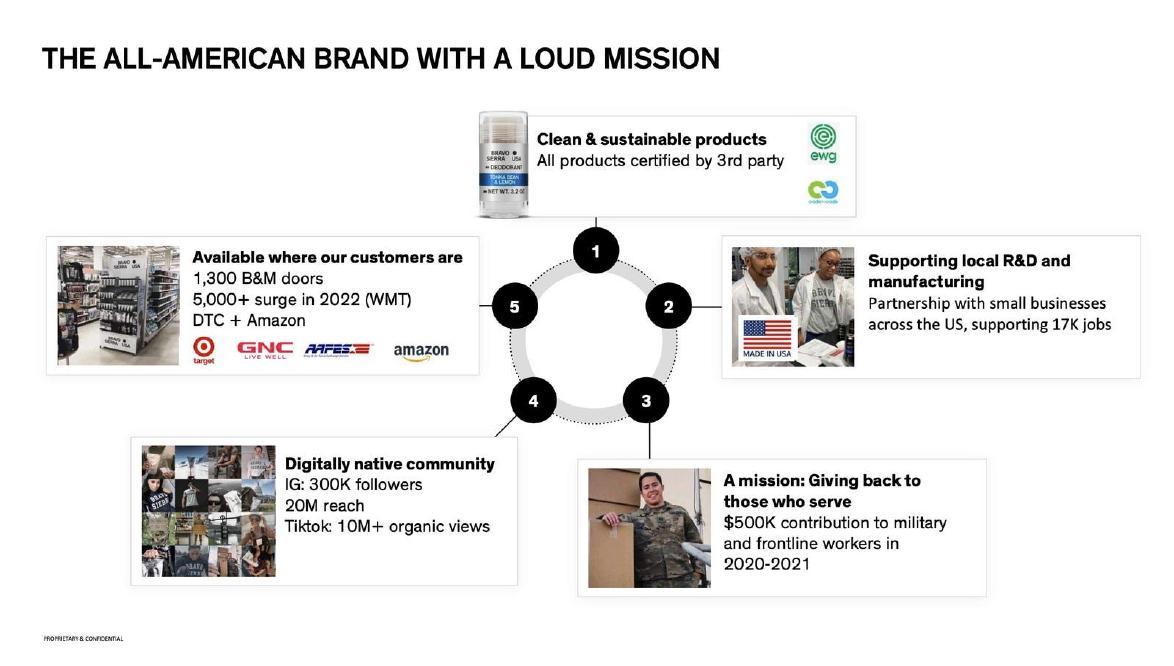
Bravo Sierra's slide, 'The All-American Brand With a Loud Mission', arranges five panels around a circle. Panel 4, 'Digitally native community', reads: 'IG: 300K followers', '20M reach', 'Tiktok: 10M+ organic views'. Other panels cover retail distribution ('1,300 B&M doors', '5,000+ surge in 2022 (WMT)', 'DTC + Amazon'), third-party certification, US manufacturing and a '$500K contribution to military and frontline workers in 2020-2021'.
The panel gives three different measures that are easy to confuse. Followers are people who chose to follow the account. Reach usually means the number of unique accounts that saw content over some period. Views count each time a video was played, including repeats. Each is a real figure, but they can't be added or compared, and the slide doesn't give a period for reach or views or say which platform the 20M reach is on.
'Organic' is the most useful word in the panel. It says the TikTok views weren't paid for, which supports a claim of cheap reach. Bravo Sierra also has the evidence that matters most for a consumer brand on the same slide: 1,300 retail doors. Linking the two, for example by showing that social activity drives sell-through in those doors, would make the community panel part of the distribution story rather than a separate one.
How to present your following
Decide what the following proves. Pick one: it lowers acquisition cost, it gives you a launch audience, or it shows demand before sales. If you can't name what it proves, leave it off or put it in the appendix.
Separate platforms. One line per platform, with the count and a date. Followers on different platforms overlap, so a total overstates the audience.
Show growth. 'From 2,000 to 54,000 between April and August' says far more than '54K'. If growth came from paid promotion, say so.
Keep measures apart. Followers, reach, impressions and views measure different things. Label each and give the period for the last three.
Connect to an outcome. The share of sign-ups or orders that came from social, the conversion rate from a launch post, or the acquisition cost from organic channels compared with paid. Even one such figure lifts the rest of the panel.
Order the slide by strength. Revenue and customers first, product usage second, audience last. Investors read the order as your own ranking of the evidence.
Give the handle. It lets an investor look, and signals you're comfortable with them doing so.
When to leave followers off
If your buyers are businesses, a company account's followers say little about demand; leave them off unless the account itself drives leads, and then show the leads.
If the following is small relative to the claim you're making, a low number can hurt more than no number. And if your following was largely bought or built for a different product, it isn't evidence for this one.
What these examples can and cannot show
These four slides show how founders have presented their own social following and what each presentation lets an investor conclude. They cannot show whether the followers were active, whether they became customers, or whether the slides helped the companies raise money.
We did not check any follower count against the platforms, and counts change daily. Our reading of Angeleno Artistry's revenue arithmetic assumes one order per customer, which the slide doesn't state; it is a consistency check, not a verified figure.
Common mistakes
Combined totals. Audiences overlap across platforms; give each separately.
No date. A count without a date can't show growth.
Mixed measures. Followers, reach and views are different numbers.
Followers above sales. Lead with customers and revenue.
No outcome. Show what the following does for the business.
Diagnostic checklist
Purpose of the following named.
One count per platform, dated.
Growth over a stated period.
Paid or organic stated.
Link to sign-ups, sales or acquisition cost.
Placed below commercial evidence.
Frequently asked questions
Do investors care about social media followers?
Only as context. A following that demonstrably brings in customers at low cost is useful; a bare count is not.
Should I include engagement rate?
If you can state how it's calculated and over what period, yes; it says more about an audience's quality than its size does.
How we chose these examples
Corpus: published pitch deck teardowns on StartupFundraising.com. Founder-uploaded private decks are excluded.
Selection (2026-10-01): we searched extracted slide text for follower counts (57 matches), set aside influencer, celebrity and advisor audiences, excluded listed-company presentations, and kept four slides presenting the company's own following in different ways.
Review: the four slides were rendered from the source decks at full size on 2026-10-01 and read in full against company, deck and page number (editorial model review, with AI assistance in drafting; not human-reviewed). No follower count or company figure was checked against platforms or outside records.