Project IRR, NPV and Payback in a Pitch Deck: Show
How asset-heavy startups should show the return on one plant, site or property in a pitch deck: project vs equity IRR, the NPV discount rate and timing.
Project Returns in Your Pitch Deck: IRR, NPV and Payback an Investor Can Rebuild
Startups that build physical assets — a fuel plant, a hostel, a solar and computing site, a real-estate project — often sell the business on the return of one asset: "92% IRR", "NPV of $150 million", "pays back in 38 months". Those figures are only useful if an investor can see what they are measured on. Four real decks show the range. Verdis prints the full fifteen-year cash flow table behind its plant's NPV, IRR and break-even, which lets us recalculate every figure, and two of them do not match the basis they appear to use. Nomuri Hostel shows equity returns after a mortgage with a stated discount rate. RiverArch labels its returns "unlevered" beside a cost that includes financing. AGV Protocol states an IRR range with no asset cost or period. This guide shows which return to show, what has to sit beside it, and how to check it before an investor does.
TL;DR
Show a project return only with its basis. Say whether the IRR is for the whole project before any borrowing (unlevered or project IRR) or for the equity after debt payments (levered or equity IRR); the second is usually higher and riskier. Give the NPV with its discount rate and say when the first cash flow happens, because spreadsheet NPV functions discount the first value by a full period unless you add the year-0 investment separately. State payback in months on cash, not on accounting profit, and say from when it is counted. Then show the cash flow line it all comes from — investment, yearly cash in, yearly cash out, period — and how much of that project the company being funded actually owns.
Four real project-return slides
Each slide below is shown as it appears in the company's original deck, with what it says, what we recalculated and what an investor still cannot tell. They run from most to least checkable.
Verdis financials slide — slide 28
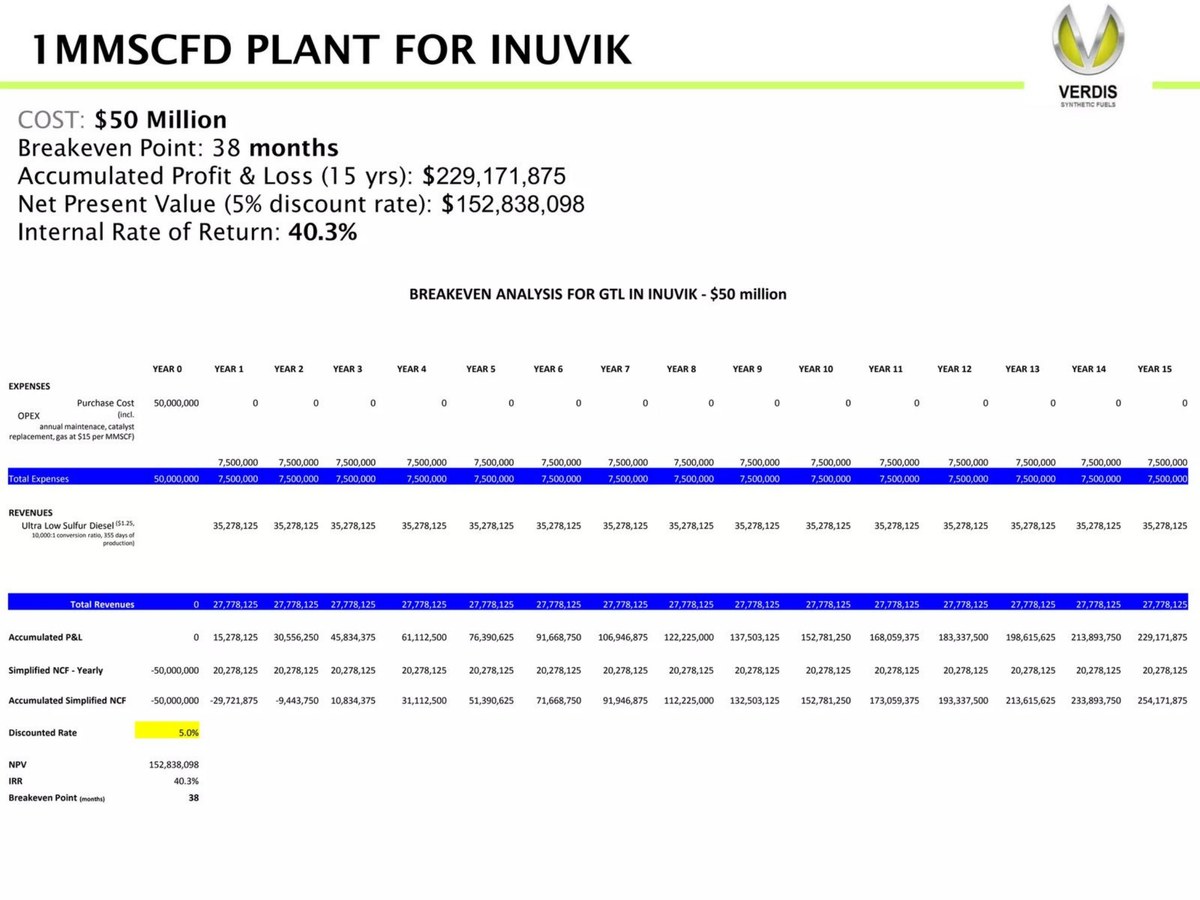
Gas-to-liquids company building modular plants that turn flared gas into diesel; page 28 of a 47-page 2015 investor deck, one of several single-plant pages (page 22 shows an offshore plant at two costs).
Verdis deck, slide 28. Exact stored slide matched to this analysis.
Our analysis: The most checkable slide in this set, and the reason it is checkable is that the table is printed. That transparency is a strength even though our recalculation finds issues: an investor can see the inputs, test a higher discount rate and question the labels. The fixes are small: compute NPV with the investment outside the function, base payback on the same cash line as the IRR, and label every deduction.
Evidence and limitation: Our recalculation from the printed table. IRR: −$50,000,000 then $20,278,125 for 15 years gives 40.3%, matching the slide. NPV: discounting year 1 to 15 at 5% and subtracting the $50M paid today gives about $160.5M. The printed $152,838,098 equals that figure divided by 1.05 exactly, the result of placing the year-0 cost inside a spreadsheet NPV function. Payback: cumulative simplified cash flow turns positive during year 3, about 30 months if spread evenly; the printed 38 months is close to the accounting-profit line (about 39 months). Two other points the slide does not explain: "Total Revenues" is $7.5M below diesel revenue, and net cash is a further $7.5M below that, so a $7.5M deduction appears twice; and the accounting line subtracts about $5M a year for 15 years, $75M in total on a $50M plant.
What a founder can adapt: Keep the table; add NPV at a second, higher rate, label the cost lines, and state payback on cash from a named start date.
Supporting analysis
What the deck claims: "1MMSCFD Plant for Inuvik". "Cost: $50 Million. Breakeven Point: 38 months. Accumulated Profit & Loss (15 yrs): $229,171,875. Net Present Value (5% discount rate): $152,838,098. Internal Rate of Return: 40.3%". A 15-year table: purchase cost 50,000,000 in year 0; opex 7,500,000 a year; ultra-low-sulphur diesel revenue 35,278,125 a year; "Total Revenues" 27,778,125; accumulated P&L 15,278,125 a year; "Simplified NCF - Yearly" −50,000,000 then 20,278,125; "Discounted Rate 5.0%".
Presentation choice: It shows how much a printed cash flow line lets an investor verify, and the common spreadsheet NPV error.
When it does not fit: Don't put the year-0 investment inside a spreadsheet NPV function, and don't let payback and IRR rest on different lines.
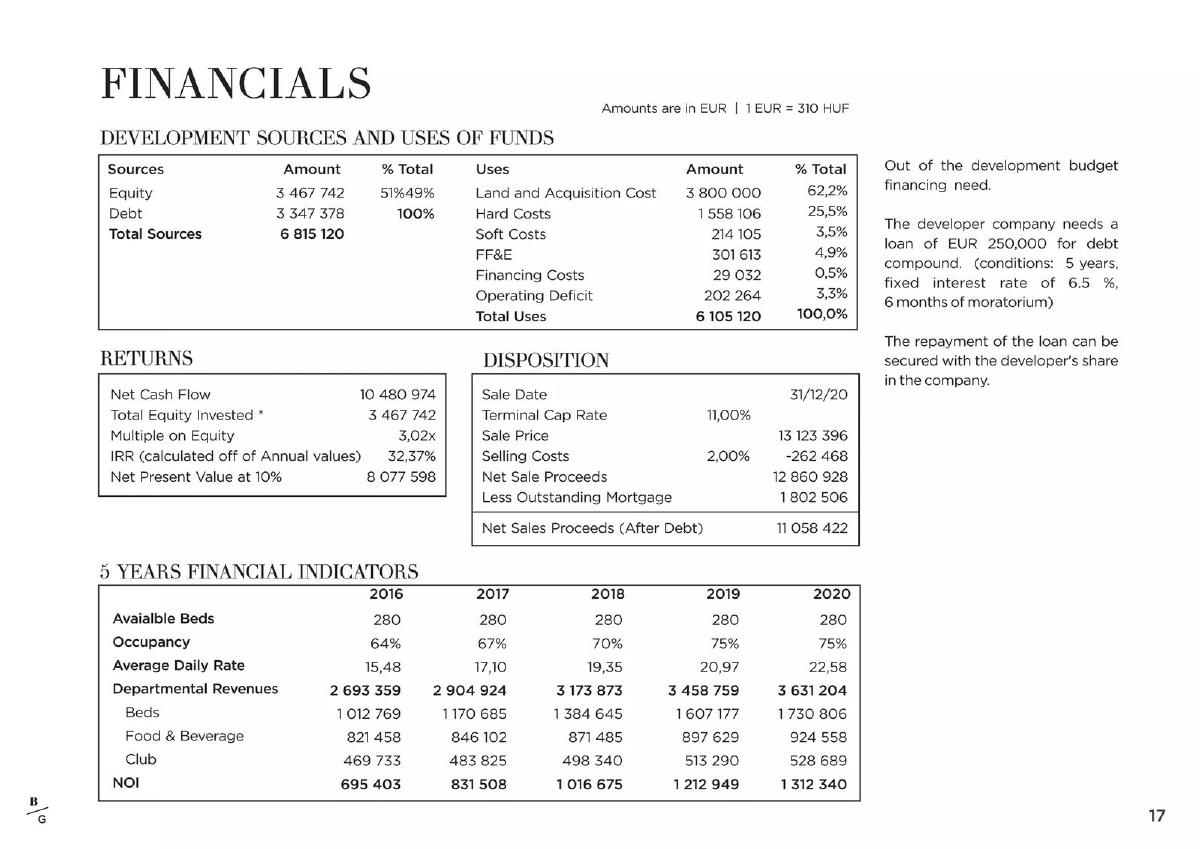
Budapest hostel development (amounts in euros); page 17 as printed, PDF page 18. Our investor-returns guide uses this page for the investor's multiple; here it illustrates a levered asset return.
Nomuri Hostel deck, slide 18. Exact stored slide matched to this analysis.
Our analysis: A clear levered return with its discount rate printed and the mortgage visibly deducted. What it lacks is the word "equity" beside the IRR and NPV, and an unlevered figure for comparison, so a reader cannot tell how much of the 32% comes from the loan. The NOI-to-sale-price link should show which year's income the cap rate is applied to.
Evidence and limitation: Our checks: 10,480,974 ÷ 3,467,742 = 3.02x; 13,123,396 × 98% = 12,860,928; less the mortgage, 11,058,422 — all match. The return is after debt, so it is an equity IRR, though not labelled as one. Two points an investor would ask about: sources exceed uses by €710,000, and the sale price equals 2020 NOI capitalised at 10% (1,312,340 ÷ 0.10 = 13,123,400), not the printed 11%; it would also match an unshown 2021 NOI about 10% higher at 11%.
What a founder can adapt: Label it "equity IRR after debt", add the project IRR before debt, and show which year's NOI the exit cap rate uses.
Supporting analysis
What the deck claims: Sources: equity 3,467,742, debt 3,347,378, total 6,815,120. Uses total 6,105,120. "Returns": net cash flow 10,480,974; total equity invested 3,467,742; multiple on equity 3.02x; "IRR (calculated off of Annual values)" 32.37%; "Net Present Value at 10%" 8,077,598. "Disposition": sale 31/12/20, terminal cap rate 11.00%, sale price 13,123,396, selling costs 2.00% (−262,468), net sale proceeds 12,860,928, less outstanding mortgage 1,802,506, net after debt 11,058,422. Five-year NOI rises from 695,403 (2016) to 1,312,340 (2020).
Presentation choice: It shows a levered asset return, and why the basis must be named even when the inputs make it inferable.
When it does not fit: Don't present an equity IRR beside other projects' unlevered figures as if they were comparable.
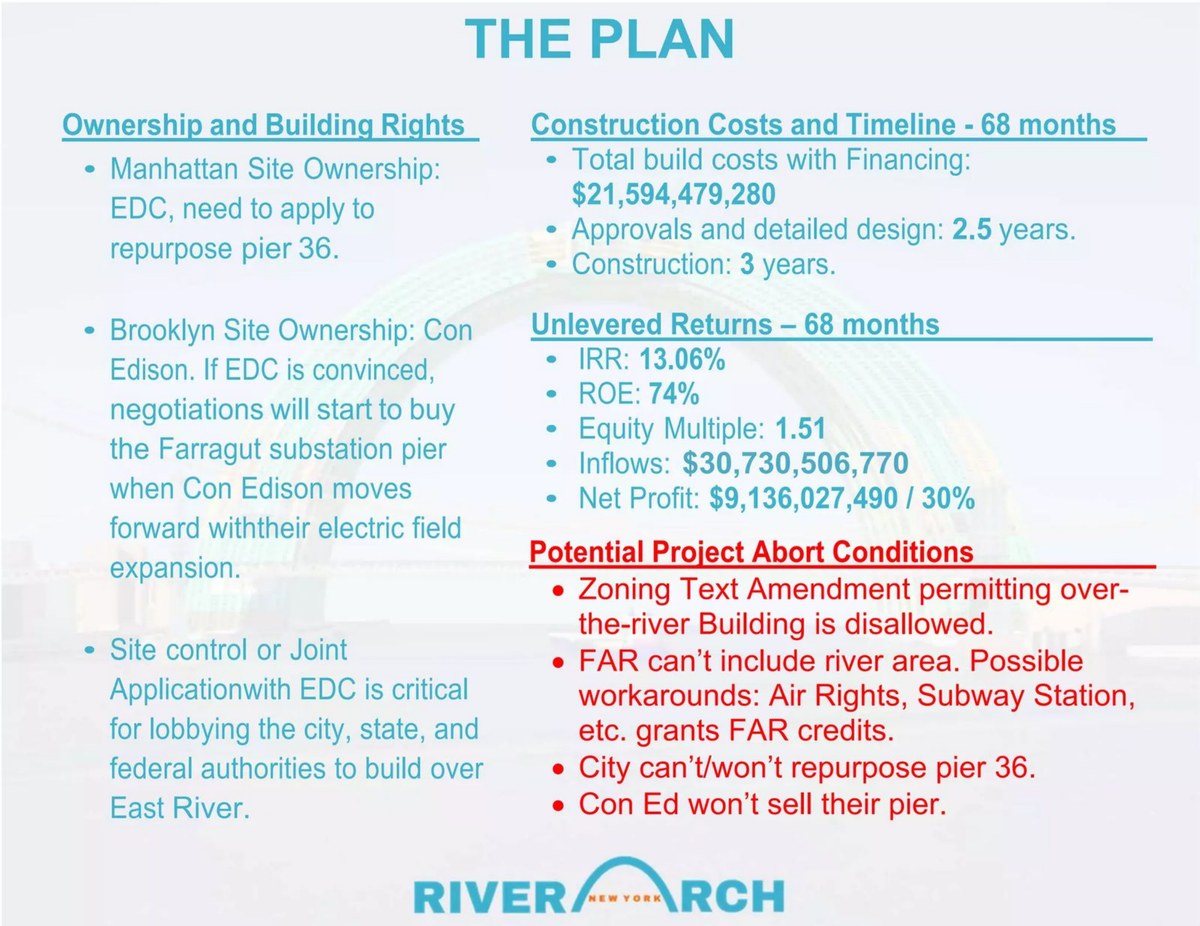
Proposed New York real-estate development over the East River; sponsor summary deck, page 18 of 23, "The Plan".
RiverArch deck, slide 18. Exact stored slide matched to this analysis.
Our analysis: Strong on risk disclosure: listing the conditions under which the project would be abandoned is unusual and useful. Weak on basis: "unlevered" sits beside a cost that includes financing, the multiple does not match the printed inflows and costs, and three different return measures (IRR, ROE, multiple) are given without saying what each is measured on.
Evidence and limitation: Our checks: inflows minus costs is $9,136,027,490, matching the printed profit; that profit is 29.7% of inflows (the printed 30%) and 42.3% of costs. Inflows ÷ costs is 1.42, not the printed 1.51 equity multiple. If every cost were paid at the start and every inflow received at month 68, the IRR would be about 6.4% a year; the printed 13.06% implies costs spread later or inflows earlier, which the slide does not show. The 74% ROE has no stated basis.
What a founder can adapt: Show project costs without financing for the unlevered figure, and add a separate equity line with the loan, if equity returns matter.
Supporting analysis
What the deck claims: "Construction Costs and Timeline - 68 months": "Total build costs with Financing: $21,594,479,280"; approvals and design 2.5 years; construction 3 years. "Unlevered Returns – 68 months": IRR 13.06%, ROE 74%, equity multiple 1.51, inflows $30,730,506,770, net profit $9,136,027,490 / 30%. "Potential Project Abort Conditions": four zoning and site-control conditions.
Presentation choice: It shows how a basis label can contradict the numbers beside it, and why a multiple should equal inflows over outflows.
When it does not fit: Don't show three return measures where one, clearly defined, would do.
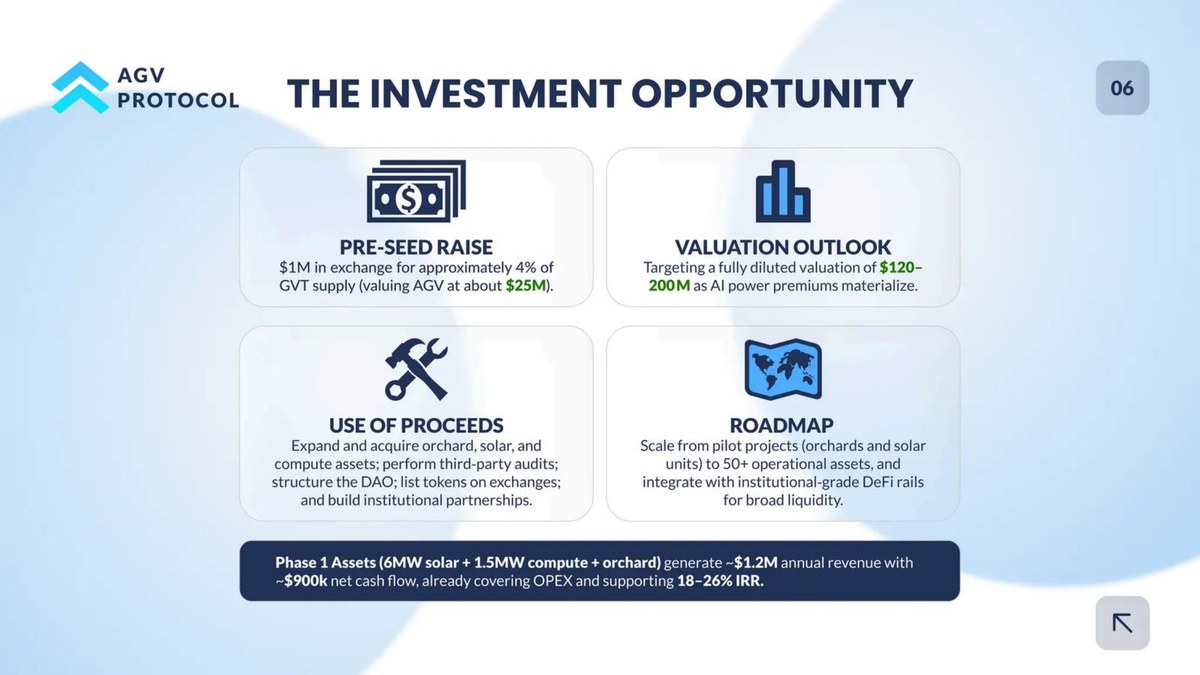
Token project combining orchard, solar and AI-computing assets; institutional deck, PDF page 7 (printed "06"), "The Investment Opportunity".
AGV Protocol deck, slide 7. Exact stored slide matched to this analysis.
Our analysis: The least checkable return in the set. Putting asset cash flow beside the raise is the right instinct: it connects the asset to the company. But an IRR range with no investment, life or basis cannot be rebuilt, and nothing on the page explains how asset cash reaches holders of the token being sold.
Evidence and limitation: Directly visible: yearly revenue and net cash flow for the first assets, and an IRR range. Not stated: what the assets cost, how long they run, whether the IRR is before or after any debt, or whose return it is (the asset owner's or token holders'). Our illustration only: if the assets ran 20 years with no residual value, an 18% IRR on $900k a year would imply about $4.8M of cost, and 26% about $3.4M; the slide gives no figure to confirm either. $1M for about 4% implies $25M, matching the printed valuation.
What a founder can adapt: Add "Phase 1 cost $[x]M; [y]-year life; project IRR before debt" and one line on how asset cash flows to token or share holders.
Supporting analysis
What the deck claims: "Pre-seed raise: $1M in exchange for approximately 4% of GVT supply (valuing AGV at about $25M)". "Valuation outlook: targeting a fully diluted valuation of $120–200M". "Phase 1 Assets (6MW solar + 1.5MW compute + orchard) generate ~$1.2M annual revenue with ~$900k net cash flow, already covering OPEX and supporting 18–26% IRR."
Presentation choice: It shows the minimum an IRR needs, and the gap between an asset's return and an investor's return in the company.
When it does not fit: Don't give an IRR range without the investment it is a return on.
The inputs an asset-level return needs, and which each slide provides.
Slide
IRR basis
NPV rate and timing
Payback basis
Cash flows shown
Link to company
Verdis p28
Project (no debt shown)
5%; year 0 discounted (our check)
38 months; basis unclear
Full 15-year table
Not on this page
Nomuri Hostel p18
Equity, after mortgage (inferred)
10%
Not shown
Totals, NOI and exit
Equity sources shown
RiverArch p18
Labelled unlevered; cost includes financing
Not shown
Not shown
Totals only
Not shown
AGV Protocol p7
Not stated
Not shown
Not shown
Revenue and net cash only
Beside the raise; mechanism unstated
Key Takeaways
Name the IRR basis: project (before debt) or equity (after debt). Mixing them overstates or understates the return by several points.
An NPV needs a discount rate and a timing convention. Put the year-0 investment outside the spreadsheet NPV function, or the result is wrong.
Count payback on cash flow, in months, from a stated start (order, construction or first revenue).
Print the yearly cash flows, or at least the investment, annual net cash and life. A return range with no asset cost cannot be checked.
Make the labels agree. "Unlevered" returns cannot sit on costs that include financing; a multiple must equal inflows over outflows on the same basis.
Connect the asset to the company. Say how much of each project the company owns and how many projects the round pays for.
Build your project-return line
Answer each prompt before you put an IRR, NPV or payback on a slide.
Asset. Which single asset is this: one plant, one site, one property? What does it cost, including construction?
Cash. What net operating cash does it produce each year, for how many years, and what is it worth at the end?
Basis. Is the IRR before debt (project) or after debt (equity)? If equity, how much is borrowed and on what terms?
Discount rate. Which rate, and why? Show a second, higher rate an early-stage investor might use.
Timing. Is the investment at year 0 outside the NPV function? When does payback start counting?
Company link. What share of each asset does the company own, and how many assets does this round fund?
Copyable framework: [Asset]: $[cost] cost; $[net cash] a year for [life] years. Project IRR [x]% before debt; NPV $[a] at [r1]%, $[b] at [r2]%; cash payback [m] months from [start]. Company owns [share]%; this round funds [n] assets.
Illustrative example 1 — written by us
Before: Net Present Value (5% discount rate): $152,838,098. Internal Rate of Return: 40.3%. Breakeven Point: 38 months.
After: Plant cost $50M; net cash $20.3M a year for 15 years. Project IRR 40% before debt; NPV about $160M at 5% (investment at year 0); cash payback about 30 months from start-up.
What improved: Built from Verdis' page 28 using its printed cash flow line; the NPV and payback are our recalculation, not the company's figures. Adds a second discount rate if you have one.
Illustrative example 2 — written by us
Before: IRR (calculated off of Annual values) 32.37%; Net Present Value at 10% 8,077,598
After: Equity IRR 32.4% after a €3.35M mortgage; equity NPV €8.1M at 10%. Project IRR before debt: [x]%.
What improved: Built from Nomuri Hostel's page 18. The "equity" label is our reading of its inputs; the project IRR is a placeholder the slide does not give.
When an asset-level return belongs in the deck
Most venture decks never mention IRR or NPV for an individual asset; they show company revenue, margins and an exit. But a growing group of startups make money by building and running physical things: modular plants, energy sites, data centres, hostels, vertical farms, charging networks. For them the economics of one asset are the business model. An investor asks first whether a single plant or site makes money, and only then whether the company can build many.
That is where project returns help. An internal rate of return (IRR) is the yearly rate at which the asset's cash flows repay its cost; a net present value (NPV) is the value of those cash flows today, after subtracting the cost and discounting future money at a chosen rate; payback is how long the cash takes to repay the cost. Each answers a slightly different question, and each can be computed on different bases. The figures on the four slides below range from 13% to 92% a year, but the larger problem is that most of them cannot be compared, because they are not measured on the same thing.
This guide is about presenting asset returns on a slide. It is not financial or investment advice, and it does not replace a full financial model in your data room. If you raise money for the company rather than for one project, show company-level numbers too; our investor-returns guide covers the return on the investor's stake in the company, which is a different calculation.
Project IRR or equity IRR: say which one
A project IRR (also called unlevered or asset IRR) treats the asset as if it were paid for entirely with cash: the cost goes out, the operating cash comes in, and the rate is calculated on that. An equity IRR (levered) first subtracts any loan: the equity holders put in less, but they receive only what is left after interest and loan repayments. When the asset earns more than the loan costs, the equity IRR is higher than the project IRR; when it earns less, it is lower. Both are legitimate. They are not interchangeable.
Nomuri Hostel's page 17 (PDF page 18) shows an equity return. Its sources table lists equity of €3,467,742 and debt of €3,347,378. Its "Returns" box shows net cash flow of €10,480,974 on that €3,467,742 of equity, a 3.02x "Multiple on Equity" (our check: 10,480,974 ÷ 3,467,742 = 3.02), a 32.37% IRR "calculated off of Annual values", and an NPV "at 10%" of €8,077,598. The "Disposition" box subtracts the "Outstanding Mortgage" of €1,802,506 from net sale proceeds, which confirms that the return is after debt. The slide does not use the words "equity IRR", but every input points to it. An investor comparing this with an unlevered figure from another project would need to know that.
RiverArch's page 18 does the opposite: it labels its returns "Unlevered Returns – 68 months" — IRR 13.06%, ROE 74%, equity multiple 1.51 — but the cost line above reads "Total build costs with Financing: $21,594,479,280". An unlevered return should exclude financing costs; if they are included in the cost, the return is neither purely unlevered nor a true equity return. Choose one basis, label it, and use costs that match it.
NPV needs a discount rate and the right timing
An NPV depends on two choices the slide must show: the discount rate, and when each cash flow happens. Verdis and Nomuri print their rates (5% and 10%). The rate matters a great deal: Verdis' fifteen-year plant at 5% is worth far more today than the same plant at 10% or 15%, which is closer to what many investors would demand from an early, unproven technology. If you use a low rate, say why (a contracted buyer, a government-backed price), or show the NPV at a second, higher rate too.
Timing is the quieter error. Spreadsheet NPV functions assume every value in the list arrives at the end of a period, so the first value is discounted by one full period. Microsoft's documentation for Excel's NPV function states that if the first cash flow occurs at the beginning of the first period, it must be added to the NPV result rather than included in the values. If the year-0 investment is placed inside the function, the whole result is divided by one plus the rate. Our recalculation of Verdis' table below shows exactly this pattern. (Microsoft Support)
Payback on cash, from a stated date
Payback is the figure investors read fastest, so it must be on the same basis as the rest. Count it on cash flow, not accounting profit: profit subtracts depreciation, a non-cash charge that spreads the asset's cost over its life, and so it counts the cost twice if you also subtract the investment up front. State where the clock starts — the order, the start of construction, or the first day of operation — because for a plant that takes eighteen months to build, the three can be years apart.
Verdis prints "Breakeven Point: 38 months" above a table in which cumulative simplified cash flow is negative €9,443,750 at the end of year 2 and positive €10,834,375 at the end of year 3. Spread evenly through year 3, that is about 30 months. The 38 months is close to what the yearly accounting-profit line implies (50,000,000 ÷ 15,278,125 per year ≈ 3.3 years, about 39 months). The slide does not say how 38 was calculated, so we cannot say which is intended; but the two lines on the same table give different answers, and an investor will notice.
Show the cash flow line it comes from
An IRR, NPV or payback figure on its own is a conclusion. The evidence is the cash flow behind it: the investment, the yearly cash coming in, the yearly cash going out, how long the asset runs, and what it is worth at the end. Verdis prints all of these for its Inuvik plant, which is why its figures can be checked at all. AGV Protocol prints a yearly revenue and net cash flow (about $1.2M and $900k) but no asset cost and no life, so its "18–26% IRR" cannot be rebuilt from the slide.
You do not need fifteen columns on a slide. One line is enough for most audiences: "Cost $50M; net cash $20.3M a year for 15 years; project IRR 40% before debt; NPV $160M at 5%, $77M at 15%; payback 30 months from start-up." Put the full table in the appendix or data room, and make sure every figure on the slide can be reproduced from it.
Connect one asset to the company and the ask
A strong project return does not by itself make a strong investment in the company. Investors want to know three more things: how much of each project the company owns (all of it, a share alongside project investors, or only a licence fee from the owner), how many projects the round pays for, and who pays for the rest. Verdis' plant table is for one $50M plant; the company's raise is not on the same page. AGV's page sets the asset returns beside a token raise valuing the protocol at about $25M, which links them, but does not say how asset cash reaches token holders.
The cleanest structure is two lines on the financials slide: one asset (cost, yearly cash, project IRR, payback) and the company (number of assets planned, the company's share of each, total capital needed, and how much this round covers). That turns an impressive single figure into a plan an investor can weigh.
Worked example: one site, shown both ways (hypothetical)
This is our illustration, not a figure from any deck. A battery-storage startup builds a site for $10M. It earns $1.8M of net operating cash a year for 15 years, with no residual value. Project basis: the IRR is about 16.0% a year; the NPV at 8% is about $5.4M (1.8M × 8.56 − 10M), and at 12% about $2.3M (1.8M × 6.81 − 10M); simple payback on cash is 10 ÷ 1.8 ≈ 5.6 years, or about 67 months from start-up.
Equity basis: the company borrows $6M at 7% over 10 years, paying about $0.85M a year, and puts in $4M itself. Equity cash is about $0.95M a year for ten years and $1.8M a year for the last five. The equity IRR is about 24% a year — higher than the project's 16%, because the site earns more than the loan costs. Both figures are right; showing only the 24% without saying it is after a $6M loan would mislead.
On the slide: "Site: $10M cost; $1.8M net cash a year for 15 years. Project IRR 16% (before debt); NPV $5.4M at 8%, $2.3M at 12%; cash payback 67 months from start-up. With 60% debt at 7%: equity IRR 24%. Company owns 100% of each site; this round funds sites 1–2."
Common mistakes
Basis not named. A project IRR and an equity IRR differ by the effect of debt; say which one the figure is.
Year 0 inside NPV. Spreadsheet NPV discounts the first value; add the upfront investment separately.
Payback on profit. Accounting profit subtracts depreciation; count payback on cash, from a named start.
IRR without cost. A return range with no investment or life cannot be rebuilt or compared.
Labels contradict numbers. "Unlevered" beside financing costs, or a multiple that is not inflows over outflows.
Asset return as company return. Say how much of each asset the company owns and how the round funds it.
Diagnostic checklist
The asset, its cost and its life are stated.
Yearly net cash flow is shown or available in the appendix.
The IRR is labelled project (before debt) or equity (after debt).
The NPV shows its discount rate, with the year-0 investment outside the function.
A second, higher discount rate is shown for an early-stage technology.
Payback is in months, on cash, from a named start date.
Every return figure can be recalculated from the printed inputs.
The slide says what share of each asset the company owns and how many the round funds.
Frequently asked questions
Should a startup pitch deck show project IRR at all?
Only if the business is built on assets whose economics investors must judge one at a time: plants, energy sites, properties, machines. A software company should show unit economics and growth instead. If you do show it, show the basis and the inputs.
Is a higher equity IRR better than a project IRR?
Not on its own. Debt raises the equity IRR when the asset earns more than the loan costs, but it also raises risk: if the asset underperforms, the loan is still owed. Show both, with the loan terms.
What discount rate should I use for NPV?
There is no single right rate. Use one you can justify, and show the NPV at a higher rate that reflects early-stage technology or market risk. A positive NPV only at a low rate is a warning sign investors will notice.
Why does my spreadsheet NPV differ from my own calculation?
Spreadsheet NPV functions treat the first value as arriving at the end of period one. If your investment happens today, add it outside the function; Microsoft's documentation for Excel's NPV function describes this. (Microsoft Support)
How we chose these examples
Discovery (2026-10-04, run 41): after topic-led and heading-led searches had stopped producing candidates, we searched the durable corpus index for project-finance terms (IRR, NPV, net present value, discount rate, payback) and removed listed mining, oil, bank and fund decks. Of the startup pages left, four present a return on one asset with enough content to compare. Closest content read: the live investor-returns guide (return on an investor's stake in the company; it uses Nomuri's page for the multiple, not the asset basis), the live break-even and payback-period guides (company or customer payback, not asset IRR or NPV), the live scenarios guide and the utilization draft (occupancy and scenario ranges). None teaches project versus equity IRR, NPV timing or asset-to-company links.
Four pages were read from images rendered from the original deck files: Verdis 28 (with page 22 for context), Nomuri Hostel 18 (stored image reused and compared with the original), RiverArch 18 and AGV Protocol 7. Three new images were prepared at 1200px wide and uploaded through the standing slide-image workflow, then re-fetched byte-identical. Set aside: China Wind and P2 Solar (listed companies), Brvo (listed micro-cap), Storemates and Tstix (investor returns), Verdis 22 (same lesson) and InvestNet 18 (used for scenarios elsewhere).
Figures were recalculated from the printed inputs; where our result differs, both are shown and we do not assume an error when missing context could explain it. The worked example is hypothetical. Company figures are reported as printed and not verified. This guide explains presentation, not financial advice. Slide readings and analysis are an AI editorial model review, not human-checked.