Investor Returns on a Pitch Deck: What Does "10x in 3
How startups show projected investor returns (multiples, IRR and ROI) on a pitch deck.
How to Show Projected Investor Returns on a Pitch Deck So the Math Can Be Rebuilt
Ten slides from real pitch decks that promise investors a return: a multiple such as "10x in 3 years", an internal rate of return (IRR), or a percentage "ROI". For each, we record which of the five inputs behind a return figure the slide gives (amount invested, ownership, ownership after later rounds, exit value and holding period), rebuild the figure where we can, and note where the multiple, the IRR and the period disagree.
TL;DR
A projected return is the result of five inputs: what the investor pays, what share that buys, how much of that share survives later funding rounds, what the company is worth at exit, and how long the money is tied up. A return figure an investor can trust shows all five, so that the multiple and the IRR can be recomputed from the slide. Without them, "10x" is a wish, not a projection, and many investors will discount the slide or skip it.
In this set, Tstix shows every input and its 9.12x multiple and 56.8% IRR rebuild from its own table; Bridge Software's model rebuilds too, once you see that its "Return on Investment" is profit over cost rather than the full multiple; Nomuri Hostel's 3.02x multiple divides exactly. The problems: Koi Gardens promises 2x in four years alongside a 50% annual return, which cannot both be true; Choice n Cheers promises 10x in three years while its own valuation on the same slide supports about 4.5x; Mint.com's 25% IRR does not match the cash flows printed beside it; A-Savvy and AHNS give a multiple with no entry price at all.
Investor return slides from real pitch decks
Each example records the exact slide, the return it promises, which inputs it gives, and whether the figures rebuild. Checks and implied figures are our calculations.
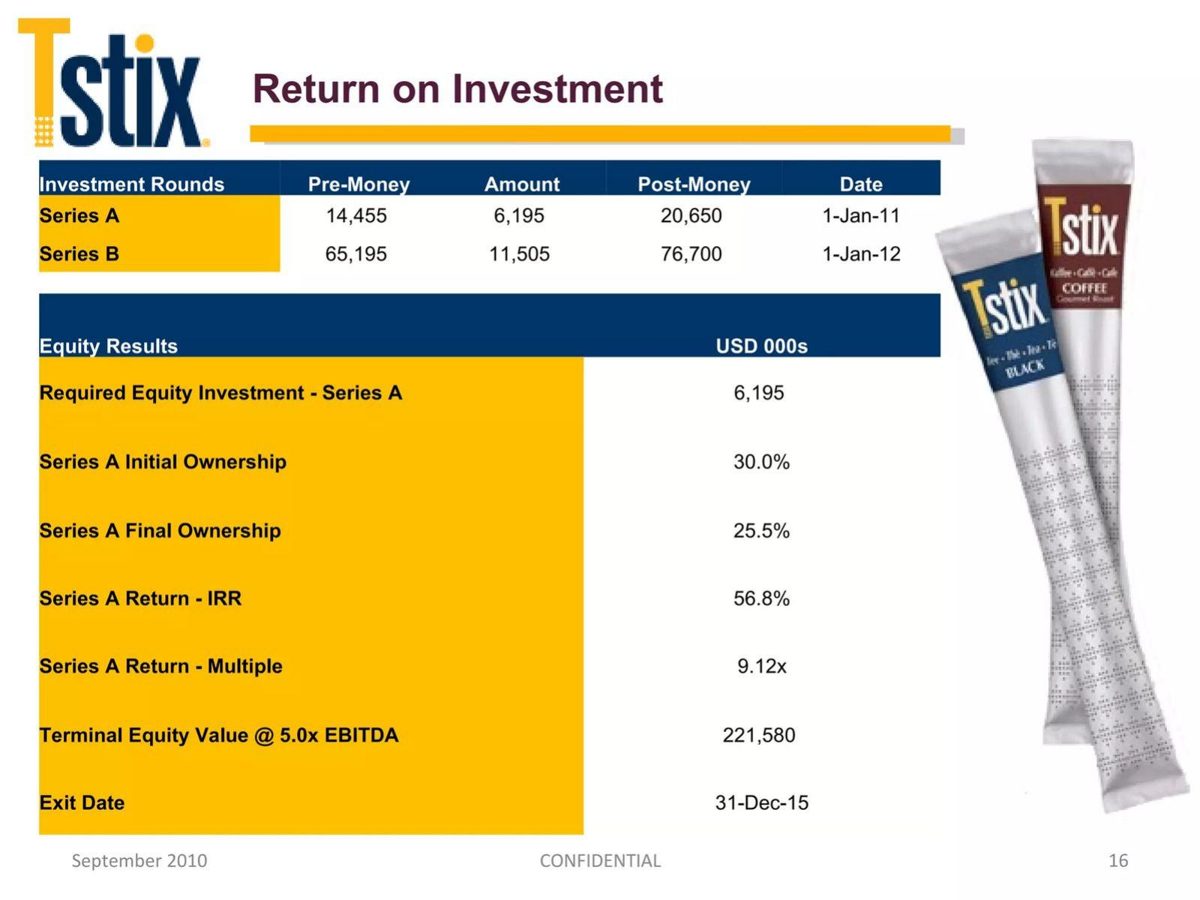
Tstix exit strategy slide — slide 16
Coffee stick brand. September 2010 deck; returns are projections.
Tstix deck, slide 16. Exact stored slide matched to this analysis.
Our analysis: Every input shown and the outputs rebuild; the exit EBITDA is the assumption to test.
Evidence and limitation: Our checks: 25.5% × $221,580k ≈ $56.5M = 9.12x; about 55.6% a year over five years. Implied 2015 EBITDA about $44.3M.
What a founder can adapt: Copy the table layout and add the exit-year EBITDA explicitly.
Supporting analysis
What the deck claims: Series A $6,195k at $20,650k post; Series B $11,505k at $76,700k post; ownership 30.0% falling to 25.5%; exit 31 Dec 2015 at 5.0x EBITDA, $221,580k; multiple 9.12x; IRR 56.8%.
Presentation choice: Entry, dilution, exit basis and date sit in one table.
When it does not fit: Don't leave the earnings behind the exit multiple off the slide.
Construction and property data software. Seed raise of $1M at $6M pre-money.
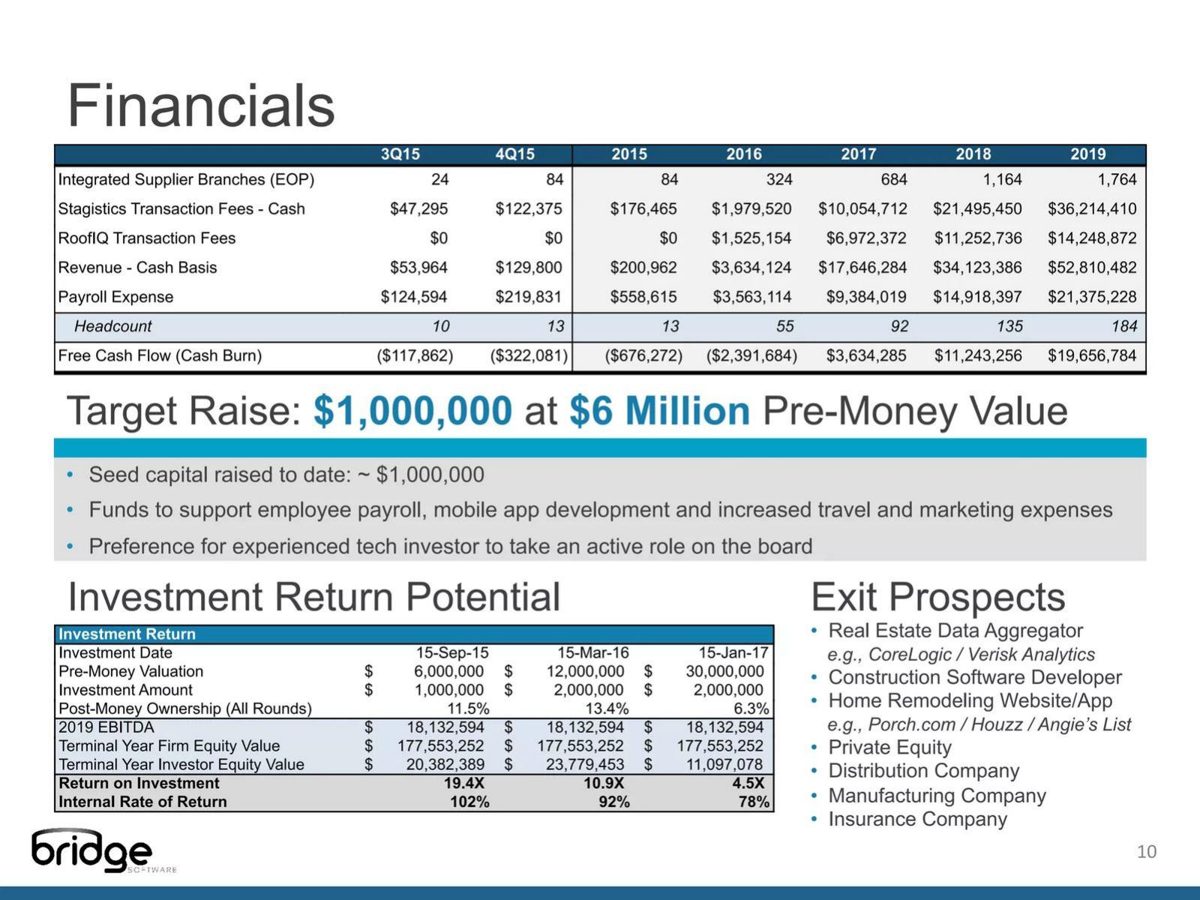
Bridge Software deck, slide 10. Exact stored slide matched to this analysis.
Our analysis: Consistent model with a label that understates the multiple by one.
Evidence and limitation: Our checks: investor values reconcile; full multiples are 20.4x, 11.9x and 5.5x, so ROI is profit ÷ cost; terminal value ≈9.8x 2019 EBITDA.
What a founder can adapt: Label the measure: multiple or profit ÷ cost.
Supporting analysis
What the deck claims: Three entry dates at $6M, $12M and $30M pre-money; ownership (all rounds) 11.5%, 13.4%, 6.3%; terminal firm value $177,553,252; ROI 19.4X, 10.9X, 4.5X; IRR 102%, 92%, 78%.
Presentation choice: Showing three entry points shows how price changes the return.
When it does not fit: Don't show diluted ownership without the rounds that dilute it.
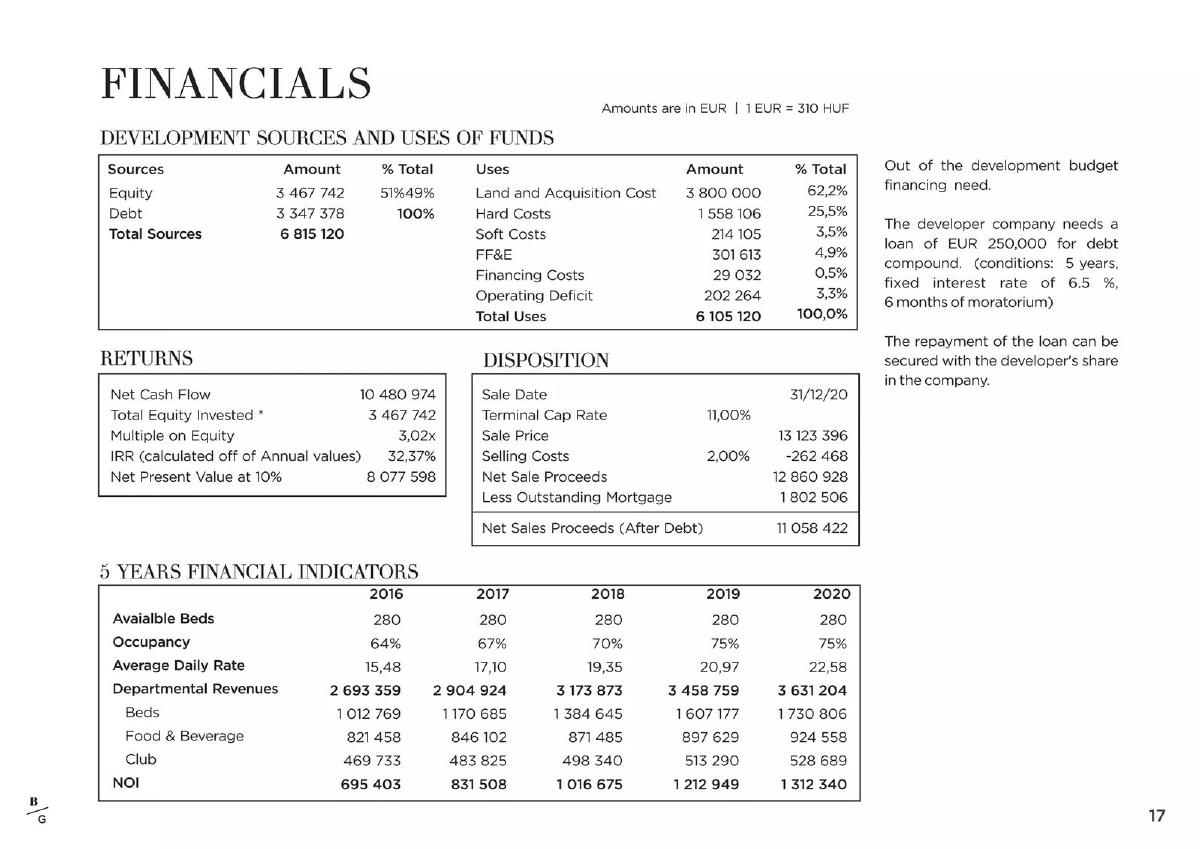
Nomuri Hostel deck, slide 18. Exact stored slide matched to this analysis.
Our analysis: Return math holds; the funding table does not balance.
Evidence and limitation: Our checks: 3.02x and the sale waterfall reconcile; sources exceed uses by €710,000.
What a founder can adapt: Show the exit waterfall from sale price to equity proceeds.
Supporting analysis
What the deck claims: Equity €3,467,742; net cash flow €10,480,974; multiple 3.02x; IRR 32.37%; sale 31/12/20 at 11.00% cap rate, €13,123,396, net after debt €11,058,422.
Presentation choice: The sale basis, costs and debt are all shown.
When it does not fit: Don't let sources and uses differ without explanation.
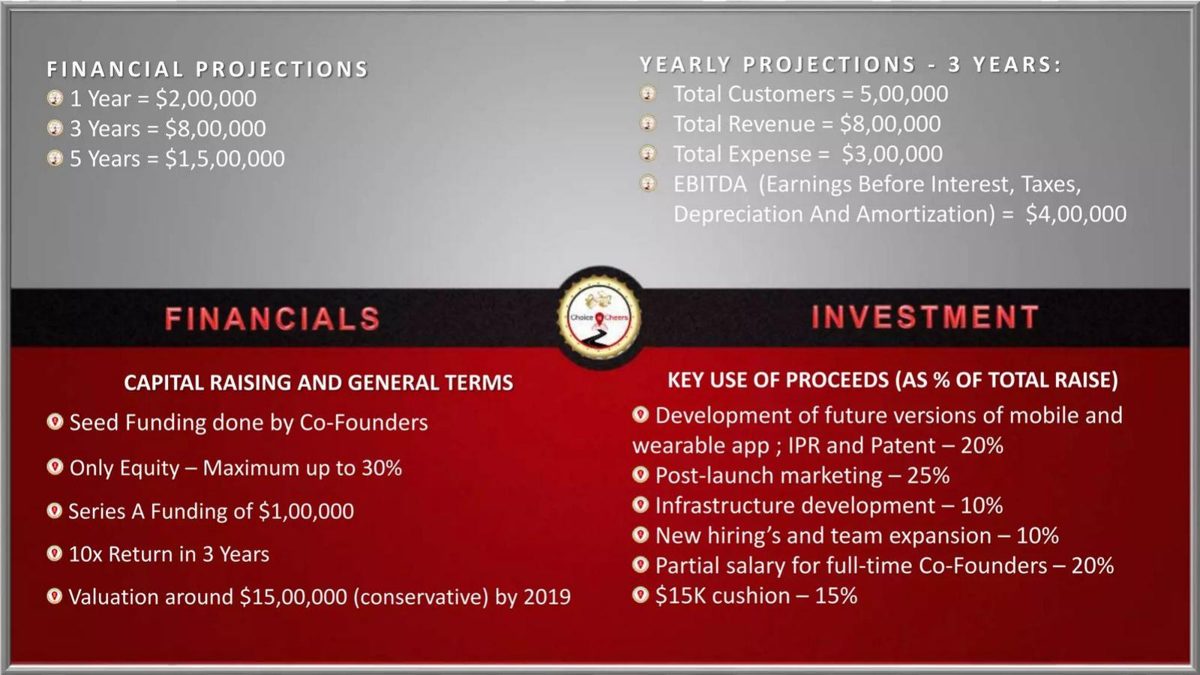
Consumer app. Series A of $1,00,000 for up to 30% equity.
Choice n Cheers deck, slide 14. Exact stored slide matched to this analysis.
Our analysis: The promised return contradicts the valuation beside it.
Evidence and limitation: Our calculation: 30% of $1.5M is $450,000, 4.5x; 10x needs about $3.3M. Revenue less expense is $5,00,000, not $4,00,000.
What a founder can adapt: Derive the multiple from your own valuation and stake.
Supporting analysis
What the deck claims: 10x Return in 3 Years; valuation around $15,00,000 (conservative) by 2019; 3-year revenue $8,00,000, expense $3,00,000, EBITDA $4,00,000.
Presentation choice: Both figures are on the same slide, so the check takes seconds.
When it does not fit: Don't state a return your own numbers don't support.
Mint.com deck, slide 16. Exact stored slide matched to this analysis.
Our analysis: Transparent method; the output doesn't match its own inputs.
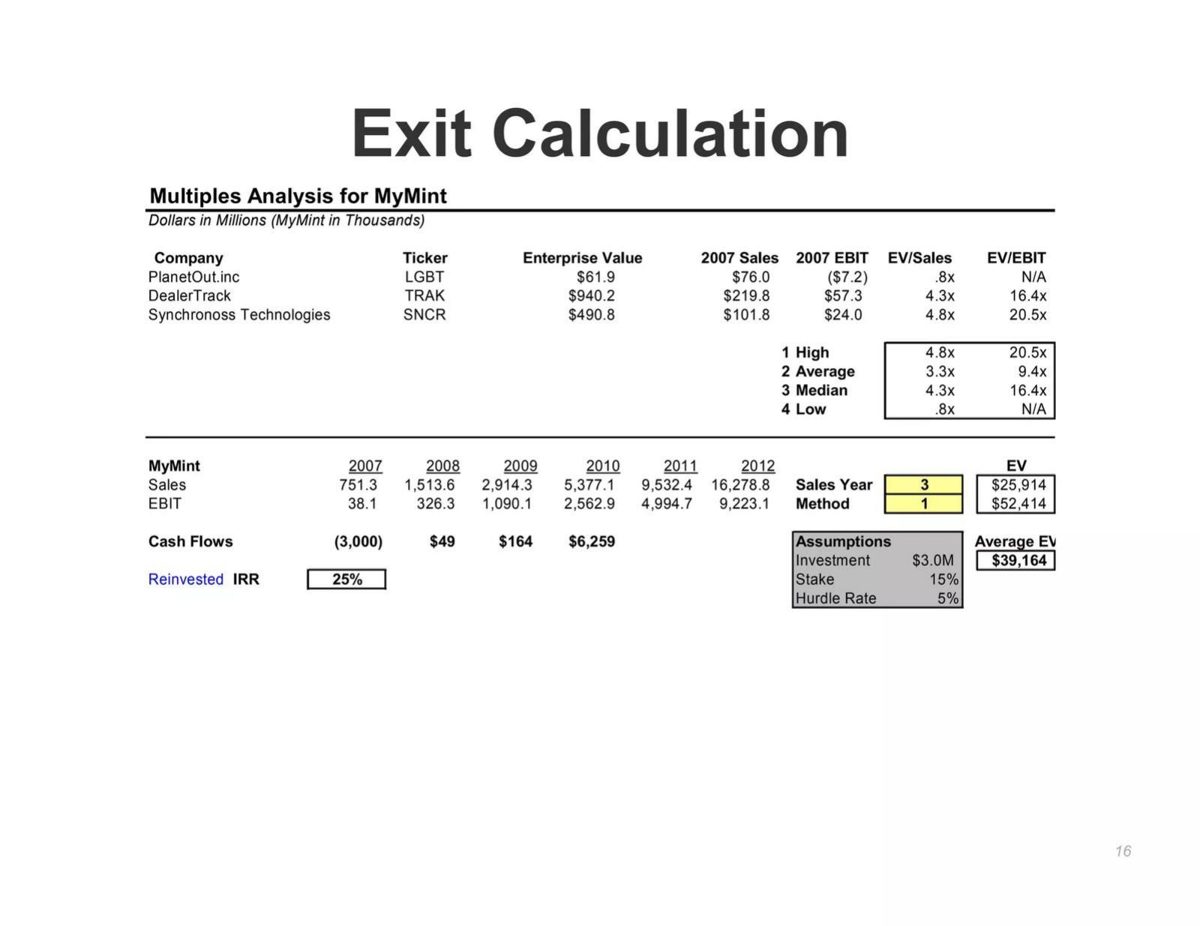
Evidence and limitation: Our checks: EV average confirmed; 15% of EV ≈ $5,875k, not $6,259k; printed flows give about 29%-30% IRR.
What a founder can adapt: Keep the method; recompute the final cash flow and IRR.
Supporting analysis
What the deck claims: Comparables' average EV/Sales 3.3x and EV/EBIT 9.4x applied to year-3 plan; average EV $39,164k; $3.0M for 15%; cash flows ($3,000), $49, $164, $6,259; reinvested IRR 25%.
Presentation choice: Exit value is tied to named comparables and plan figures.
When it does not fit: Don't round an IRR to a figure the flows can't produce.
Personal finance fintech. Exit slide citing acquirers.
A-Savvy deck, slide 8. Exact stored slide matched to this analysis.
Our analysis: A multiple without the price that produces it.
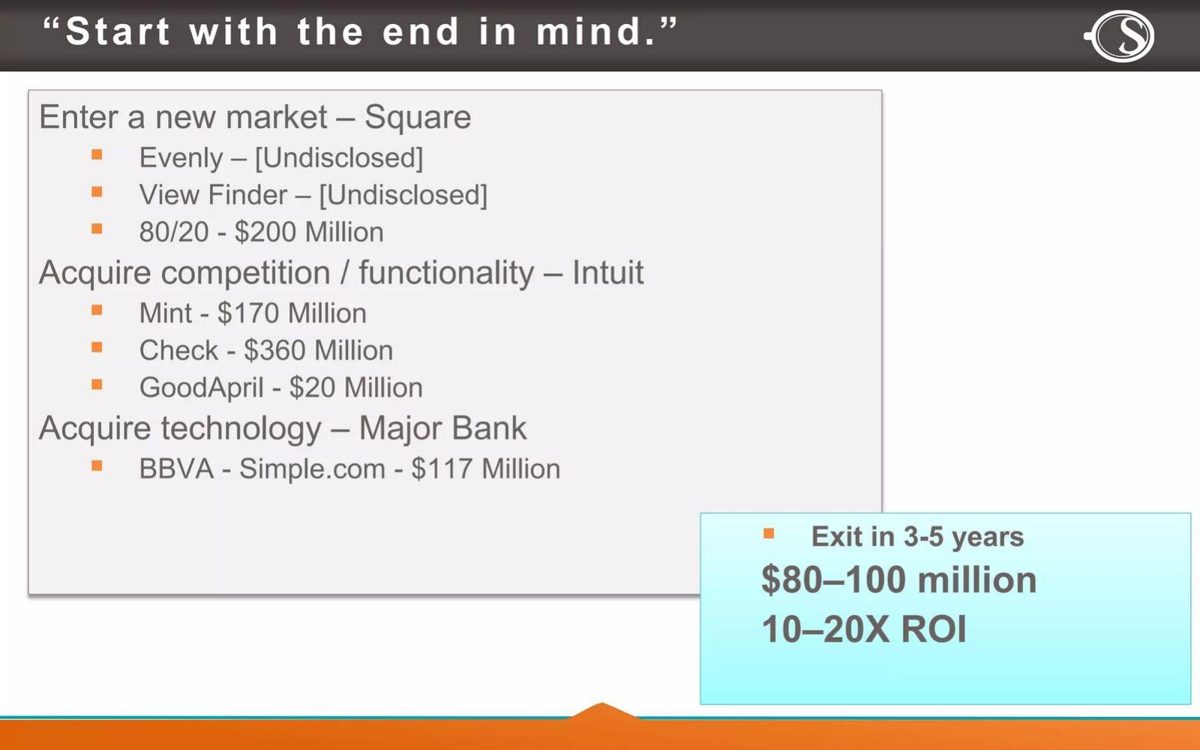
Evidence and limitation: Our calculation: 10x-20x of $80M-$100M implies a $4M-$10M entry with no dilution; no entry price is given.
What a founder can adapt: State the round's valuation and the dilution assumed.
Supporting analysis
What the deck claims: Square, Intuit and bank acquisitions (Mint $170M, Check $360M, GoodApril $20M, Simple.com $117M); exit in 3-5 years, $80-100 million, 10-20X ROI.
Presentation choice: Real comparables, but the return depends on an omitted input.
When it does not fit: Don't quote a multiple range with no entry price.
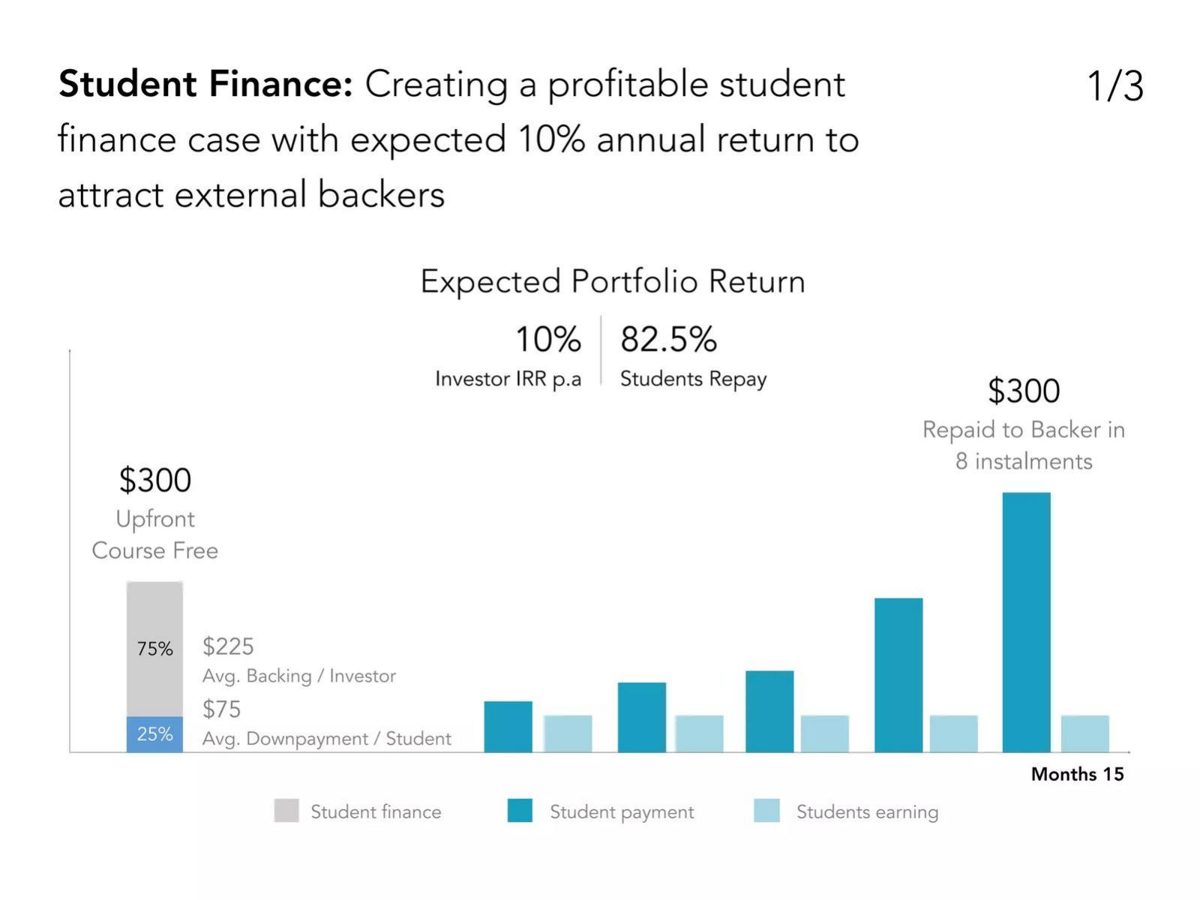
CodersTrust deck, slide 13. Exact stored slide matched to this analysis.
Our analysis: All inputs shown; the annual label is slightly generous.
Evidence and limitation: Our calculation: 82.5% × $300 = $247.50 on $225, a 10% total gain; about 8% a year over 15 months.
What a founder can adapt: Say whether the rate is total or annual and include losses.
Supporting analysis
What the deck claims: 10% investor IRR p.a.; 82.5% of students repay; $300 course, $225 backed, $75 student downpayment; $300 repaid in 8 instalments over about 15 months.
Presentation choice: Repayment rate, amounts and schedule make the return checkable.
When it does not fit: Don't label a total return as per annum.
Columns report what each slide states or leaves out; checks are our calculations.
Example
Measure
Entry price
Dilution
Exit basis
Rebuilds
Tstix
Multiple and IRR
Yes
Yes
5.0x EBITDA
Yes
Bridge Software
ROI (profit ÷ cost) and IRR
Yes
Implied
Terminal value
Yes, with label caveat
Nomuri Hostel
Multiple and IRR
Yes (equity)
Not applicable
11% cap rate
Yes; sources ≠ uses
Koi Gardens
2x and 50% a year
Loan amount
Not stated
Loan repayment
No, figures conflict
Choice n Cheers
10x
Yes
Not stated
Valuation stated
No, gives 4.5x
Mint.com
IRR
Yes
Not stated
Comparable multiples
No, about 30% not 25%
Switch
IRR and proceeds
Not stated
20% case
IPO value range
Approximately
A-Savvy
10-20X
Not stated
Not stated
Exit range
Cannot check
At Home Nursing
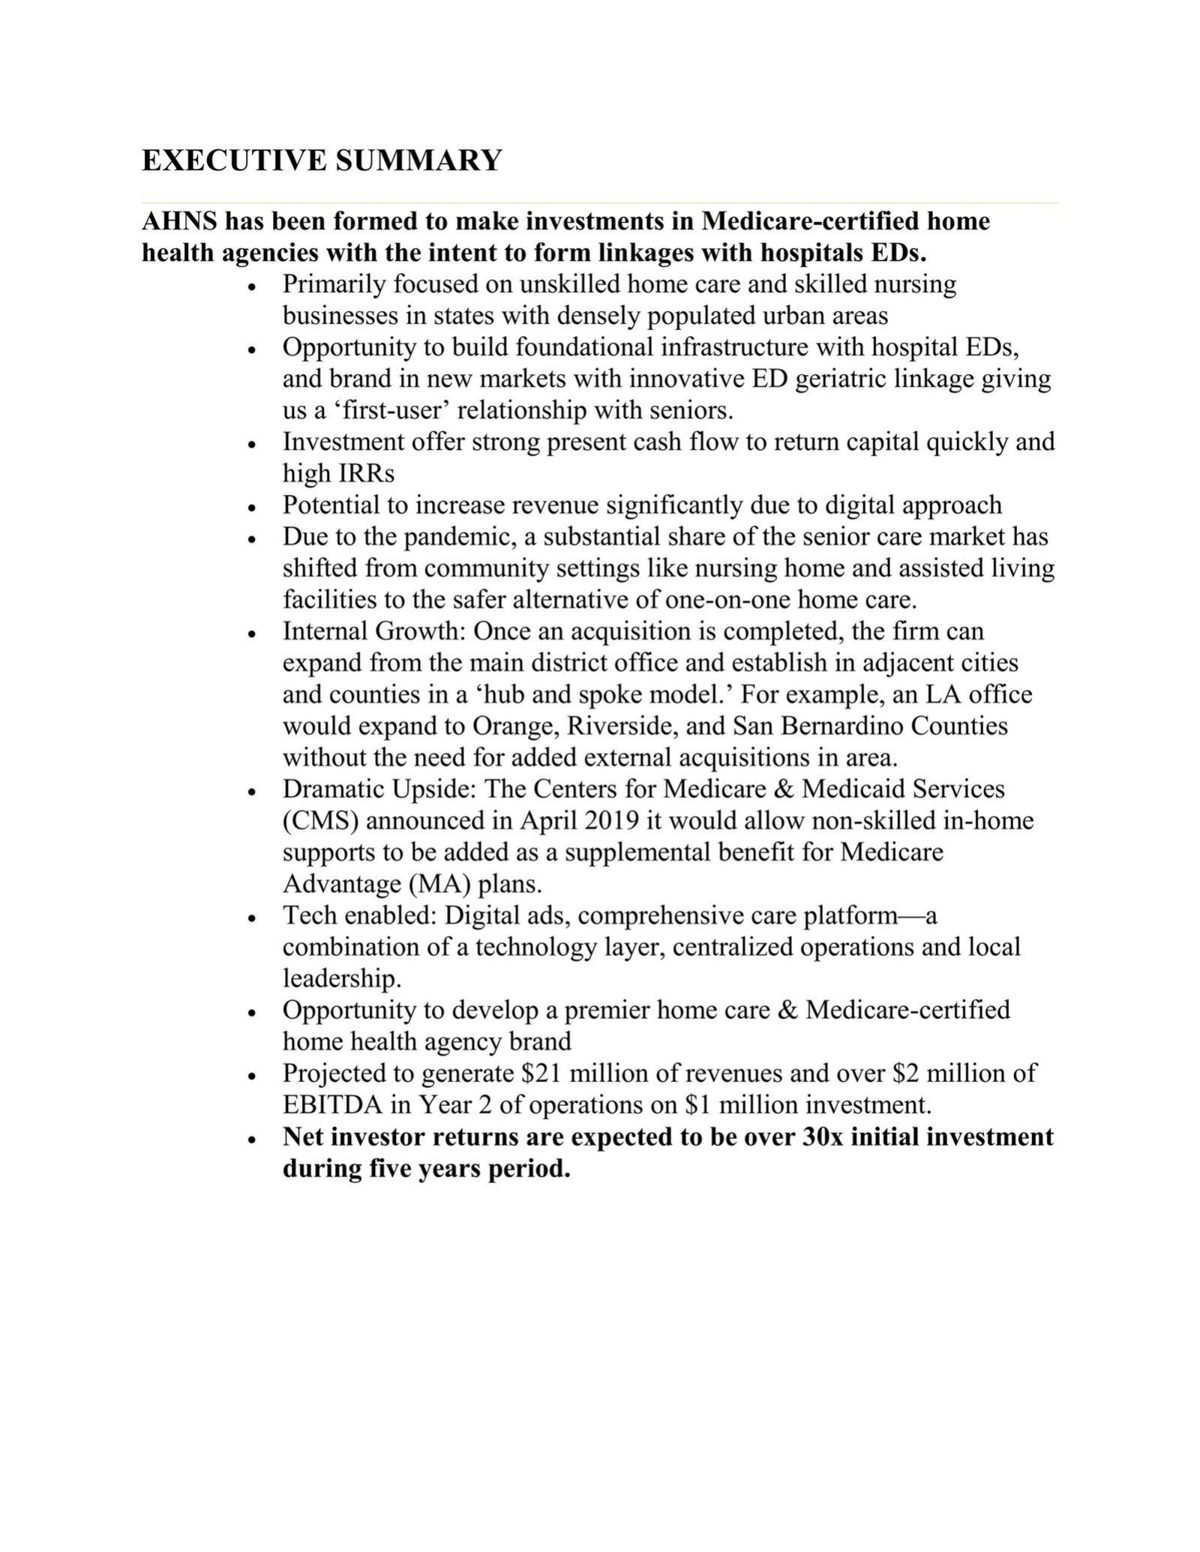
30x
$1M, no stake
Not stated
Not stated
Cannot check
CodersTrust
10% IRR
Yes
Not applicable
Repayment rate
Yes, about 8% a year
Key Takeaways
Show all five inputs: investment, ownership, dilution, exit value, years. Tstix does.
Say which multiple you mean. Bridge Software's 19.4X is profit over cost; the full multiple is about 20.4x (our calculation).
Make the multiple and IRR agree. Koi's 2x in four years is about 19% a year, not 50%.
Price the exit off something stated. Tstix uses 5.0x EBITDA; A-Savvy names no entry price.
Model dilution. Tstix takes Series A from 30.0% to 25.5% after Series B.
Keep the return consistent with your own valuation. Choice n Cheers' figures give about 4.5x, not 10x.
Build your investor return line
Fill in each field, then check the multiple against the IRR.
Entry. Amount invested and post-money valuation?
Ownership. Starting stake, and stake after each planned round?
Exit. Exit year and value, on what basis (multiple of which figure)?
Proceeds. Stake at exit × exit value, less debt or preferences?
Multiple. Proceeds ÷ investment, and is it labelled as a multiple or profit ÷ cost?
IRR. Multiple^(1/years) − 1: does it match the IRR you quote?
Copyable framework: [Amount] at [post-money] buys [x]%, diluted to [y]% by [rounds]; exit in [year] at [basis] = [value]; proceeds [z] = [multiple]x, [IRR]% a year.
Illustrative example 1 — written by us
Before: 10x Return in 3 Years
After: $100,000 for 30%; at the $1.5M 2019 valuation on this slide, proceeds $450,000 = 4.5x, about 65% a year.
What improved: Uses Choice n Cheers' own valuation and stake (our calculation).
Why investors are wary of a returns slide
An investor already knows how to work out a return; what they cannot know is the future exit value. A returns slide therefore adds information only when it exposes the assumptions: the valuation the investor enters at, the multiple of revenue or earnings used to value the company at exit, the year of exit, and how many further rounds will dilute the stake before then. A slide that shows these lets an investor substitute their own exit multiple and see what is left. A slide that shows only the answer asks the investor to accept the company's most optimistic assumption without seeing it.
This is why experienced founders of venture-backed companies often leave the returns slide out, and why it is most common in decks raising from angels, crowdfunding audiences or project investors, where the return is the main pitch. Both approaches are defensible. What is not defensible is a return figure that contradicts the deck's own numbers, and in this set several do.
The three common return measures are related but not interchangeable. A multiple (also called MOIC, multiple on invested capital) is money back divided by money in: $3 back on $1 is 3x. ROI is usually profit divided by cost: the same deal is a 200% ROI, or "2x" if the author writes ROI as a multiple, which is where confusion starts. IRR is the annual compound rate that turns the money in into the money back over the holding period. The same 3x is about 44.2% a year over three years and about 24.6% over five (our calculations). A multiple without a period, or an IRR without a multiple, cannot be compared with anything.
The five inputs and how to check them
Start with the entry: amount invested and pre-money valuation give the post-money valuation and the investor's starting ownership (investment divided by post-money). Next, dilution: if the plan includes later rounds, each one reduces that ownership by the share it sells. Tstix's table does this correctly: Series A buys 30.0% and Series B later sells 15.0% of the company, so Series A ends at 30.0% × 85.0% = 25.5% (our calculation). Bridge Software reports ownership "(All Rounds)" of 11.5% for an investment that bought 14.3% at entry, which implies dilution without showing it.
Then the exit value. The honest version names a year and a basis: a multiple of revenue or earnings from the plan, or a range of acquisition prices. Tstix values the company at 5.0x EBITDA; Bridge Software's terminal firm value is about 9.8x its 2019 EBITDA (our calculation); Nomuri Hostel sells a property at an 11% capitalisation rate. The investor's proceeds are ownership at exit multiplied by exit value, less any debt, preference or selling cost. Finally, divide proceeds by investment for the multiple, and take the root for the number of years to get the IRR: IRR = multiple^(1/years) − 1. If the slide's IRR differs from this by more than rounding, either interim cash flows are included (and should be shown) or something is wrong.
Two tests catch most errors in seconds. First, does the return fit the company's own valuation on the same or neighbouring slide? If a deck sells 30% for $100,000 and projects a $1.5M valuation, 30% of $1.5M is $450,000, or 4.5x, whatever the headline says. Second, does the IRR fit the multiple and period? 2x in four years is about 18.9% a year compound; 10x in three years is about 115% a year. A figure far outside these ranges should be explained on the slide.
Return slides that rebuild
Tstix's page 16, "Return on Investment", is the most complete in the set. Series A: pre-money $14,455k, amount $6,195k, post-money $20,650k, dated 1 January 2011. Series B: pre-money $65,195k, amount $11,505k, post-money $76,700k, 1 January 2012. Equity results: Series A initial ownership 30.0%, final ownership 25.5%, IRR 56.8%, multiple 9.12x, terminal equity value at 5.0x EBITDA $221,580k, exit date 31 December 2015. Our checks: $6,195k / $20,650k is 30.0%; $11,505k / $76,700k is 15.0%, so Series A falls to 25.5%; 25.5% × $221,580k is about $56.5M, which is 9.12x $6,195k; 9.12x over five years is about 55.6% a year, within rounding of 56.8% given the exact dates. The one input not on this page is the 2015 EBITDA the exit rests on: $221,580k / 5.0 implies about $44.3M, which an investor would need to see justified in the forecast. The deck is dated September 2010, so every figure is a projection.
Bridge Software's page 10 shows three investment dates (15 September 2015, 15 March 2016, 15 January 2017) at pre-money valuations of $6M, $12M and $30M for $1M, $2M and $2M, with post-money ownership "(All Rounds)" of 11.5%, 13.4% and 6.3%, a 2019 EBITDA of $18,132,594, terminal firm equity value of $177,553,252, investor equity values of $20,382,389, $23,779,453 and $11,097,078, "Return on Investment" of 19.4X, 10.9X and 4.5X and IRRs of 102%, 92% and 78%. Our checks: $177,553,252 × 11.5% is about $20.4M, so the investor values reconcile; $20.38M / $1M is 20.4x, $23.78M / $2M is 11.9x and $11.10M / $2M is 5.5x, so the slide's "ROI" is profit divided by investment, one less than the multiple; from September 2015 to the end of 2019, 20.4x is about 102% a year. The model is consistent, but a reader who takes 19.4X as the multiple understates it, and a reader comparing it with another deck's multiple compares different things.
Nomuri Hostel's page 17 (PDF page 18), "Financials", is a property development. Equity €3,467,742 plus debt €3,347,378 for total sources of €6,815,120; uses €6,105,120; net cash flow €10,480,974; multiple on equity 3.02x; IRR 32.37% "calculated off of annual values"; sale on 31 December 2020 at an 11.00% terminal cap rate for €13,123,396 less 2.00% selling costs (€262,468) and the €1,802,506 outstanding mortgage, giving €11,058,422. Our checks: €10,480,974 / €3,467,742 is 3.02x; 2.00% of the sale price is €262,468; €13,123,396 less costs and mortgage is €11,058,422; and the sale price is about 11.0x the 2020 NOI of €1,312,340 grown by 10%. The return arithmetic holds. What does not reconcile is the funding table: sources exceed uses by €710,000, and the percentage column reads 51%, 49% and then "100%" against the total. The five-year NOI, occupancy and room rates below make the forecast inspectable.
Return slides whose figures disagree
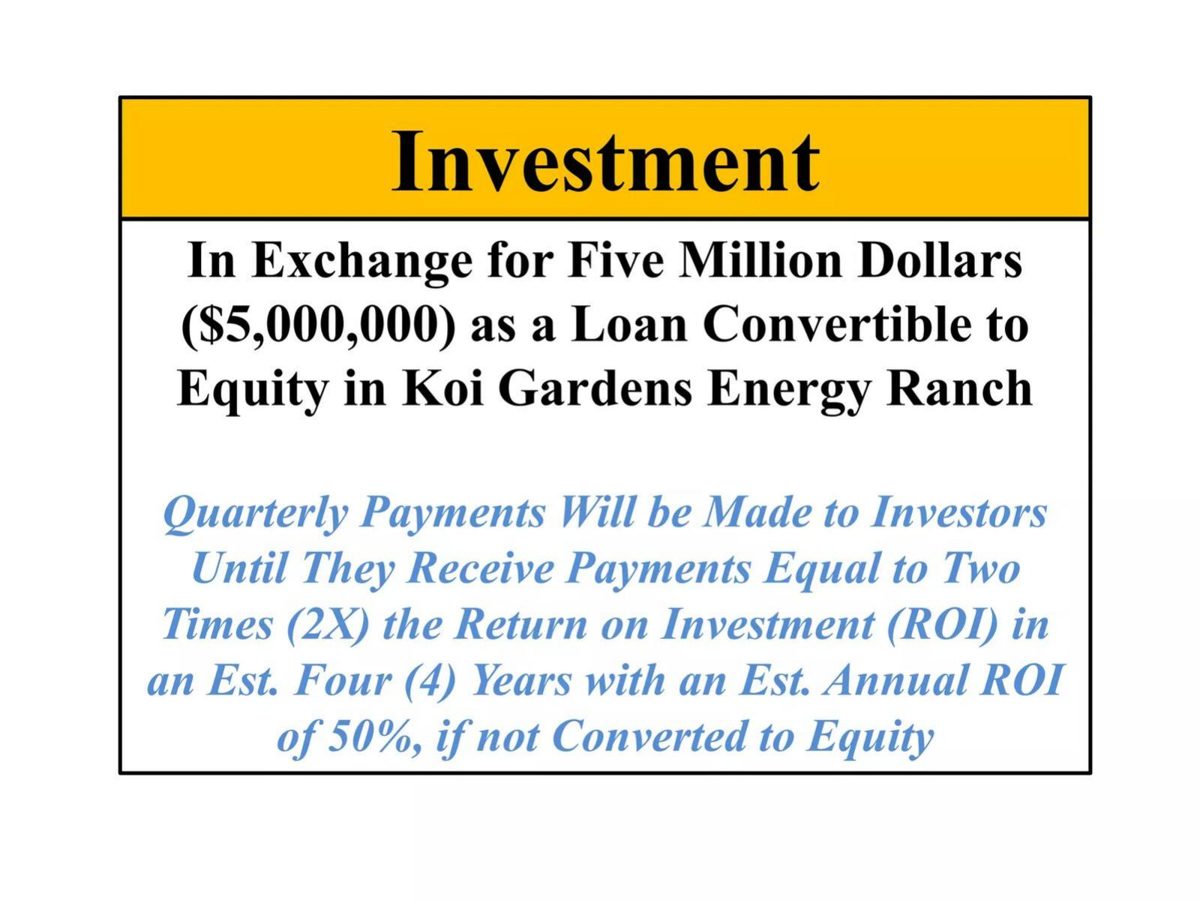
Koi Gardens Energy Ranch's page 20, "Investment", offers a $5,000,000 loan convertible to equity: "Quarterly Payments Will be Made to Investors Until They Receive Payments Equal to Two Times (2X) the Return on Investment (ROI) in an Est. Four (4) Years with an Est. Annual ROI of 50%, if not Converted to Equity". Receiving 2x over four years is a total profit of 100%, or 25% a year without compounding and about 18.9% compounded (our calculations). A 50% annual return for four years would be 200% simple or about 5.1x compounded. The two numbers describe different deals, and "two times the ROI" is itself ambiguous: two times the money, or two times some other return.
Choice n Cheers' page 14 lists "Series A Funding of $1,00,000", "Only Equity - Maximum up to 30%", "10x Return in 3 Years" and "Valuation around $15,00,000 (conservative) by 2019". Our calculation: 30% of $1,500,000 is $450,000, or 4.5x the $100,000 invested. To reach 10x the company would need to be worth about $3.3M with no dilution, more than twice the valuation on the same slide. The yearly projections on the page also disagree with each other: total revenue $8,00,000 less total expense $3,00,000 is $5,00,000, while EBITDA is shown as $4,00,000.
Mint.com's pre-launch page 16, "Exit Calculation", prices an exit from public comparables (PlanetOut, DealerTrack, Synchronoss) at their average EV/Sales of 3.3x and EV/EBIT of 9.4x, applies them to year-3 (2010) plan figures and averages the two methods: $25,914k and $52,414k give $39,164k, which we confirm. Assumptions: $3.0M investment, 15% stake, 5% hurdle rate. Cash flows: ($3,000), $49, $164, $6,259; "Reinvested IRR" 25%. Our checks: 15% of $39,164k is about $5,875k, not the $6,259k final cash flow; and the printed cash flows give an IRR of about 30%, or about 29% if the interim flows are reinvested at the 5% hurdle. We could not reproduce the 25%. The method is sound and transparent, which is exactly what lets a reader find the gap.
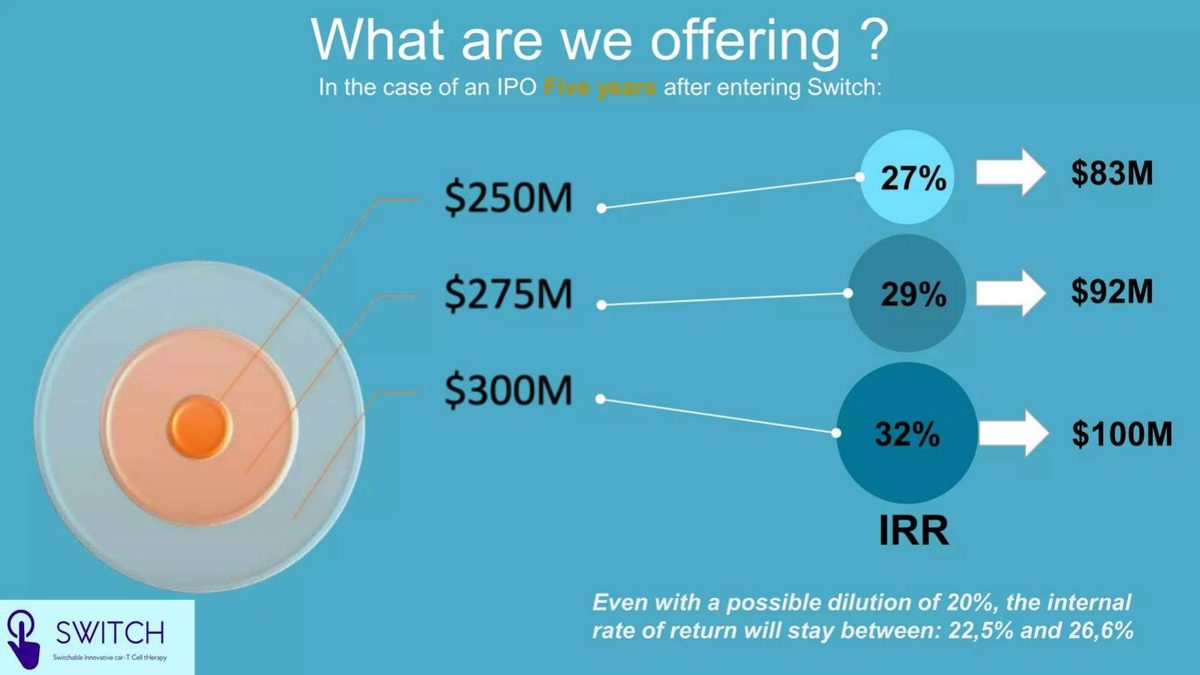
Switch's page 14, "What are we offering?", shows an IPO five years after entry at company values of $250M, $275M and $300M, investor proceeds of $83M, $92M and $100M, and IRRs of 27%, 29% and 32%, with the note "Even with a possible dilution of 20%, the internal rate of return will stay between: 22,5% and 26,6%". Our checks: each proceeds figure is about a third of the company value, so the slide assumes roughly 33% ownership; the IRRs imply an investment of about $25M in each case, a figure the slide never gives. Applying 20% dilution to a $25M entry gives about 21.6% to 26.2% (our calculation), close to the note. The ownership and the investment amount, the two numbers an investor most needs, are left to be inferred.
Multiples with no entry price
A-Savvy's page 8, "Start with the end in mind", lists acquisitions by Square, Intuit and a major bank (Mint $170 million, Check $360 million, GoodApril $20 million, Simple.com $117 million) and concludes "Exit in 3-5 years, $80-100 million, 10-20X ROI". The slide gives no valuation for the current round. Working backwards, 10x to 20x of an $80M to $100M exit implies an entry post-money of about $4M to $10M with no dilution at all (our calculation); any later round would push the required exit higher. The comparables are real transactions, but the return depends on the entry price the slide omits.
At Home Nursing Services' page 10, "Executive Summary", projects "$21 million of revenues and over $2 million of EBITDA in Year 2 of operations on $1 million investment" and states "Net investor returns are expected to be over 30x initial investment during five years period". Our calculation: 30x over five years is about 97% a year. Even if investors owned the whole company, $30M of value on $2M of EBITDA is a 15x earnings multiple for acquired home-care agencies, and the slide states no ownership, no exit basis and no later capital needs. It also describes a plan to buy agencies, which normally needs more capital than $1 million.
CodersTrust's page 13 is a different kind of return: a student-finance product for outside backers. It shows an expected portfolio return of "10% Investor IRR p.a" with "82.5% Students Repay": a $300 course fee, of which backers fund 75% ($225) and students pay 25% ($75) up front, and "$300 Repaid to Backer in 8 instalments" over about 15 months. Our checks: at 82.5% repayment the backer receives 82.5% × $300 = $247.50 on $225, a 10% total gain; spread over roughly 15 months that is nearer 8% a year before any losses on partial repayments, so the "p.a." label is slightly generous. Unlike the equity slides, every input is on the page, which is why the check is possible.
How to build a returns slide investors can use
Put the entry terms and the exit case in one table: amount, pre-money, post-money, starting ownership; each planned later round and the ownership after it; exit year and exit value with its basis (for example, "5.0x 2015 EBITDA of $44.3M"); proceeds; multiple; IRR. Tstix fits this in eight rows. If you prefer ranges, give low, base and high exit values, as Switch does, but keep the investment and ownership visible so the investor can check each row.
Define your terms once. Write "multiple (money back ÷ money in)" or "ROI (profit ÷ investment)", and use one of them throughout. Bridge Software's model is right but its label invites a misreading. State whether the IRR includes interim cash flows such as dividends or loan repayments, and if it does, print them.
Then check the slide against the rest of the deck. The exit EBITDA or revenue should be the figure in your financial plan for that year; the valuation should match the one on your ask slide; the ownership should match what you are selling. A return that contradicts your own ask, as Choice n Cheers' does, costs more credibility than leaving the slide out. If you have no defensible basis for an exit value, show comparable exits and let investors do their own arithmetic.
Common mistakes
No entry price. A multiple needs the valuation paid.
ROI vs multiple. Profit ÷ cost is one less than money back ÷ money in.
IRR off the multiple. Check multiple^(1/years) − 1.
Dilution ignored. Show each later round's effect on the stake.
Exit value unexplained. Name the multiple and the figure it applies to.
Contradicts own ask. Match the valuation on your ask slide.
Diagnostic checklist
Investment amount and post-money valuation are shown.
Ownership at entry and after planned rounds is shown.
Exit year and exit value basis are stated.
The measure is named: multiple, ROI or IRR.
The IRR matches the multiple over the stated period.
The return is consistent with the valuation on the ask slide.
Frequently asked questions
Should a pitch deck include projected investor returns?
It is optional. If you include it, show the inputs so investors can substitute their own exit value. Tstix's table is the model; A-Savvy's multiple with no entry price is what to avoid.
What is the difference between ROI, multiple and IRR?
A multiple is money back ÷ money in; ROI is usually profit ÷ cost, one less; IRR is the annual compound rate over the holding period. Bridge Software's "19.4X ROI" is a 20.4x multiple.
How do I check a return figure quickly?
Multiply exit value by the diluted stake, divide by the investment, then take the root for the number of years. Koi's 2x in four years comes to about 19% a year, not the 50% on its slide.
How should I value the company at exit?
Apply a stated multiple to a figure from your plan, or use named comparables. Tstix uses 5.0x EBITDA; Mint.com averages comparables' sales and earnings multiples.
Do I need to show dilution?
Yes, if your plan includes more rounds. Tstix shows Series A falling from 30.0% to 25.5% after Series B; Switch adds a 20% dilution case.
How we chose these examples
Search (2026-09-30): the durable corpus index (docs/seo/artifacts/corpus-search, 70,729 unique pages, deduplicated by deck-file sha256 + page) was searched for investor return, return to investors, IRR, MOIC, cash-on-cash, return multiple, "x ROI", "% ROI" and "x return". Mining feasibility studies, listed-company and SPAC presentations, fund and REIT decks, and slides about customers' ROI (covered by the customer results guide) were excluded.
Fourteen candidate pages were rendered from the original public deck files and read from the images; ten are used: Tstix 16, Bridge Software 10, Nomuri Hostel 18, Koi Gardens Energy Ranch 20, Choice n Cheers 14, Mint.com 16, Switch 14, A-Savvy 8, At Home Nursing Services 10 and CodersTrust 13.
Left out after reading: Switch 13 (the acquisition case repeats the lesson of page 14); Miel de Tierra 21 (already analysed in the comparable exits guide); LVenture Group 22 (a listed company's investor briefing); Onda 17 (a site-level cash-on-cash return, a unit economics question rather than an investor return).
Figures are as printed on each slide; we did not have the companies' underlying models, and all projections are the companies' own. How we built this: drafted and checked with AI assistance (editorial model review against the original slide images); no human editor has reviewed this guide.