Cap Table on a Pitch Deck: Does the Ownership Add Up?
How founders show a cap table on a pitch deck: who owns what before and after the round, option pools, fully diluted counts and the valuation the shares imply.
How to Show a Cap Table on Your Pitch Deck
Eleven cap table slides from real pitch decks. For each, we check whether the shares, percentages and prices agree with each other, what the table shows before and after the round, and what an investor still has to ask.
TL;DR
A cap table slide shows who owns the company: founders, investors, the employee option pool and anything that could become shares later, such as options, warrants and convertible notes. On a pitch deck it answers two questions an investor will ask anyway: how much of the company the founders still own, and what the new money buys. It earns trust when the share counts add to the stated total, the percentages match the share counts, the table shows the position before and after the round, and the price per share agrees with the valuation.
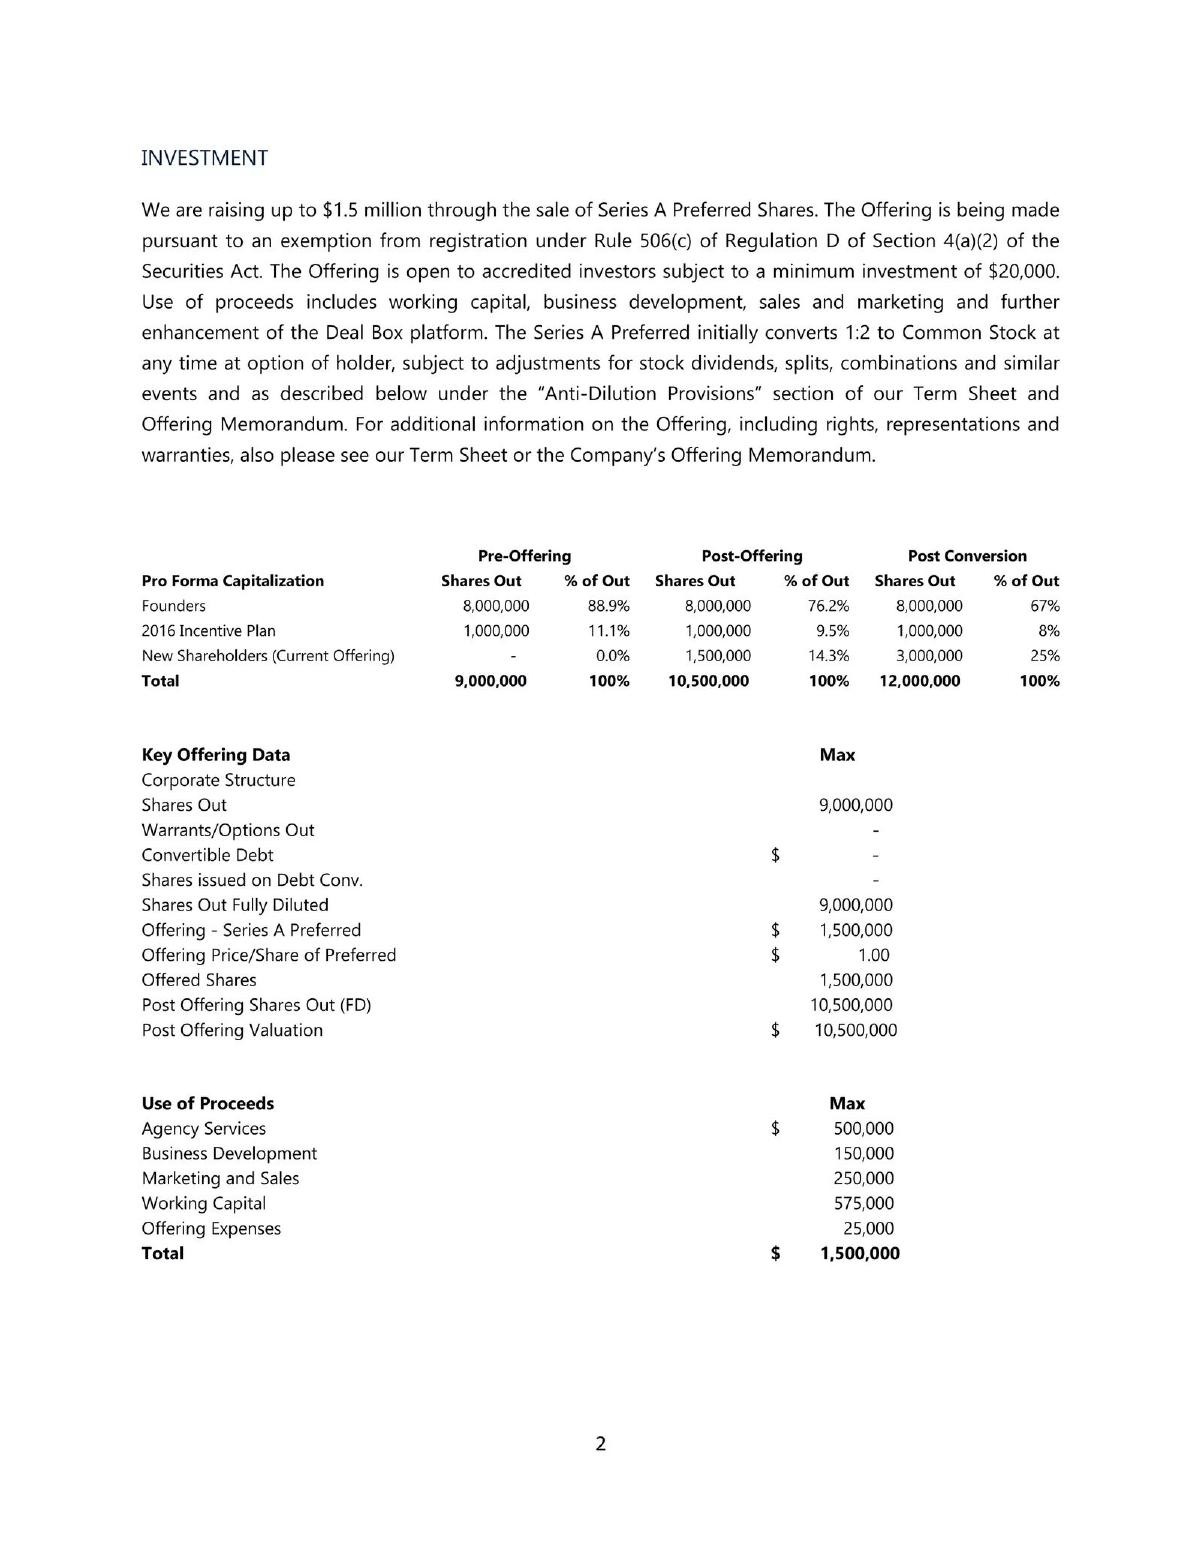
In this set, Deal Box shows the full sequence in one table: before the offering, after it, and after its preferred shares convert, with founders going from 88.9% to 76.2% to 67%. But its headline $10.5M post-offering valuation counts the preferred shares before they convert two-for-one; on a converted basis, $1.5M for 25% implies $6.0M (our calculation). BioSculpture's share rows add to 8,157,339, not the 8,032,339 it states (our calculation). FarmCloud labels a €4,688 option pool as 6.3% of a €100,000 company, which is 4.7% (our calculation).
Cap table slides from real pitch decks
Each example records what the slide says, what its own numbers show when checked, and what to copy or avoid. "Our calculation" marks arithmetic we did; the slides do not show it.
Deal Box ask slide — slide 3
Investment platform raising a Series A Preferred round under Regulation D. "Investment" page of an investment brief.
Deal Box deck, slide 3. Exact stored slide matched to this analysis.
Our analysis: A complete before, after and converted view whose headline valuation uses the unconverted count.
Evidence and limitation: Our calculation: every percentage matches its share count. On a converted basis investors pay $0.50 per common share, and $1.5M for 25% implies a $6.0M post-money value, not $10.5M.
What a founder can adapt: State the post-money valuation on the converted basis beside the $10.5M, and say whether the incentive plan is granted or unallocated.
Supporting analysis
What the deck claims: Raising up to $1.5M of Series A Preferred at $1.00; preferred "initially converts 1:2 to Common Stock". Pro forma capitalization: pre-offering founders 8,000,000 (88.9%), 2016 Incentive Plan 1,000,000 (11.1%); post-offering founders 76.2%, plan 9.5%, new shareholders 1,500,000 (14.3%), total 10,500,000; post conversion founders 67%, plan 8%, new shareholders 3,000,000 (25%), total 12,000,000. "Post Offering Valuation $10,500,000".
Presentation choice: The reader can see exactly what the round does to founders and the incentive plan at each stage.
When it does not fit: Don't quote a valuation from preferred shares that will convert at more than one-for-one without showing the converted figure.
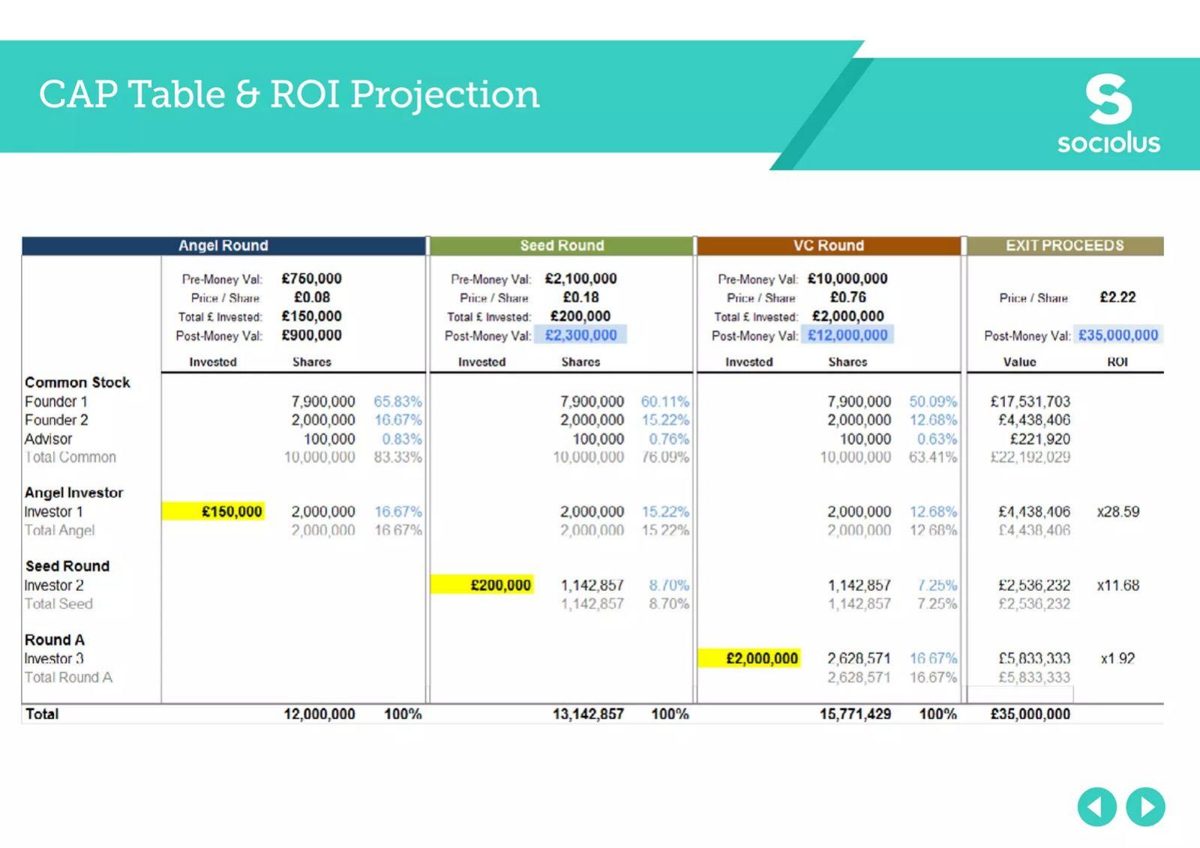
UK early-stage company. "CAP Table & ROI Projection" page modelling an angel, seed and VC round and an exit.
Sociolus deck, slide 13. Exact stored slide matched to this analysis.
Our analysis: A multi-round dilution model that reconciles, with an exit column that uses an unstated return measure.
Evidence and limitation: Our calculation: share counts reconcile at unrounded prices (£0.075, £0.175, £0.761). The ROI figures are gain on investment; as multiples of money invested they are 29.59, 12.68 and 2.92. No option pool appears at any stage.
What a founder can adapt: Add the option pool the VC round will likely require, and label the return column as gain or as multiple of money.
Supporting analysis
What the deck claims: Angel: pre-money £750,000, £0.08 a share, £150,000 invested, post-money £900,000. Seed: pre-money £2,100,000, £0.18, £200,000, post-money £2,300,000. VC: pre-money £10,000,000, £0.76, £2,000,000, post-money £12,000,000. Founder 1 65.83% → 60.11% → 50.09%. Exit £35,000,000 at £2.22 a share; ROI x28.59 (angel), x11.68 (seed), x1.92 (Round A).
Presentation choice: It shows founders and investors how each round changes ownership, with every share count traceable.
When it does not fit: Don't present an assumed exit value and an unlabelled return measure as a result.
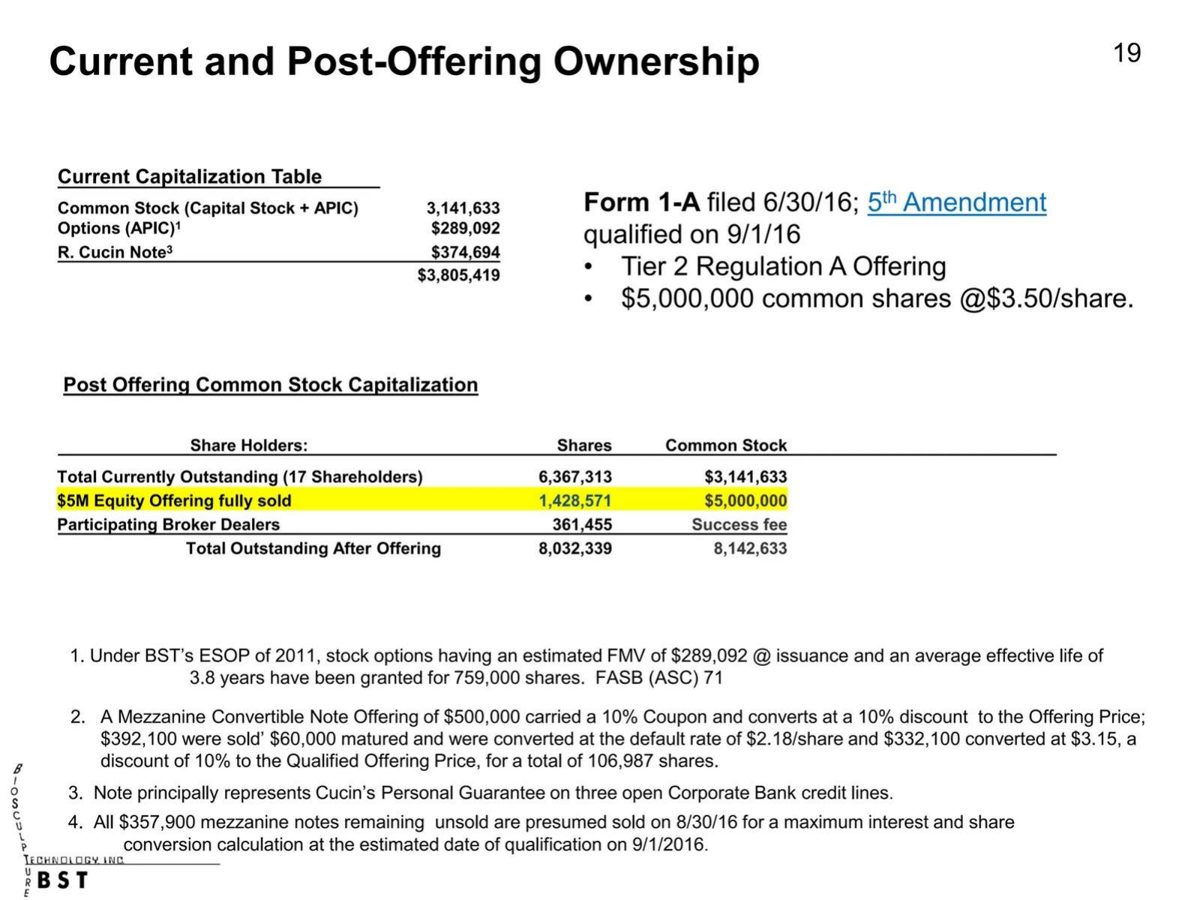
Medical technology company in a Tier 2 Regulation A offering. "Current and Post-Offering Ownership" page.
BioSculpture Technology deck, slide 19. Exact stored slide matched to this analysis.
Our analysis: A post-offering table whose total does not match its rows, with granted options outside the count.
Evidence and limitation: Our calculation: the share rows add to 8,157,339, 125,000 more than stated; the dollar rows add to $8,141,633. New investors hold 17.5% or 17.8% depending on the total; with the options, about 16%.
What a founder can adapt: Re-add the columns, include granted options in a fully diluted line, and show the shares created by the note conversions.
Supporting analysis
What the deck claims: $5,000,000 of common shares at $3.50. Currently outstanding (17 shareholders) 6,367,313 shares ($3,141,633); offering 1,428,571 ($5,000,000); broker dealers 361,455 (success fee); total after offering 8,032,339 ($8,142,633). Footnote: 759,000 options granted under the 2011 ESOP.
Presentation choice: It shows the offering, the broker fee in shares and the existing holders on one page.
When it does not fit: Don't leave options in a footnote when they change the new investors' percentage.
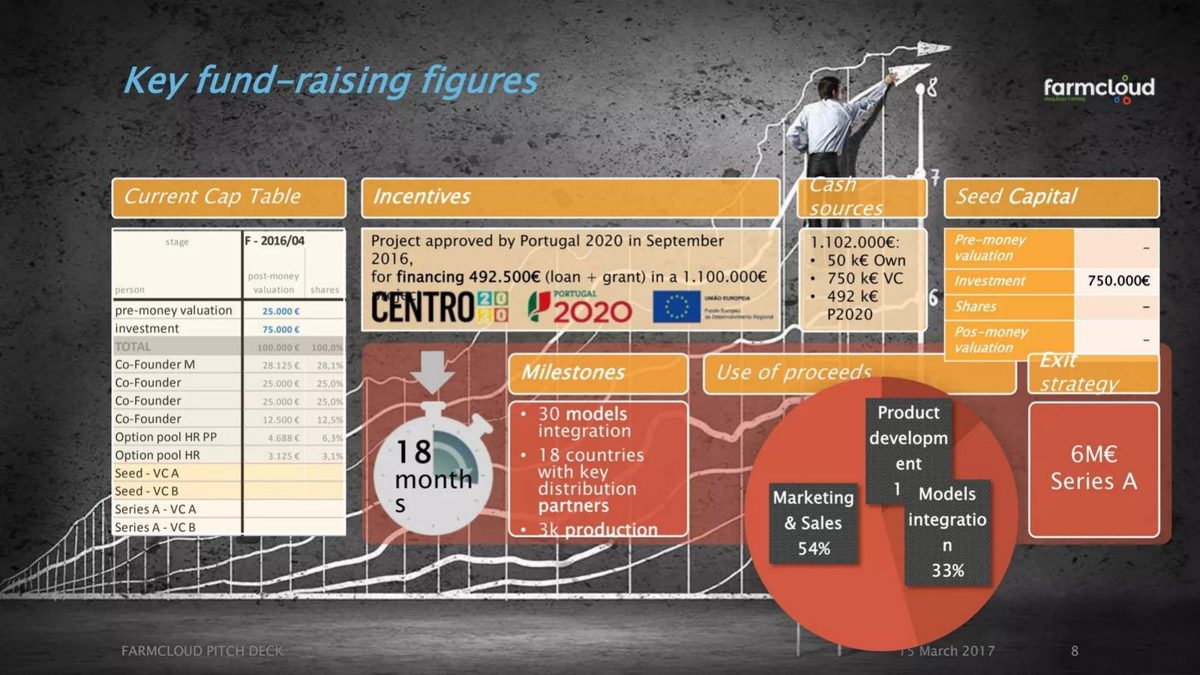
Portuguese agriculture software company. "Key fund-raising figures" page with a small current cap table, March 2017 deck.
FarmCloud deck, slide 8. Exact stored slide matched to this analysis.
Our analysis: A cap table whose euro values and percentages disagree, with no row for the stated investment.
Evidence and limitation: Our calculation: the euro rows add to €98,438, not €100,000; €4,688 is 4.7% of €100,000, not 6.3%; a 6.25% pool (€6,250) would close the gap. No row shows who made the €75,000 investment.
What a founder can adapt: Correct the pool figure, add a row for the €75,000 investor, and show the table after the €750,000 seed.
Supporting analysis
What the deck claims: Current Cap Table (F - 2016/04): pre-money valuation 25.000 €, investment 75.000 €, total 100.000 € (100,0%). Co-Founder M 28.125 € (28,1%); co-founders 25.000 € (25,0%), 25.000 € (25,0%) and 12.500 € (12,5%); Option pool HR PP 4.688 € (6,3%); Option pool HR 3.125 € (3,1%). Seed capital investment 750.000 €; exit strategy "6M€ Series A".
Presentation choice: It separates two option pools from founder holdings, which many early tables do not.
When it does not fit: Don't show percentages that add to 100% beside values that do not.
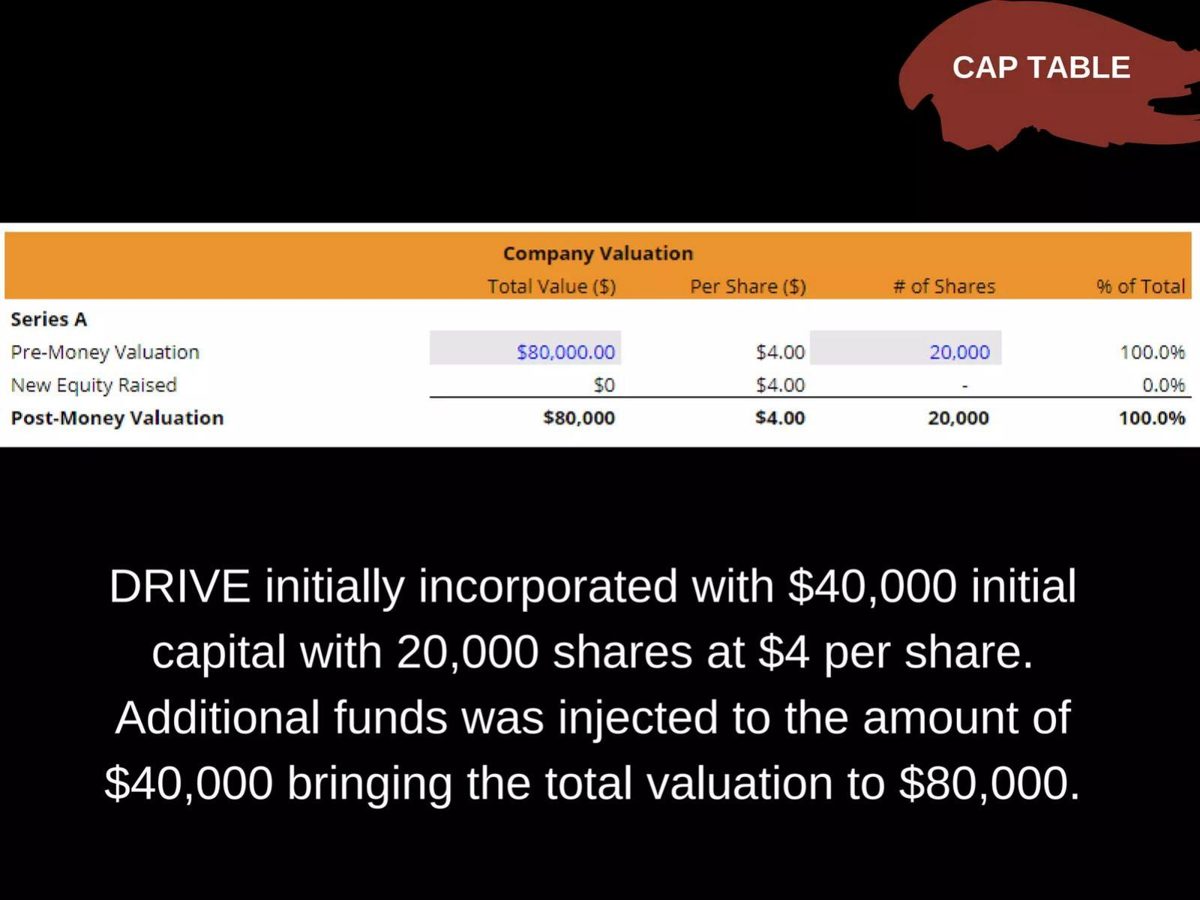
Early-stage company. "CAP TABLE" page of a June deck.
DRIVE deck, slide 11. Exact stored slide matched to this analysis.
Our analysis: A cap table that confuses capital contributed with valuation and states figures that do not match.
Evidence and limitation: Our calculation: 20,000 shares at $4 is $80,000, not $40,000. The text treats capital put in as setting the valuation.
What a founder can adapt: Show capital paid in, shares issued and the proposed round's price and valuation as separate lines.
Supporting analysis
What the deck claims: Series A: pre-money valuation $80,000.00, $4.00 a share, 20,000 shares (100.0%); new equity raised $0; post-money $80,000. "DRIVE initially incorporated with $40,000 initial capital with 20,000 shares at $4 per share. Additional funds was injected to the amount of $40,000 bringing the total valuation to $80,000."
Presentation choice: It is a clear example of why share count, price and capital paid should be shown separately.
When it does not fit: Don't label a table "Series A" when no new equity is shown.
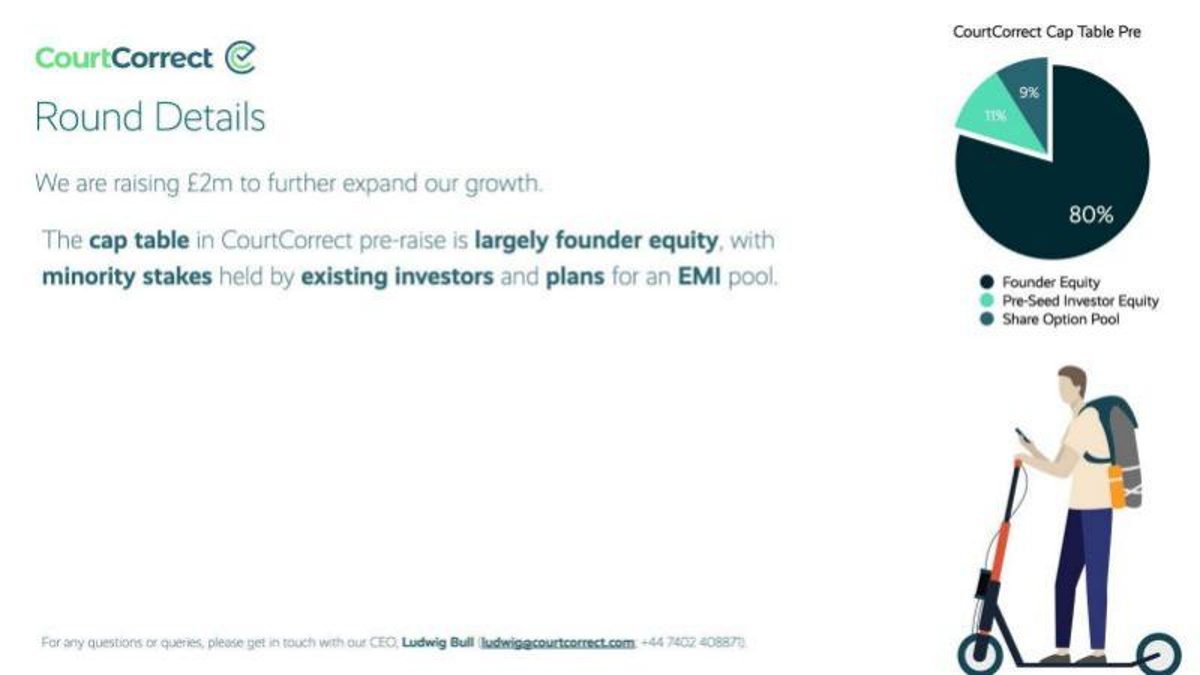
UK legal technology company. "Round Details" page.
CourtCorrect deck, slide 10. Exact stored slide matched to this analysis.
Our analysis: A clean pre-round summary with no picture of the round's effect.
Evidence and limitation: The slide gives no valuation or post-round view; the pie shows a 9% pool while the text describes the pool as planned.
What a founder can adapt: Add the pre-money valuation and a post-round pie, and say whether the 9% pool is created or proposed.
Supporting analysis
What the deck claims: "We are raising £2m to further expand our growth." "The cap table in CourtCorrect pre-raise is largely founder equity, with minority stakes held by existing investors and plans for an EMI pool." Pie "CourtCorrect Cap Table Pre": founder equity 80%, pre-seed investor equity 11%, share option pool 9%.
Presentation choice: In one glance it shows founders hold most of the company before the raise.
When it does not fit: Don't show a planned pool as if it already exists.
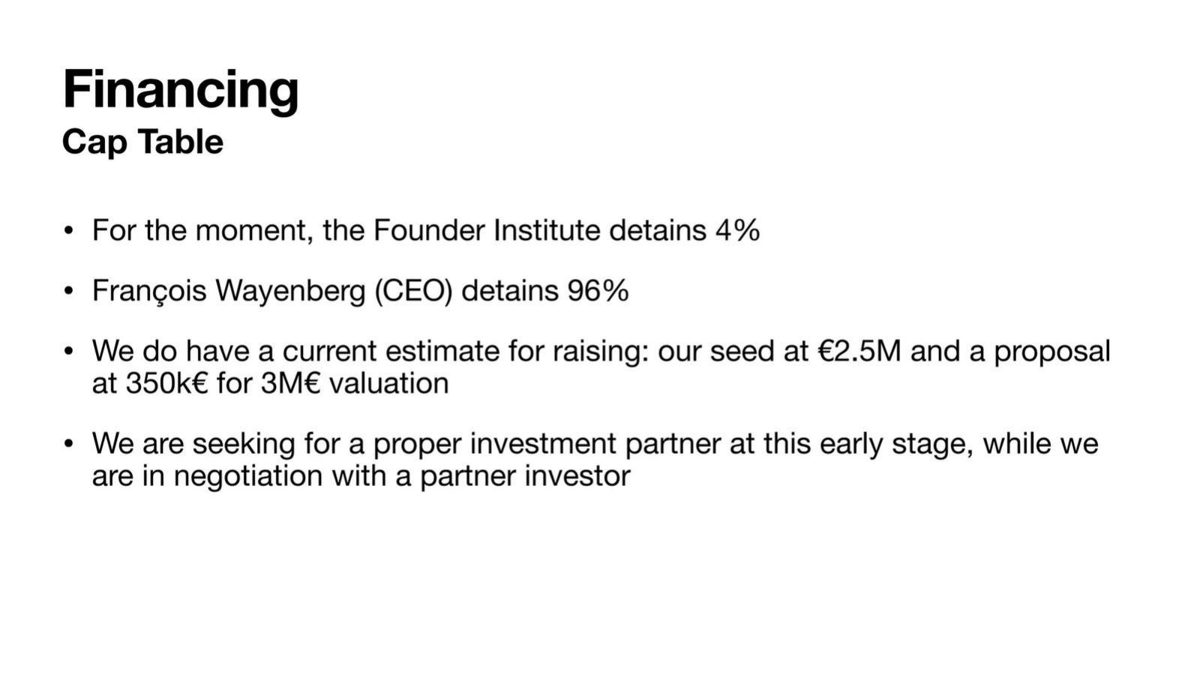
Food-tech (taste and smell data) company. "Financing" and "Cap Table" page, January 2021 deck.
Ajinomatrix deck, slide 40. Exact stored slide matched to this analysis.
Our analysis: A two-holder cap table with a proposed price but no pre- or post-money label.
Evidence and limitation: Our calculation: €350,000 buys 11.7% at a €3M post-money or 10.4% at a €3M pre-money; the CEO would hold about 85% or 86% afterwards.
What a founder can adapt: Say whether €3M is pre- or post-money and how the €350,000 relates to the €2.5M seed.
Supporting analysis
What the deck claims: "For the moment, the Founder Institute detains 4%"; "François Wayenberg (CEO) detains 96%"; "our seed at €2.5M and a proposal at 350k€ for 3M€ valuation"; "in negotiation with a partner investor".
Presentation choice: It states ownership plainly and names the only outside holder.
When it does not fit: Don't give a valuation without saying whether it includes the new money.
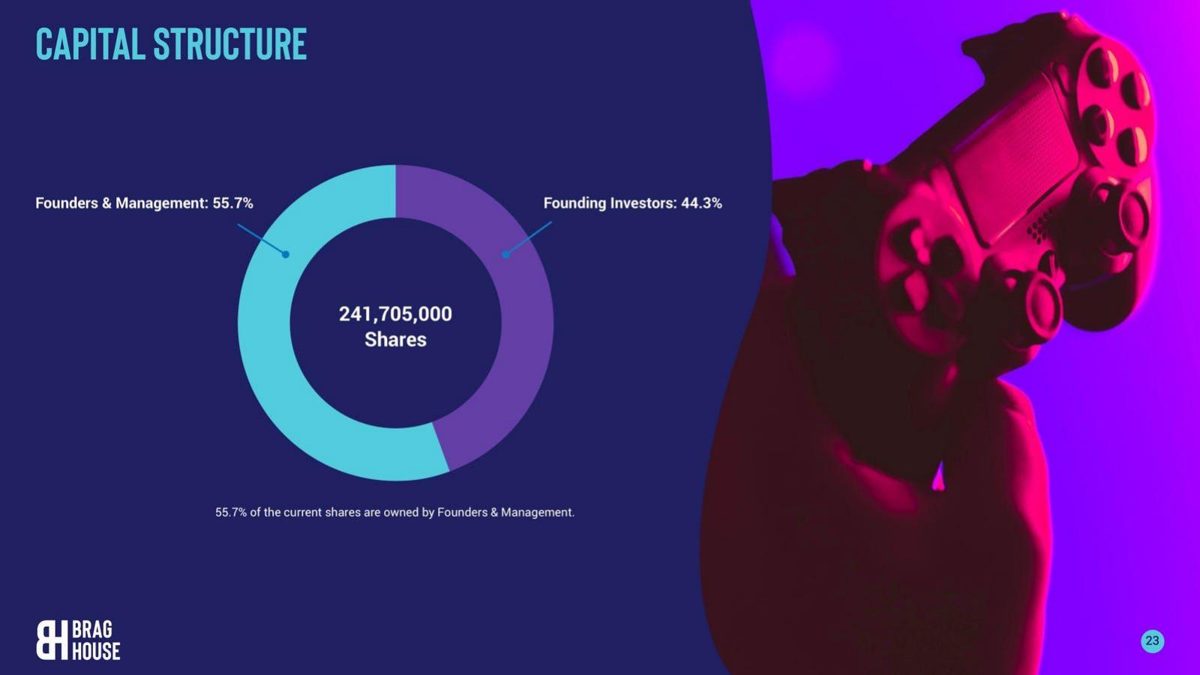
Gaming and esports social platform. "CAPITAL STRUCTURE" page.
Brag House deck, slide 23. Exact stored slide matched to this analysis.
Our analysis: A two-group summary that leaves open whether other instruments exist.
Evidence and limitation: Our calculation: 55.7% of 241,705,000 is about 134.6 million shares. The slide gives no date, option pool, convertibles or post-round view.
What a founder can adapt: Date the chart, add options and convertibles (or state there are none) and show the effect of the round.
Supporting analysis
What the deck claims: Donut chart: "Founders & Management: 55.7%", "Founding Investors: 44.3%", "241,705,000 Shares"; "55.7% of the current shares are owned by Founders & Management."
Presentation choice: It gives a share count, so the percentages can be turned into shares.
When it does not fit: Don't leave the reader guessing whether a missing category is zero or omitted.
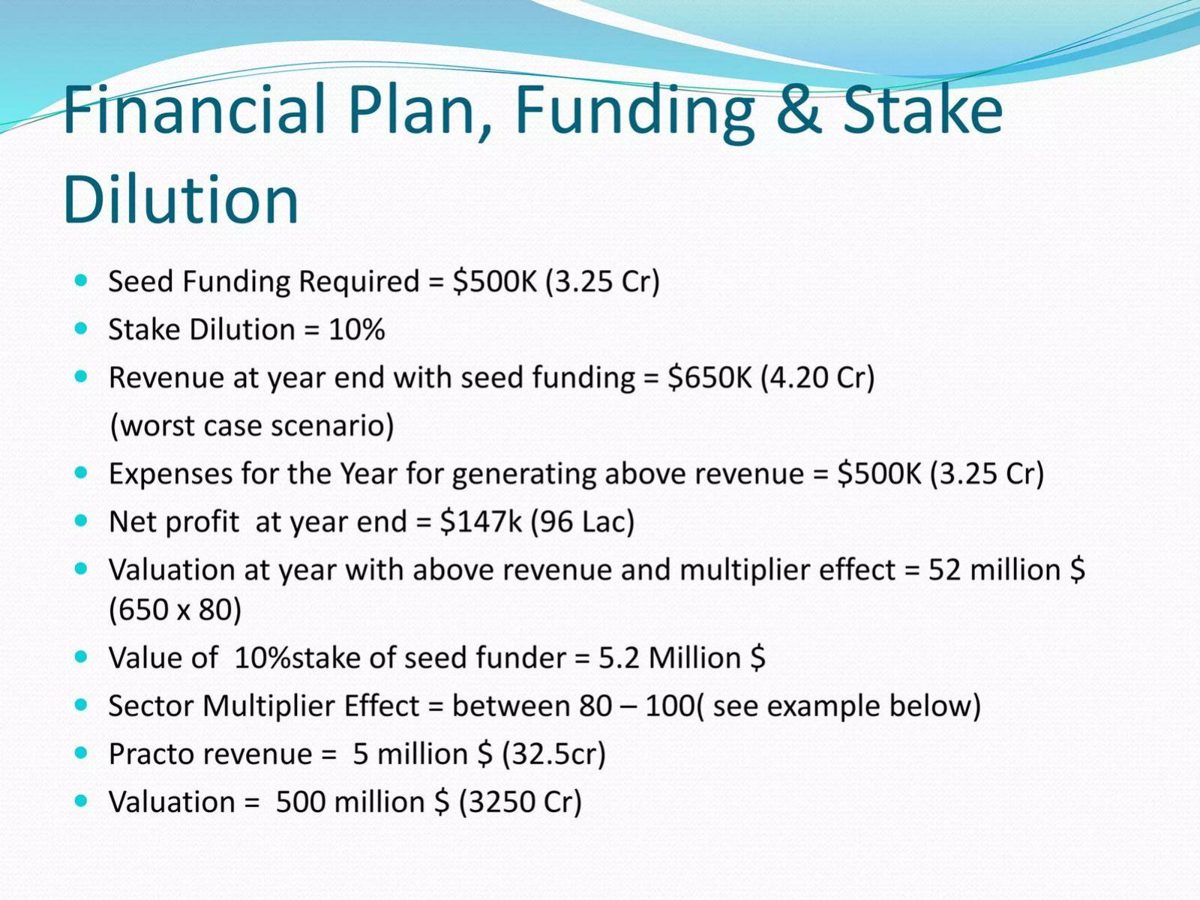
Call The deck, slide 10. Exact stored slide matched to this analysis.
Our analysis: A dilution line turned into an exit payout on one comparison and a fixed percentage.
Evidence and limitation: Our calculation: $500K for 10% implies a $5M post-money valuation, not stated; revenue less expenses is $150K, not $147k. The 10% is held constant with no later dilution.
What a founder can adapt: State the post-money valuation, and show the seed stake after at least one later round.
Supporting analysis
What the deck claims: "Seed Funding Required = $500K (3.25 Cr)"; "Stake Dilution = 10%"; revenue $650K and expenses $500K in year one; "Net profit at year end = $147k"; "Valuation ... = 52 million $ (650 x 80)"; "Value of 10%stake of seed funder = 5.2 Million $"; sector multiplier 80 to 100, citing Practo at $5M revenue and $500M valuation.
Presentation choice: It states the dilution plainly, which lets the reader derive the valuation.
When it does not fit: Don't value an early stake at an exit price as if no further rounds will dilute it.
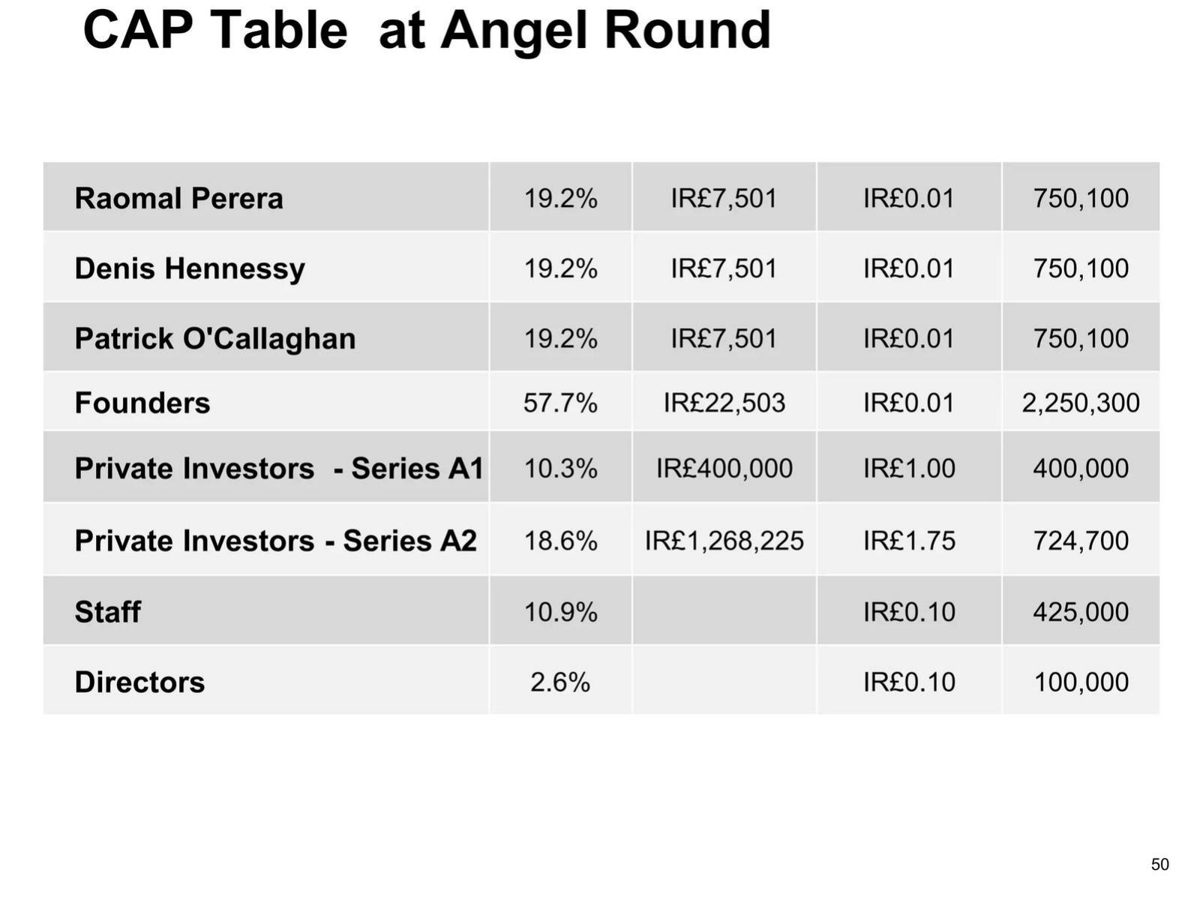
Worked example in University College Cork's "Effective Fund Raising" programme deck; the company is unnamed.
UCC Ignite (teaching example) deck, slide 50. Exact stored slide matched to this analysis.
Our analysis: A format reference in which every figure can be checked against the others.
Evidence and limitation: Our calculation: 3,900,000 shares in total; each percentage matches; percentages add to 100.1% from rounding; 724,700 at IR£1.75 is IR£1,268,225. At IR£1.75 the company is valued at about IR£6.8M.
What a founder can adapt: Mark which staff and director shares are options and whether they are vested.
Supporting analysis
What the deck claims: "CAP Table at Angel Round": three founders 750,100 shares each (19.2%) at IR£0.01; founders 2,250,300 (57.7%); Series A1 400,000 (10.3%) at IR£1.00 for IR£400,000; Series A2 724,700 (18.6%) at IR£1.75 for IR£1,268,225; staff 425,000 (10.9%) and directors 100,000 (2.6%) at IR£0.10.
Presentation choice: Shares, price, amount paid and percentage on each row make errors easy to catch.
When it does not fit: Don't treat a teaching example as evidence of market practice.
Each cell reports only what the slide itself states, except the last column, which records our arithmetic check.
Example
Before round?
After round?
Option pool
Convertibles counted?
Price or valuation
Rows reconcile?
Deal Box
Yes
Yes, and converted
1,000,000 plan
Not applicable
$1.00; $10.5M
Yes; valuation basis differs
Sociolus
Yes
Three rounds
None shown
Not applicable
Each round
Yes, at unrounded prices
HydRx
Yes
No round shown
2,948,925 options
Yes, all
Footnoted
Yes
BioSculpture
Yes
Yes
Footnote only
Partly
$3.50
No (125,000 shares)
FarmCloud
Yes
No
Two pools
Not stated
€25,000 pre-money
No (€1,562)
DRIVE
Yes
No new equity
None shown
Not stated
$4.00; $80,000
Text disagrees
CourtCorrect
Yes
No
9% (planned?)
Not stated
Not stated
Percentages only
Ajinomatrix
Yes
No
None shown
Not stated
€3M, basis unstated
Percentages only
Brag House
Yes
No
None shown
Not stated
Not stated
Percentages only
Call The
No
10% only
None shown
Not stated
Implied $5M
Profit off by $3K
UCC Ignite
Yes
At round
Staff 10.9%
Not stated
IR£1.00 and IR£1.75
Yes
Key Takeaways
Make the rows add up. BioSculpture's share rows are 125,000 shares more than its stated total, and FarmCloud's euro rows are €1,562 short of its €100,000 total (both our calculations).
Show before and after the round. Deal Box and Sociolus show each stage; CourtCorrect shows only "Cap Table Pre" beside a £2m raise.
Say which basis the valuation uses. Deal Box's $10.5M counts preferred shares before conversion; after conversion, the same terms imply $6.0M (our calculation).
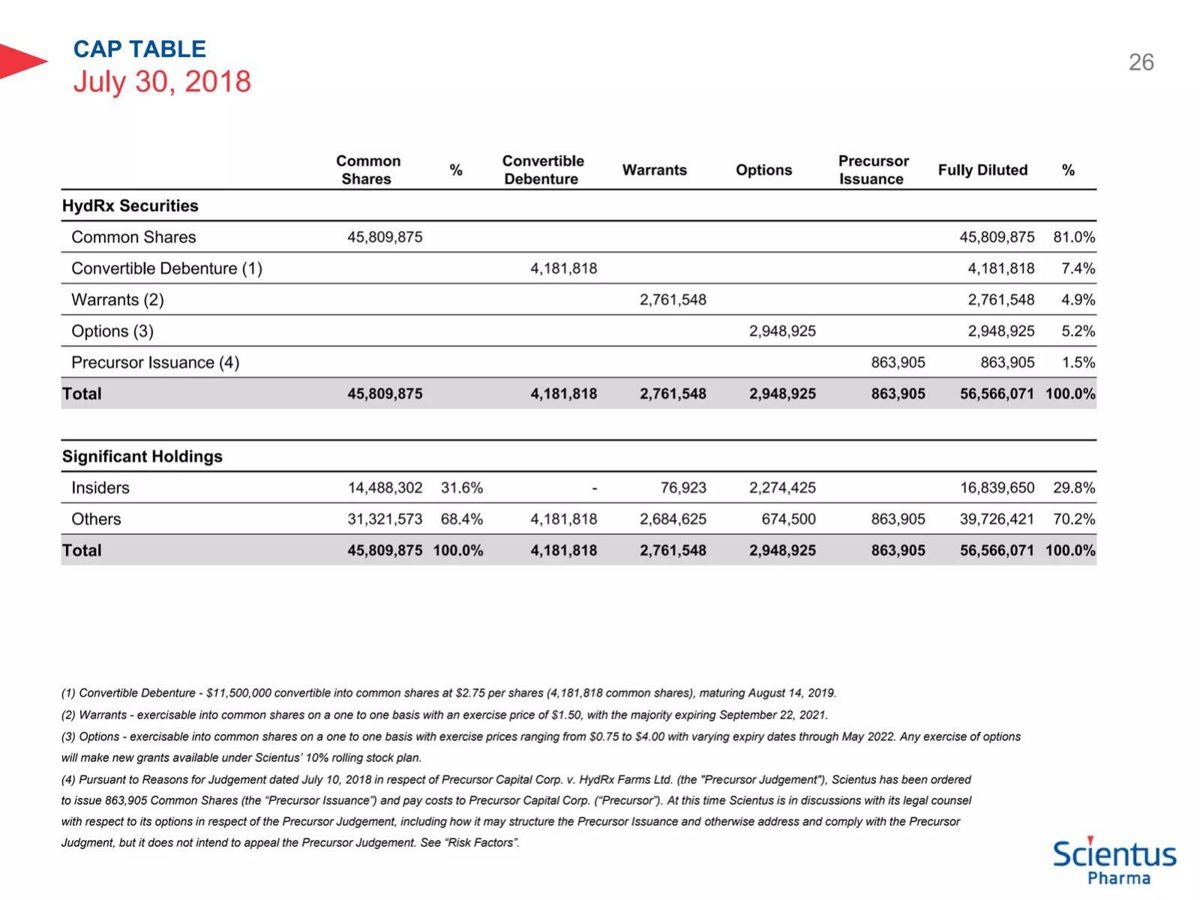
Count everything that can become shares. HydRx lists convertible debentures, warrants, options and a court-ordered issuance, and shows insiders falling from 31.6% of common shares to 29.8% fully diluted.
Name the option pool and say whether it is allocated. CourtCorrect's pie shows a 9% pool while the text says it "plans" an EMI pool.
Don't turn one round's percentage into an exit payout. Call The values a 10% seed stake at $5.2M without allowing for later rounds.
Build your cap table slide
Fill in each line from your share register. Leave a field blank rather than estimate, and label anything that is an estimate.
Holders. Founders, employees, each investor round, advisors: shares and percentage today?
Option pool. Total pool, granted, and unallocated? Any increase required by the round?
Convertibles. SAFEs, notes, warrants: estimated shares at this round's price?
The round. Amount, price per share, pre-money and post-money, on the converted basis?
After the round. Each group's percentage after the new money and any pool increase?
Checks. Do rows add up, percentages match shares, and price times shares equal post-money?
Copyable framework: As of [date]: founders [x]%, investors [y]%, pool [z]% ([granted]/[unallocated]), convertibles [n] shares est. This round: [amount] at [price] ([pre-money] pre, [post-money] post, converted basis). After the round: founders [x2]%, new investors [w]%, pool [z2]%.
Illustrative example 1 — written by us
Before: Founders own the majority; small investor stakes; ESOP planned.
After: As of June: founders 78% (7,800,000 shares), pre-seed 12%, option pool 10% (4% granted, 6% unallocated); one SAFE est. 300,000 shares. This round: £1.5M at £1.00 (£6.0M pre, £7.5M post). After: founders 60%, new investors 20%, pool 10% after a top-up.
What improved: Placeholder figures showing the format: dated holdings, a split pool, converted SAFEs and a post-round line make the table checkable.
What a cap table slide is for
A capitalization table lists every holder of shares, or of rights that can become shares, with the number each holds and the percentage of the total. Early on it may have three lines: the founders. By a Series A it usually includes angel and seed investors, an employee option pool, sometimes advisors, and convertible instruments such as SAFEs or notes that have not yet turned into shares.
Most investors will ask for the full table in the data room. The slide version does a narrower job. It shows that the founders still own enough of the company to stay motivated through later rounds, that there are no surprises such as a large dormant shareholder or an unallocated block, and what the proposed round does to everyone's percentage. A founder who shows this voluntarily saves a round of questions and signals that the numbers have been checked.
Because a cap table is arithmetic, it is also easy to check. Every example below can be tested with a calculator: add the rows, divide each by the total, multiply shares by price. Four of the eleven slides fail at least one of these tests. None of the errors is large enough to change the story on its own, but each gives an investor a reason to recheck everything else.
Test one: do the rows add to the total?
BioSculpture Technology's page 19, "Current and Post-Offering Ownership", has a table headed "Post Offering Common Stock Capitalization". It lists "Total Currently Outstanding (17 Shareholders)" 6,367,313 shares, "$5M Equity Offering fully sold" 1,428,571 shares, and "Participating Broker Dealers" 361,455 shares, with "Total Outstanding After Offering" of 8,032,339. Our calculation: the three rows add to 8,157,339, which is 125,000 more than the stated total. The dollar column has a smaller slip: $3,141,633 plus $5,000,000 is $8,141,633, while the slide shows $8,142,633. The offering row itself checks out: $5,000,000 at $3.50 a share is 1,428,571 shares.
The same page shows why a total matters beyond tidiness. The new investors' share of the company is 17.5% if the total is 8,157,339, or 17.8% if it is 8,032,339 (both our calculations). Footnote 1 also says 759,000 stock options have been granted under the company's 2011 plan, and they do not appear in the share table. Counting them would bring the total to about 8.9 million shares and cut the new investors' stake to about 16% (our calculation, assuming all options are exercised).
FarmCloud's page 8, "Key fund-raising figures", has a small "Current Cap Table" dated "F - 2016/04". It shows a pre-money valuation of 25.000 €, an investment of 75.000 € and a total of 100.000 €, then six holders with a euro value and a percentage: Co-Founder M 28.125 € (28,1%), two co-founders at 25.000 € (25,0%), a co-founder at 12.500 € (12,5%), "Option pool HR PP" 4.688 € (6,3%) and "Option pool HR" 3.125 € (3,1%). Our calculation: the euro values add to €98,438, not €100,000, and €4,688 is 4.7% of €100,000, not 6.3%. A 6.25% pool would be €6,250, which would close the €1,562 gap exactly. The most likely explanation is that one cell was not updated, but the slide does not say which figure is right.
The practical rule is to add every column before the slide goes out, including the percentages. Percentages that add to 100.1% because of rounding are fine; the UCC Ignite example below does exactly that. A share column that is off by a round number such as 125,000 usually means a row was edited and the total was not.
Test two: does the price match the valuation?
Sociolus's page 13, "CAP Table & ROI Projection", models three rounds and an exit. The angel round shows "Pre-Money Val: £750,000", "Price / Share £0.08", "Total £ Invested: £150,000" and "Post-Money Val: £900,000", with the angel receiving 2,000,000 shares. Our calculation: £750,000 across the 10,000,000 existing shares is £0.075 a share, and £150,000 buys exactly 2,000,000 shares at that price, so the displayed £0.08 is a rounding of £0.075. The seed and VC rounds reconcile to the share: £200,000 at £2,100,000 pre-money on 12,000,000 shares buys 1,142,857 shares, and £2,000,000 at £10,000,000 pre-money on 13,142,857 shares buys 2,628,571 shares, both matching the table (our calculations).
Deal Box's page 3, "Investment", has the more interesting mismatch. It is raising "up to $1.5 million through the sale of Series A Preferred Shares" at $1.00 a share, and its "Key Offering Data" gives "Post Offering Valuation $10,500,000" on 10,500,000 shares. But the text says "The Series A Preferred initially converts 1:2 to Common Stock", and the table's "Post Conversion" column shows the 1,500,000 preferred shares becoming 3,000,000 common shares, 25% of 12,000,000. Our calculation: once converted, investors pay $0.50 for each common share, and $1.5M for 25% implies a post-money value of $6.0M, not $10.5M. Both figures come from the slide's own numbers; they measure different things. An investor will use the converted figure, so the slide should show it.
DRIVE's page 11, "CAP TABLE", shows a pre-money valuation of $80,000.00 at $4.00 a share on 20,000 shares, "New Equity Raised" of $0, and a post-money valuation of $80,000. The text says "DRIVE initially incorporated with $40,000 initial capital with 20,000 shares at $4 per share. Additional funds was injected to the amount of $40,000 bringing the total valuation to $80,000." Our calculation: 20,000 shares at $4 is $80,000, not $40,000, so the incorporation figures do not match each other. The text also treats money put into the company as if it set the valuation. Capital paid in and valuation are different numbers; the table would be clearer if it showed the capital contributed and the valuation separately.
Test three: does it show before and after the round?
A cap table that shows only today's ownership leaves the investor to work out what the round does. Deal Box shows three columns: before the offering (founders 8,000,000 shares, 88.9%; "2016 Incentive Plan" 1,000,000, 11.1%), after it (founders 76.2%, plan 9.5%, new shareholders 14.3%) and after conversion (founders 67%, plan 8%, new shareholders 25%). Our calculation: every percentage matches its share count to the rounding shown. This is the clearest example in the set of what a round does to each holder.
Sociolus goes further and shows three rounds in sequence. Founder 1 falls from 65.83% after the angel round to 60.11% after seed and 50.09% after the VC round. The table has no option pool at any stage, which is unusual for a company planning a £2,000,000 VC round; most VC term sheets require one, and it is usually created before the new money comes in, so it dilutes the existing holders. Adding a pool of, say, 10% would put Founder 1 below 50% after the VC round (our calculation, illustrative only).
CourtCorrect's page 10, "Round Details", says "We are raising £2m to further expand our growth" and shows a pie titled "CourtCorrect Cap Table Pre": founder equity 80%, pre-seed investor equity 11% and share option pool 9%. The text says the cap table "is largely founder equity, with minority stakes held by existing investors and plans for an EMI pool." The pie shows the position before the round only; the slide gives no valuation, so the reader cannot tell what the £2m will cost. It also shows a 9% pool while the text describes the pool as a plan, so it is not clear whether the pool exists or is shown as it is intended to be.
Ajinomatrix's page 40, "Financing" and "Cap Table", says "the Founder Institute detains 4%" and "François Wayenberg (CEO) detains 96%", then "our seed at €2.5M and a proposal at 350k€ for 3M€ valuation". Our calculation: €350,000 buys 11.7% if €3M is the post-money valuation, or 10.4% if it is the pre-money valuation. The slide does not say which, nor how the €2.5M seed relates to the €350,000 proposal. The CEO's 96% would fall to about 85% or 86% after the €350,000 (our calculation).
Test four: is everything that can become shares counted?
HydRx Farms (Scientus Pharma), page 26, "CAP TABLE July 30, 2018", is the most complete table in the set. It lists 45,809,875 common shares, a convertible debenture that would become 4,181,818 shares, 2,761,548 warrants, 2,948,925 options and a "Precursor Issuance" of 863,905 shares, for 56,566,071 fully diluted. Our calculation: the rows add exactly, and footnote 1 checks out, since an $11,500,000 debenture convertible at $2.75 a share gives 4,181,818 shares. A second table splits holdings between insiders and others: insiders own 31.6% of the common shares but 29.8% fully diluted. That drop is the whole point of a fully diluted view, and the slide shows it without comment.
The footnotes also explain each line: warrants exercisable at $1.50, options at $0.75 to $4.00, and the Precursor Issuance ordered by a court judgment. A fully diluted count of this kind treats every warrant and option as exercised whatever its price, which overstates dilution if some are far above the share price. That is the standard convention on a cap table; it is worth saying so on the slide.
BioSculpture shows what happens when something is left out: its 759,000 granted options appear only in a footnote, and its convertible note history (footnote 2) says notes converted at $2.18 and $3.15 a share. The share table does not show how many shares those conversions created. Brag House's page 23, "CAPITAL STRUCTURE", shows only two groups, "Founders & Management: 55.7%" and "Founding Investors: 44.3%", of 241,705,000 shares. It gives no date, no option pool and no mention of convertibles, so the reader cannot tell whether there are none or whether they are simply not shown.
Test five: does it avoid turning a percentage into a payout?
Call The's page 10, "Financial Plan, Funding & Stake Dilution", says "Seed Funding Required = $500K (3.25 Cr)" and "Stake Dilution = 10%". Our calculation: that implies a $5M post-money valuation, which the slide does not state. It then says "Valuation at year with above revenue and multiplier effect = 52 million $ (650 x 80)" and "Value of 10%stake of seed funder = 5.2 Million $". The 80-times revenue multiple is justified by one comparison, Practo at "5 million $" revenue and a "500 million $" valuation. The 10% stake is held constant, as if no later round would dilute it. Revenue of $650K less expenses of $500K is $150K (our calculation), while the slide gives net profit of $147k, with no explanation of the $3K difference.
Sociolus's exit column does something similar but more carefully. It assumes an exit at £35,000,000, gives each holder's value at £2.22 a share, and shows the angel's return as "x28.59", the seed investor's as "x11.68" and Round A's as "x1.92". Our calculation: £4,438,406 on £150,000 is 29.59 times the money invested, so "x28.59" is the gain on top of the original investment, not the multiple of money returned. The same is true of the other two (12.68 and 2.92 times invested). The slide does not say which measure it uses, and investors usually quote multiple of money. The exit value itself is an assumption, and the table has no option pool or later rounds that would reduce the percentages.
An exit projection on a cap table is a forecast built on two assumptions: the exit value and the dilution between now and then. If a slide includes one, it should state both assumptions next to the number and show the effect of at least one more round.
A teaching example that gets the basics right
The "Effective Fund Raising" deck from UCC Ignite, a university startup programme, includes a worked example on page 50, "CAP Table at Angel Round", for an unnamed company with three founders. Each founder holds 750,100 shares (19.2%) bought at IR£0.01; private investors in Series A1 hold 400,000 shares (10.3%) bought at IR£1.00 for IR£400,000; Series A2 investors hold 724,700 shares (18.6%) at IR£1.75 for IR£1,268,225; staff hold 425,000 (10.9%) and directors 100,000 (2.6%), both at IR£0.10. Our calculation: the shares total 3,900,000; every percentage matches its share count to one decimal; the percentages add to 100.1% because of rounding; and 724,700 shares at IR£1.75 is IR£1,268,225 exactly.
It is not a real company's slide, so we treat it as a format reference rather than evidence of what companies do. The format is worth copying: one row per holder or class, shares, price paid, amount paid and percentage, so every figure can be checked against the others. What it does not show is which of the staff and director shares are options rather than issued shares, and whether any of them are unvested. At IR£1.75 a share, the whole company is valued at about IR£6.8M (our calculation, counting all 3,900,000 shares).
How to build the slide
Start from the full cap table, not from memory. Export share counts by holder and class from the company's register or cap table software, including every option grant, warrant, SAFE and convertible note. Add a row for any agreed but unissued shares, such as an advisor grant that has been promised but not papered.
Group the rows for the slide: founders (named if there are few), employees and the option pool (split between granted and unallocated), each investor round, and convertibles. For SAFEs and notes, show the number of shares they would convert into at the round's price and say that it is an estimate. Then add three columns: today, after the proposed round, and fully diluted. Our examples suggest the "after" column is the one most often missing.
Put the round's price per share and the pre-money and post-money valuations above the table, and check that price times post-round shares equals the post-money valuation. If preferred shares convert at anything other than one-for-one, show the converted figures. If the round requires a new or enlarged option pool, add it to the "after" column so the dilution is visible before the term sheet, not after it.
Finally, run the four checks from this guide: rows add to the total, percentages match the shares, price matches valuation, and everything that can become a share is counted. Date the table. If an investor would need the full register to understand it, offer it in the data room and say so on the slide.
Common mistakes
Rows that don't add to the total. Re-add every column after editing a row.
Percentages that don't match shares. Recalculate percentages from share counts, not by hand.
Valuation on the wrong basis. If preferred converts at more than one-for-one, show the converted value.
Only the pre-round view. Show what the round does to each holder, including any pool top-up.
Options and convertibles in footnotes. Put them in a fully diluted line.
Exit payouts on today's percentage. State the exit and dilution assumptions, or leave the payout out.
Diagnostic checklist
The table is dated.
Every column adds to its total.
Each percentage matches its share count.
The option pool is split into granted and unallocated.
Options, warrants, SAFEs and notes appear in a fully diluted line.
The round's price matches its pre- and post-money valuation.
A post-round column shows each holder's new percentage.
Frequently asked questions
Should I put my cap table in my pitch deck?
A summary, yes, usually on or next to the ask slide. Show founders, investors, the option pool and convertibles before and after the round. Keep the full register for the data room.
What does fully diluted mean?
It counts every share that exists plus every share that could be created from options, warrants and convertibles. HydRx's table shows insiders at 31.6% of common shares but 29.8% fully diluted.
Should the option pool be in the pre-money or post-money?
Many investors ask for the pool to be created or enlarged before the round, which dilutes existing holders rather than the new investor. Whatever the terms, show the pool in the post-round column so the effect is visible.
How much should founders own after a seed round?
There is no fixed number, and this set does not support a benchmark. What investors look for is enough founder ownership to stay motivated through later rounds, which the post-round column lets them judge.
How do I show SAFEs and convertible notes on a cap table?
Estimate the shares each would convert into at the round's price, after any discount or cap, and show them as a separate line marked as an estimate.
How we chose these examples
Search (2026-09-30): the durable corpus index (docs/seo/artifacts/corpus-search, 70,729 unique pages, deduplicated by deck-file sha256 + page) was searched for "cap table", "capitalization table", "pro forma ownership", "dilution", "shareholder structure" and founder, pool and investor percentages; 174 pages matched the broadest search, most of them public-company share registers or cap-table software products.
Fifteen candidate pages were rendered from the original public deck files and read from the images; eleven are used: Deal Box 3, Sociolus 13, HydRx Farms 26, BioSculpture Technology 19, FarmCloud 8, DRIVE 11, CourtCorrect 10, Ajinomatrix 40, Brag House 23, Call The 10 and UCC Ignite 50 (a teaching example, labelled as such). Brag House is used because its deck predates its listing: the cover reads "Investor Presentation, November 2021", and its Nasdaq IPO was priced on 5 March 2025 according to its SEC prospectus.
Left out: Loqr 15 (titled "CAP TABLE" but shows only team photos and an investor logo, no ownership figures), Everything Blockchain 22 and Recruiter.com 15 (listed-company share registers, same lesson as HydRx), Citius Pharmaceuticals 31 and Survicate 15 (original deck files unavailable, so the images could not be checked), Properati (already analysed in our deal terms guide), Carta, eShares, Pulley and Capdesk (cap-table software products, not their own ownership), SPAC and merger pro forma tables (Leafly, Redbox, SoFi, Clover Health, eToro), and mining, bank and energy company shareholder registers.
All calculations are ours and labelled; readings of small print are from the slide images. This guide describes common cap table practice in general terms and is not legal, tax or financial advice. How we built this: drafted and checked with AI assistance (editorial model review against the original slide images); no human editor has reviewed this guide.