Pistil Data’s 15-slide Seed deck from July 2021 presents a compelling case for a centralized market intelligence platform in the fragmented cannabis industry. By positioning itself alongside category-defining giants like Bloomberg and Google, the company establishes a high-stakes narrative. The deck excels at identifying a specific, underserved user—the 'Territory Sales Rep'—and demonstrating immediate ROI through customer testimonials. While the deck lacks traditional financial projections or a detailed competitive landscape, its focus on 'Two Years of IP' and a massive data ingestion rate (…
Key takeaways
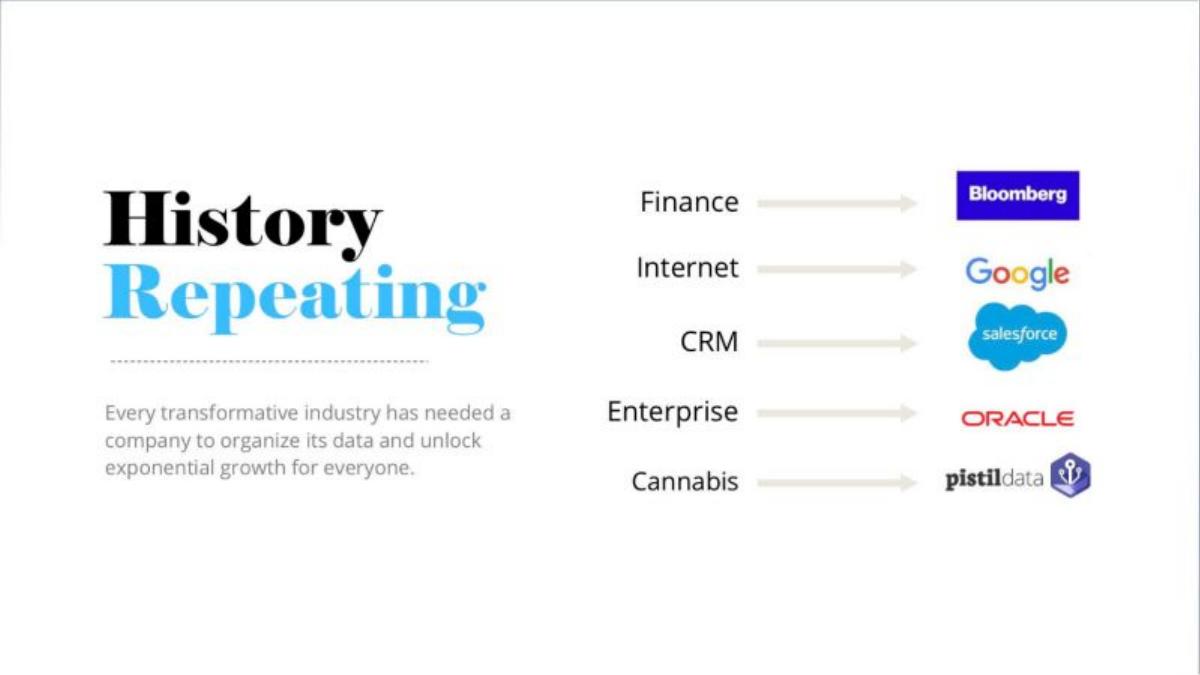
- The company positions itself as the 'Bloomberg' or 'Google' of the cannabis industry to signal massive market potential (Slide 3).
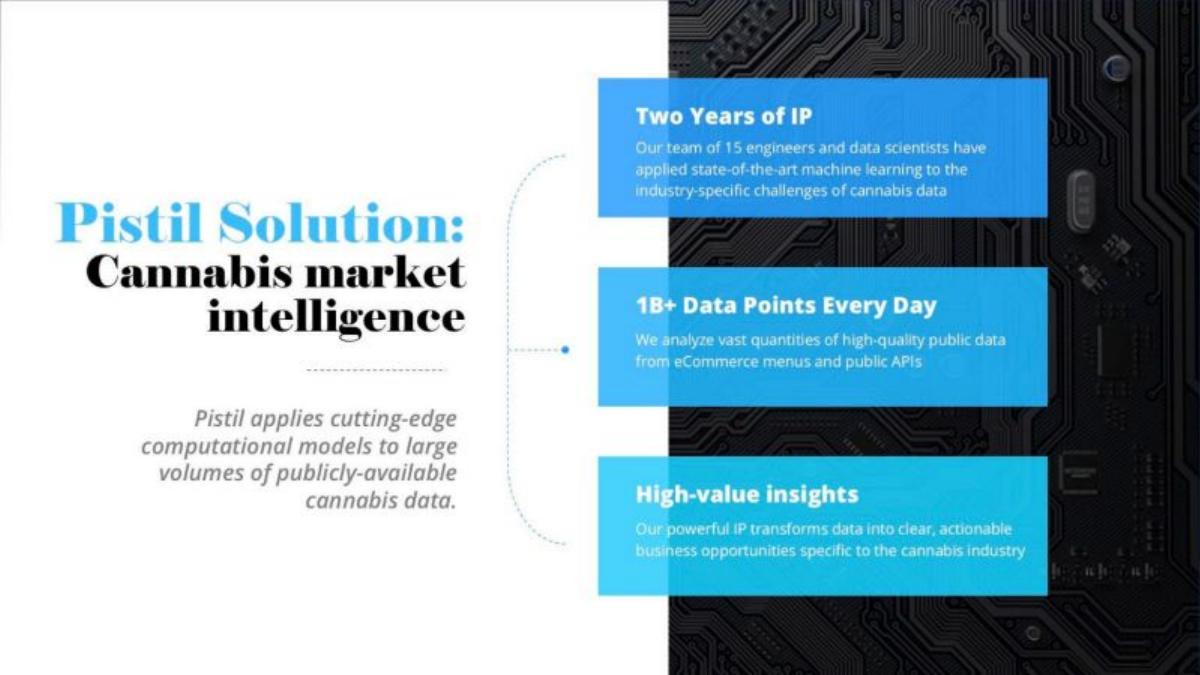
- Pistil claims a technical moat consisting of two years of IP and 1B+ data points analyzed daily from public APIs and eCommerce menus (Slide 4).
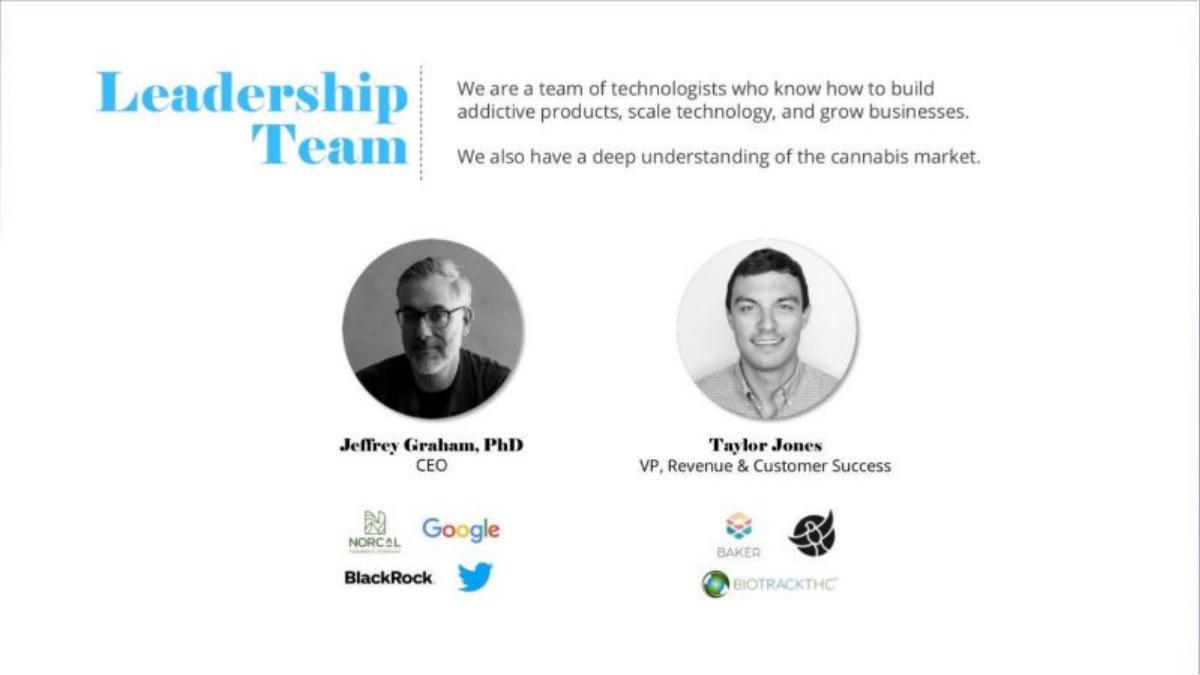
- The leadership team features experience from high-profile tech firms including Google, Twitter, and BlackRock (Slide 5).
- The deck identifies a very specific user persona: the 'Territory Sales Rep' who spends 10-15 hours a week on Weedmaps and is often 'data-averse' (Slide 8).
- Pistil for Brands launched in February 2021 in California and expanded to Colorado by June 2021 (Slide 7).
- The deck showcases 'Broad Industry Adoption' with a logo cloud featuring over 30 cannabis brands (Slide 10).
- Customer testimonials provide specific ROI metrics, such as winning 14 new accounts in a single quarter (Slide 11).
- The expansion plan targets 15 states by Q4 2022, moving from a regional to a national footprint (Slide 12).
The Narrative: Organizing a Fragmented Industry
Pistil Data’s Seed deck is a masterclass in the 'Industry Standard' narrative. From the outset, the company does not just pitch a tool; it pitches the necessity of a data layer for an entire emerging economy. By July 2021, the cannabis industry was experiencing rapid growth but suffered from extreme data fragmentation due to varying state regulations and a lack of legacy infrastructure. Pistil positions itself as the solution to this 'iceberg' problem.
Slides 1-3: The Macro Thesis
Slide 1 is a minimalist title slide, establishing the brand identity and the timing of the round (July 2021). Slide 2 , titled 'The Problem,' uses an iceberg graphic to illustrate that 'Cannabis data being utilized today' is just the tip of the 'Available data.' It explicitly states that industry growth is 'held back by legacy data solutions' and 'sub-par market intelligence.'
Slide 3 is perhaps the most important 'vision' slide in the deck. Titled 'History Repeating,' it draws direct parallels between Pistil and iconic companies: Bloomberg for Finance, Google for the Internet, Salesforce for CRM, and Oracle for Enterprise. This 'X for Y' strategy is a common venture capital trope, but here it serves to anchor the investor’s expectations on a multi-billion dollar outcome rather than a niche software play.
Slides 4-5: The Moat and The Men
Slide 4 addresses the 'Why Now' and the technical barrier to entry. It highlights 'Two Years of IP' and a team of 15 engineers. The most striking figure is the '1B+ Data Points Every Day' ingested from eCommerce menus and public APIs. This suggests that while the data is public, the scale of ingestion and the machine learning required to clean it constitutes a significant headstart.
Slide 5 introduces the leadership. CEO Jeffrey Graham, PhD, brings pedigree from Google, Twitter, and BlackRock, while Taylor Jones (VP Revenue) brings industry-specific experience from Baker and BioTrackTHC. This balance of 'Big Tech' expertise and 'Cannabis Tech' experience is designed to de-risk the execution of the vision.
Slides 6-9: Product and Persona
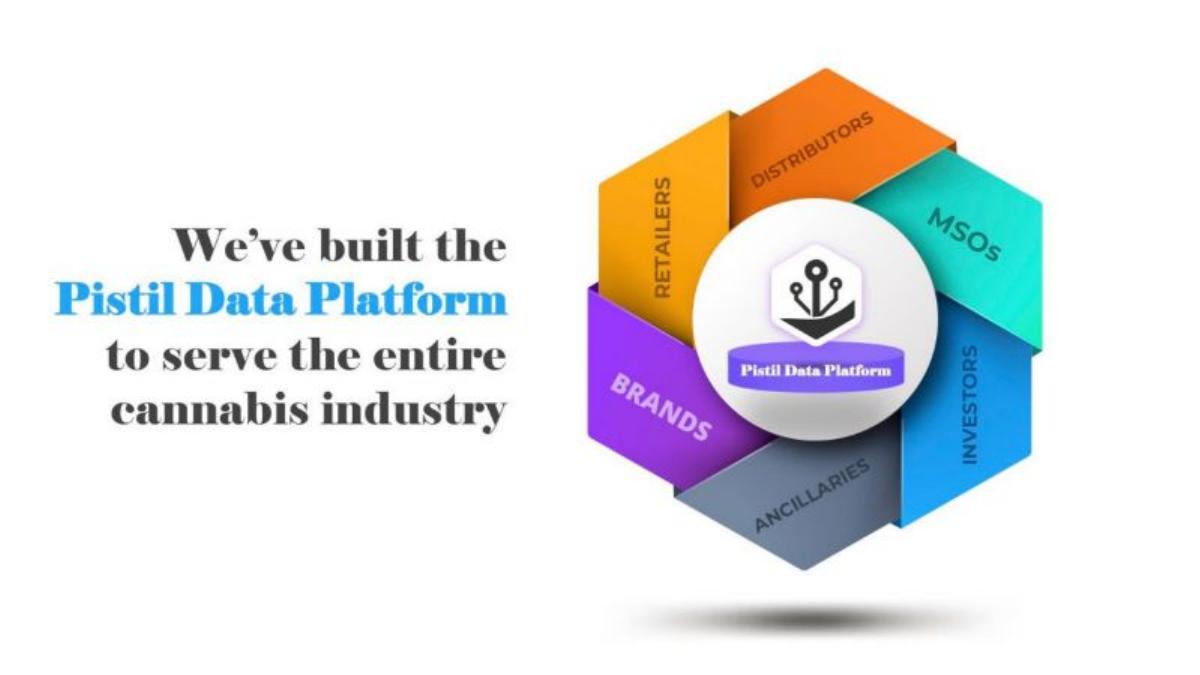
Slide 6 shows a hexagonal graphic of the 'Pistil Data Platform' serving Brands, Retailers, Distributors, MSOs, Investors, and Ancillaries. This demonstrates the long-term TAM (Total Addressable Market). However, Slide 7 quickly narrows the focus to the 'First Product': 'Pistil for Brands,' which launched in California (Feb 2021) and Colorado (June 2021).
Slide 8 is a standout slide for any founder to study. Instead of vague 'customer segments,' it defines a 'User Persona': the Territory Sales Rep. It notes they are 'data-averse,' spend 50% of their time in a car, and have 'no laptop.' This explains the mobile-first design shown in the Live Demo (Slide 9) . The app focuses on actionable triggers like '112 Prospects who don't stock these products' and '10 Winback Opportunities.'
Slides 10-12: Traction and Expansion
Slide 10 displays a logo cloud of over 30 brands, including Plus, Flow Kana, and CannaCraft, under the header 'Broad Industry Adoption.' This is a powerful social proof slide for a seed-stage company. Slide 11 reinforces this with qualitative ROI. Quotes from sales reps and directors mention winning '14 new accounts' and saving time by spending 'less time in front of a computer.'
Slide 12 provides the roadmap. It features a US map with 15 states highlighted in blue, promising a presence in these markets by Q4 2022. This shows a clear path from a regional pilot to a national platform.
Slides 13-15: The Close
Slide 13 is the 'Ask.' It is notably light on financial specifics, stating they are raising a 'seed investment to scale' and will use the funds over 18 months for national roll-out and new product features. Slide 14 and Slide 15 are standard 'Thank You' and promotional slides for the deck source.
What Works in This Deck
The Persona Focus: By identifying the 'data-averse' sales rep in a car, Pistil explains exactly why their UI/UX looks the way it does. It moves the conversation from 'features' to 'utility.' · The Bloomberg Comparison: It sets a high ceiling for the company's valuation and purpose. · Social Proof: The combination of a dense logo cloud and specific ROI testimonials (e.g., '14 new accounts') makes the product feel 'vetted' by the industry.
What Is Missing
Financials: There are no slides covering ARR, MRR, or burn rate. While common in very early seed decks, the presence of a launched product usually warrants some mention of revenue growth. · Competition: The deck ignores other cannabis data players (like Headset or BDSA). Investors would likely ask how Pistil’s 'public data' approach differs from the 'retailer-integrated' approach of competitors. · Unit Economics: There is no mention of the cost to acquire these brands (CAC) or the expected lifetime value (LTV).
What Founders Should Copy
The 'History Repeating' Slide: If you are in a 'messy' new industry, show how every other major industry eventually got its 'source of truth' platform. · The User Persona Slide: Don't just say who your customer is; describe their daily life (e.g., '50% travel time in car; no laptop'). It proves you have built something they will actually use. · Specific Testimonials: Use quotes that mention hard numbers (new accounts won) rather than just 'we love the app.'
Frequently asked questions
- How much did Pistil Data raise with this deck?
- According to the catalogue listing, Pistil Data raised a total of $65M. However, Slide 13 of the deck simply states they are 'raising a seed investment' without specifying the exact dollar amount for that specific round.
- What is Pistil Data's core product?
- Their first product is 'Pistil for Brands,' which launched in February 2021. It is a mobile-first market intelligence tool designed for sales representatives to find new prospects, win back lost accounts, and track retail trends (Slides 7-9).
- Who is the target user for Pistil Data?
- The deck specifically targets the 'Territory Sales Rep.' This persona is described as someone who spends 50% of their time in a car, does not use a laptop, and is typically 'data-averse,' needing simple answers to 'Who should I call?' (Slide 8).
- What is the company's competitive advantage?
- Pistil cites its 'Two Years of IP' and a team of 15 engineers/data scientists as its primary moat. They claim to analyze over 1 billion data points daily from public sources to create 'high-value insights' (Slide 4).
- What is missing from the Pistil Data pitch deck?
- The deck lacks several standard components, including a detailed slide on unit economics (CAC/LTV), a formal competitive landscape matrix, and specific financial projections or historical revenue figures.