Inbound vs Outbound on a Pitch Deck: Show Where New
'60% inbound' means little until you say 60% of what, what counts as inbound and what outbound adds.
Inbound vs Outbound on a Pitch Deck: Say Share of What, Define Each, Show What Changed
Many founders describe their sales motion in two words: inbound and outbound. Inbound customers find the company themselves, through search, content, word of mouth or the product. Outbound customers are found by the company, through sales reps, events, partners or cold outreach. The split matters to investors because it answers two different questions. Strong inbound suggests real pull from the market and cheap acquisition. Working outbound suggests the company can create demand on purpose, which is what a funding round usually pays for. Yet the split is often shown as a bare percentage with no base and no definitions. This guide looks at four real decks that report inbound and outbound and shows what makes the split informative: what the percentage is a share of, what each word includes, and whether the company has shown that adding outbound changes the numbers.
TL;DR
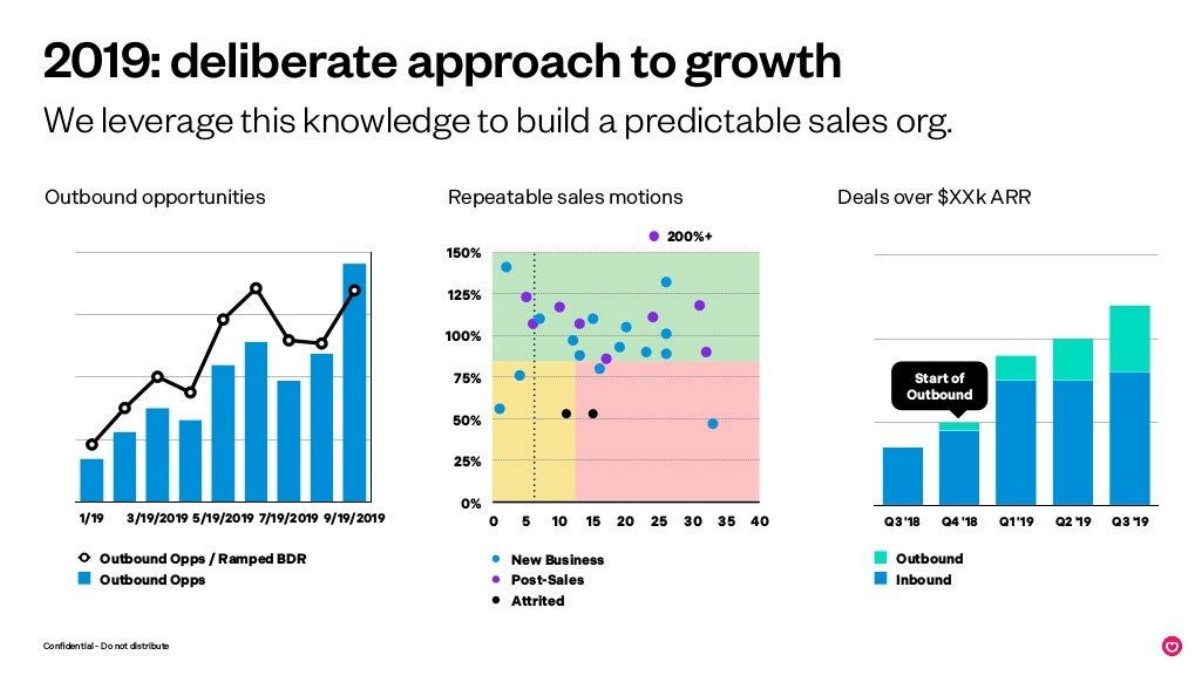
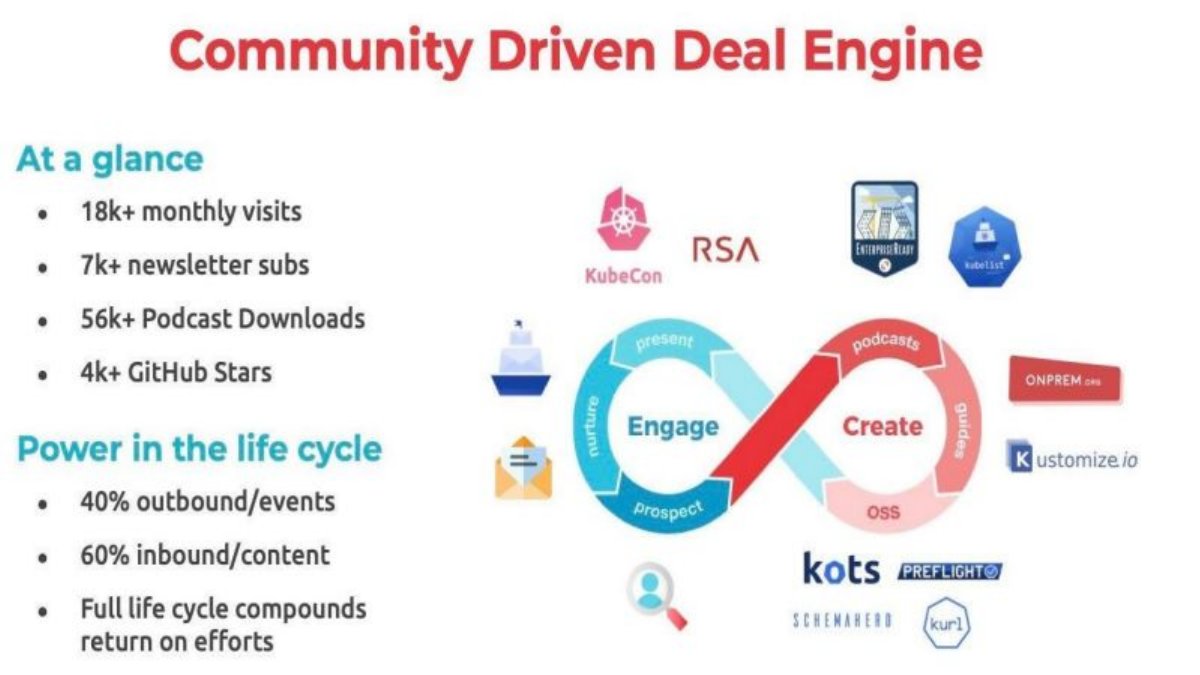
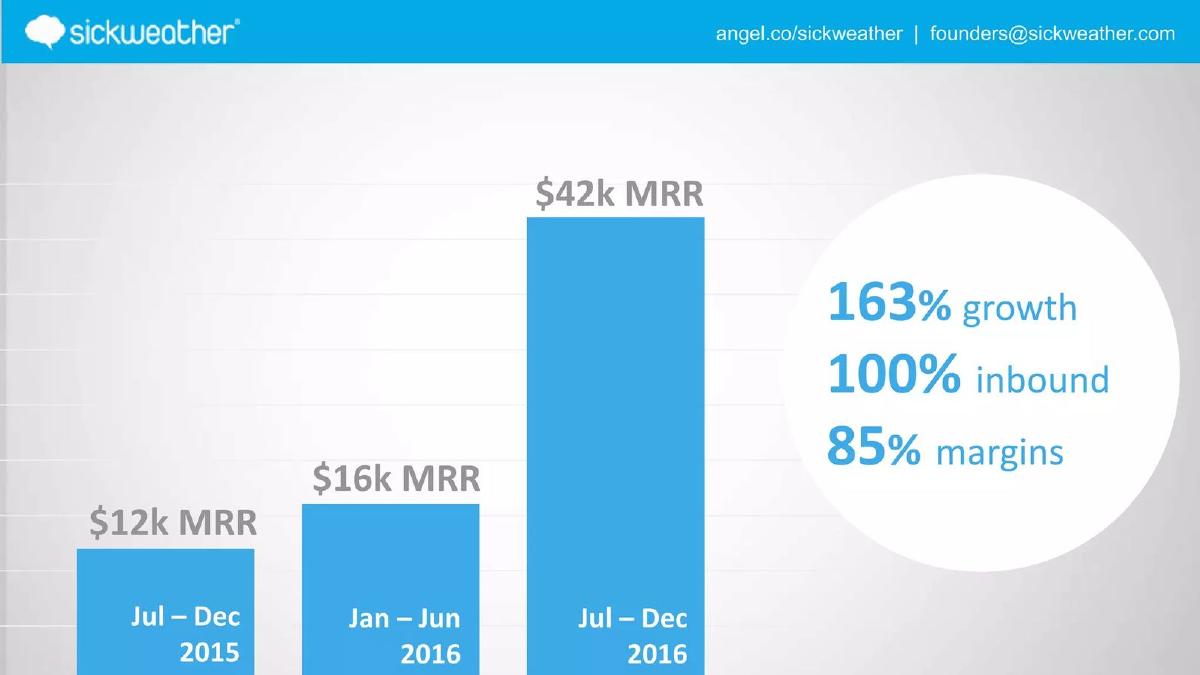
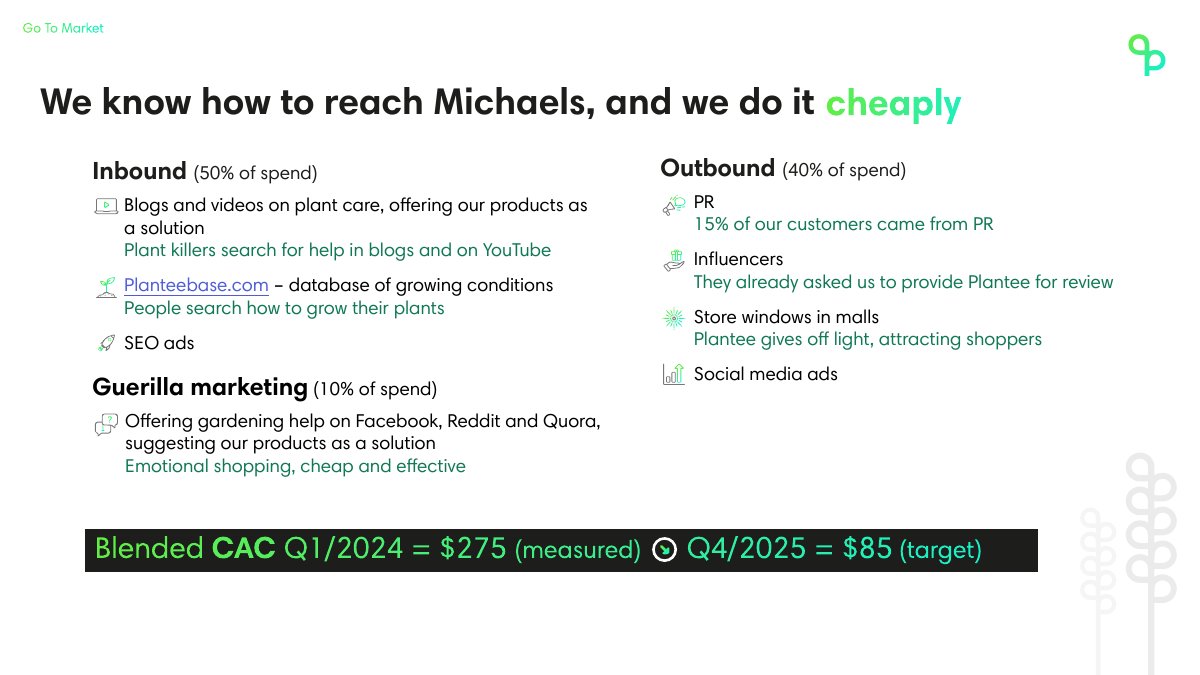
State what the split is a share of (new customers, new revenue, pipeline or spend), define what you count as inbound and outbound, give the period, and if you are raising to build a sales team, show what outbound has added so far. Front, in a Series C deck, shows a stacked chart of 'Deals over $XXk ARR' by quarter from Q3 '18 to Q3 '19, split into 'Inbound' and 'Outbound', with a 'Start of Outbound' marker in Q4 '18, so the reader can see outbound arriving on top of inbound rather than replacing it, though the values are hidden. Replicated lists '40% outbound/events' and '60% inbound/content' without saying 40% of what. Sickweather pairs '100% inbound' with MRR growing from '$12k' to '$16k' to '$42k' across three half-years, which shows pull but also shows that the company has never tested whether it can sell. Plantee splits its marketing by spend, 'Inbound (50% of spend)', 'Outbound (40% of spend)', 'Guerilla marketing (10% of spend)', and places SEO ads under inbound and PR under outbound, which shows why definitions have to be on the slide.
Four decks that report inbound and outbound
Each slide is read at full size. Quotes are exact.
Front go to market slide — slide 17
Shared inbox software. Series C growth-approach slide.
Front deck, slide 17. Exact stored slide matched to this analysis.
Our analysis: Shows outbound adding deals on top of inbound rather than relabelling them.
Evidence and limitation: Trend by source with a start marker; no axis values; deal threshold hidden in our copy.
What a founder can adapt: Keep the stacked bars and marker; add counts or the latest share.
Supporting analysis
What the deck claims: "Deals over $XXk ARR" by quarter, Q3 '18 to Q3 '19, stacked "Inbound" and "Outbound", with a "Start of Outbound" marker at Q4 '18.
Presentation choice: The clearest layout for showing what outbound adds.
When it does not fit: Hiding every value, so size can't be judged.
Plantee deck, slide 14. Exact stored slide matched to this analysis.
Our analysis: Useful spend view; labels differ from common usage.
Evidence and limitation: Split by spend; customer source given for one channel only; CAC labelled measured vs target.
What a founder can adapt: Add share of customers and CAC per channel.
Supporting analysis
What the deck claims: "Inbound (50% of spend)" incl. "SEO ads"; "Outbound (40% of spend)" incl. PR, "15% of our customers came from PR"; "Blended CAC Q1/2024 = $275 (measured)", "Q4/2025 = $85 (target)".
Presentation choice: Shows why definitions must sit on the slide.
When it does not fit: Comparing your split to others without matching definitions.
After: "New ARR, FY[year]: 60% inbound/content, 40% outbound/events; first-touch attribution."
What improved: Our illustrative rewrite of Replicated's lines. Bracketed details are not stated on the slide.
The question this guide answers
This guide answers one founder question: how should I show the balance between customers who find us and customers we go out and find, so that investors can judge both market pull and our ability to sell?
Our customer acquisition guide covers which channels a company uses. Our organic growth draft covers referrals and word of mouth, and the base an organic share needs. Our sales capacity draft covers what each hired salesperson produces. Our channel cost material covers CAC by channel. None of these takes the inbound and outbound split itself as the subject: what the percentage measures, what each label includes, and how a company should present the shift from founder-led inbound to a deliberate outbound motion, which is often the story behind a Series A or later raise.
How we chose and read the examples
We searched extracted slide text across the library for inbound and outbound mentioned together, or inbound with a percentage. About forty pages matched. We set aside pages where the words describe something else (payments in and out, phone calls, pipelines in an energy deck, investment funds sourcing deals), pages that only list 'inbound and outbound marketing' as a plan with nothing measured, and a GetAccept slide whose shares are all replaced with 'XX'. Four remained, each showing a different way of reporting the split: a quarterly chart by deal source, a two-line percentage split, a single '100% inbound' claim next to revenue, and a split by marketing spend.
Each slide was rendered from the source deck and read at full size; Front's chart labels and Sickweather's figures were also checked at 200 dpi. Front's chart has no axis values and its deal threshold reads '$XXk' in our copy, so we describe shapes, not numbers. All four companies were private when these decks were made. We did not check any figure against outside sources.
Why investors ask about the split
It shows pull. Customers who arrive unprompted are evidence that the problem is felt and the product is findable. They also tend to be cheap to acquire.
It shows whether growth can be bought. A round is usually raised to grow faster than the market would deliver on its own. If every customer so far arrived by themselves, the investor is funding an untested sales motion. If outbound already works, the investor is funding more of something proven.
It changes the economics. Outbound customers usually cost more to win and may be larger. A shift in the mix changes blended CAC, sales cycle and deal size, so a forecast that assumes today's CAC while planning a sales team is likely to be wrong.
It is easy to make look good. Inbound has no fixed definition. Paid search, partner referrals, events and PR are counted as inbound by some companies and outbound by others. A founder can move the split by moving the line.
Outbound shown arriving on top of inbound: Front
Front, a shared inbox company, has a Series C slide headed '2019: deliberate approach to growth', with the subtitle 'We leverage this knowledge to build a predictable sales org.' It has three charts. The left, 'Outbound opportunities', shows monthly bars from January to September 2019 with a line for 'Outbound Opps / Ramped BDR'. The middle, 'Repeatable sales motions', is a scatter of 'New Business', 'Post-Sales' and 'Attrited' accounts. The right, 'Deals over $XXk ARR', is a stacked bar chart by quarter, Q3 '18 to Q3 '19, with each bar split into 'Inbound' and 'Outbound'. A callout reading 'Start of Outbound' points to Q4 '18, the first quarter with an outbound segment.
This is the most informative of the four, and it has no visible numbers. The design does the work. The reader can see that inbound deals were already there before outbound started, that inbound kept roughly its level or grew in the following quarters, and that outbound added a growing slice on top. That answers the investor's real question, whether outbound adds new deals or just relabels deals that would have come anyway, as far as a chart can. The left chart adds a second piece of evidence: outbound opportunities per ramped BDR, which speaks to whether the motion scales with hiring.
The weaknesses come from what is hidden. 'Deals over $XXk ARR' means the reader doesn't know the deal size threshold, and with no axis the reader can't tell whether outbound is ten deals or a hundred. The split also covers only large deals; smaller deals, which may be mostly inbound, are left out. A founder copying this layout should keep the 'start of outbound' marker and the stacked bars, and add the counts or at least the share in the latest quarter.
A split with no base: Replicated
Replicated, a software distribution company, has a slide headed 'Community Driven Deal Engine'. On the left, under 'At a glance': '18k+ monthly visits', '7k+ newsletter subs', '56k+ Podcast Downloads', '4k+ GitHub Stars'. Under 'Power in the life cycle': '40% outbound/events', '60% inbound/content', 'Full life cycle compounds return on efforts'. On the right, an infinity loop runs through 'Create' (podcasts, guides, OSS) and 'Engage' (present, nurture, prospect), surrounded by logos of conferences and the company's open-source projects.
The slide does two useful things. It ties inbound to a named cause, content and open source, with reach figures for each. And its labels define the categories: outbound includes events, inbound means content. Many decks leave even that out.
But the split has no base. 40% of what: deals, pipeline, new revenue, leads? Over what period? The difference matters. 60% of leads could be a small share of revenue if outbound deals are larger, which is often the case. The reach figures also measure audience, not customers, so they don't explain the 60%. A single word would fix the main gap: '60% of new ARR from inbound/content (FY[year])'.
All inbound, next to revenue: Sickweather
Sickweather, a company that maps illness reports, has a slide showing MRR in three half-year bars: '$12k MRR' for July to December 2015, '$16k MRR' for January to June 2016 and '$42k MRR' for July to December 2016. A circle on the right reads '163% growth', '100% inbound', '85% margins'.
The arithmetic checks: $42k is 2.625 times $16k, a rise of about 163% from the first half of 2016 to the second. Placing '100% inbound' next to that jump makes a clear argument: the company grew revenue more than two and a half times in six months without a sales team. That is real evidence of pull, and an investor will read it that way.
An investor will also read the opposite. 100% inbound means the company has not yet shown it can win a customer it chose. If the round is meant to fund sales hires, the slide gives no evidence that they will work. It also doesn't define inbound (were the customers from press, partners, or search?) or say what the MRR is per customer, which matters because a few large inbound deals behave very differently from many small ones. The honest version keeps the claim and adds the plan: '100% inbound to date; first outbound test with [n] reps from [month], target [x] deals.'
A split by spend, with surprising labels: Plantee
Plantee, a smart plant-pot company, has a go-to-market slide headed 'We know how to reach Michaels, and we do it cheaply' (Michaels is the customer persona named in the deck). Three groups follow. 'Inbound (50% of spend)': blogs and videos on plant care, 'Planteebase.com – database of growing conditions', and 'SEO ads'. 'Guerilla marketing (10% of spend)': gardening help on Facebook, Reddit and Quora. 'Outbound (40% of spend)': PR, with the note '15% of our customers came from PR'; influencers, 'They already asked us to provide Plantee for review'; store windows in malls; and social media ads. A bar at the bottom reads 'Blended CAC Q1/2024 = $275 (measured)' and 'Q4/2025 = $85 (target)'.
This slide shows a different, and often more useful, split: where the money goes, rather than where the customers come from. Pairing that with a measured blended CAC and a dated target gives the investor something to test. It also labels the CAC clearly as measured or target, which many decks don't.
The labels are the lesson. 'SEO ads' sits under inbound, and PR and social ads under outbound. Other companies would class paid search as paid acquisition, not inbound, and PR as earned or inbound. Neither choice is wrong, but a reader comparing Plantee's 50/40 with another deck's split would be comparing different things. The slide also gives the customer source for only one channel (PR, 15%), so the reader can't match spend to results: whether the 50% spent on inbound produced more or fewer customers than the 40% on outbound. The fix is a small table: channel, label, share of spend, share of new customers, CAC.
What to put on the slide
The base. Say what the percentage measures: new customers, new ARR, qualified pipeline, leads or spend. If you can show two, show customers and revenue; they often differ.
The definitions. One line: 'Inbound = customer contacted us first (search, content, referral); outbound = we contacted them first (reps, events, partners).' Say where paid ads and partners sit.
The period and the trend. A split for one quarter is a snapshot. A split by quarter, as Front shows, tells the story of how the motion is changing.
What outbound adds. If you are raising for sales, show the quarter outbound started, what it has produced and what it costs. If you haven't started, say so, and say how and when you will test it.
Cost and size by source. Where you have it, add CAC and average deal size for each side. Outbound deals are often larger and slower; showing that turns a mix change into a forecast input.
Attribution. Say how you assign a customer to a source: first touch, last touch or self-reported. GetAccept's slide, set aside here because its shares are hidden, notes 'first touch attribution', which is the kind of detail that makes a split checkable.
Where the split goes in the deck
On the go-to-market slide, as Front, Replicated and Plantee place it, when the split explains how you will grow. On the traction slide, as Sickweather does, when inbound is part of the evidence of demand. In the use-of-funds or hiring plan, as a reference back, when the round funds a change in the mix.
Keep it consistent. If the traction slide says '100% inbound' and the forecast assumes outbound reps closing deals at today's CAC, the reader will notice the gap. Use the same base and the same definitions everywhere the split appears.
Templates
Snapshot: '[x]% of new [customers/ARR] from inbound ([sources]), [y]% from outbound ([sources]), [period]; attribution: [first touch].'
Trend: 'Outbound started [quarter]; outbound share of new ARR [a]% → [b]% over [n] quarters; inbound flat/growing at [z] deals per quarter.'
All inbound: '100% inbound to date ([sources]); first outbound test: [n] reps from [month], target [x] deals at CAC $[y].'
By spend: '[Channel]: [label], [x]% of spend, [y]% of new customers, CAC $[z].'
What these examples can and cannot show
These four slides show how founders have described their inbound and outbound mix. They can't show whether the splits were measured as stated, how sources were attributed, how the mix affected cost or deal size, or what happened after each deck. Front's chart hides its values, so we cannot say how large the outbound share was. Sickweather's '163% growth' matches its own bars, but we have not checked the MRR.
Treat them as patterns. Front shows outbound arriving on top of inbound over time, without numbers. Replicated defines its categories but not its base. Sickweather shows pull and, by the same line, an untested sales motion. Plantee splits by spend and shows how much the labels matter.
Common mistakes
No base. A percentage with no 'of what' and no period.
Hidden definitions. Paid ads, PR or partners placed on either side without saying so.
All inbound, no plan. 100% inbound presented as proof that a sales team will work.
Static snapshot. One split with no sign of how the mix is changing.
Mix change, same CAC. A forecast that adds outbound reps but keeps inbound CAC.
Diagnostic checklist
Base and period stated.
Inbound and outbound defined, incl. paid ads and partners.
Attribution method noted.
Trend by quarter where available.
Outbound start and results shown, or test plan given.
CAC and deal size by source where known.
Frequently asked questions
Is 100% inbound good or bad on a pitch deck?
Both. It shows pull and low acquisition cost, and it shows the company hasn't yet proven it can sell. Say both, and say how you will test outbound.
Should paid ads count as inbound?
Either choice is defensible. What matters is saying which you chose, so the split can be compared and checked.
How we chose these examples
Corpus: published pitch deck teardowns on StartupFundraising.com. Founder-uploaded private decks are excluded.
Selection (2026-10-01): we searched extracted text for inbound and outbound together or inbound with a percentage, set aside unrelated uses, plan-only mentions and a slide with hidden shares, and kept four private-company slides each reporting the split differently.
Review: the four slides were rendered from the source decks on 2026-10-01 and read in full at full size against company, deck and page number, with Front and Sickweather also checked at 200 dpi (editorial model review, with AI assistance in drafting; not human-reviewed). Sickweather's growth figure was recalculated from its bars. No figure was checked against outside sources.