Price Comparison Slide: How to Show You Cost Less Than
How do you show investors your price beats the customer's alternative? Five real slides show how to compare total cost on the same basis.
Price Comparison Slide: Compare Total Cost on the Same Basis, and Show Your Assumptions
When a startup says it is cheaper than the alternative, investors want to see the comparison. Many decks show it with a single headline ("60% cheaper") or a tick in an "affordable" row. A comparison is only convincing when the reader can see what was compared: the same product or job, the same period, every cost the customer pays, and where the numbers came from. This guide uses five real slides to show how founders compare their price with the customer's other options, what makes the comparison believable, and when a price list is mistaken for a comparison.
TL;DR
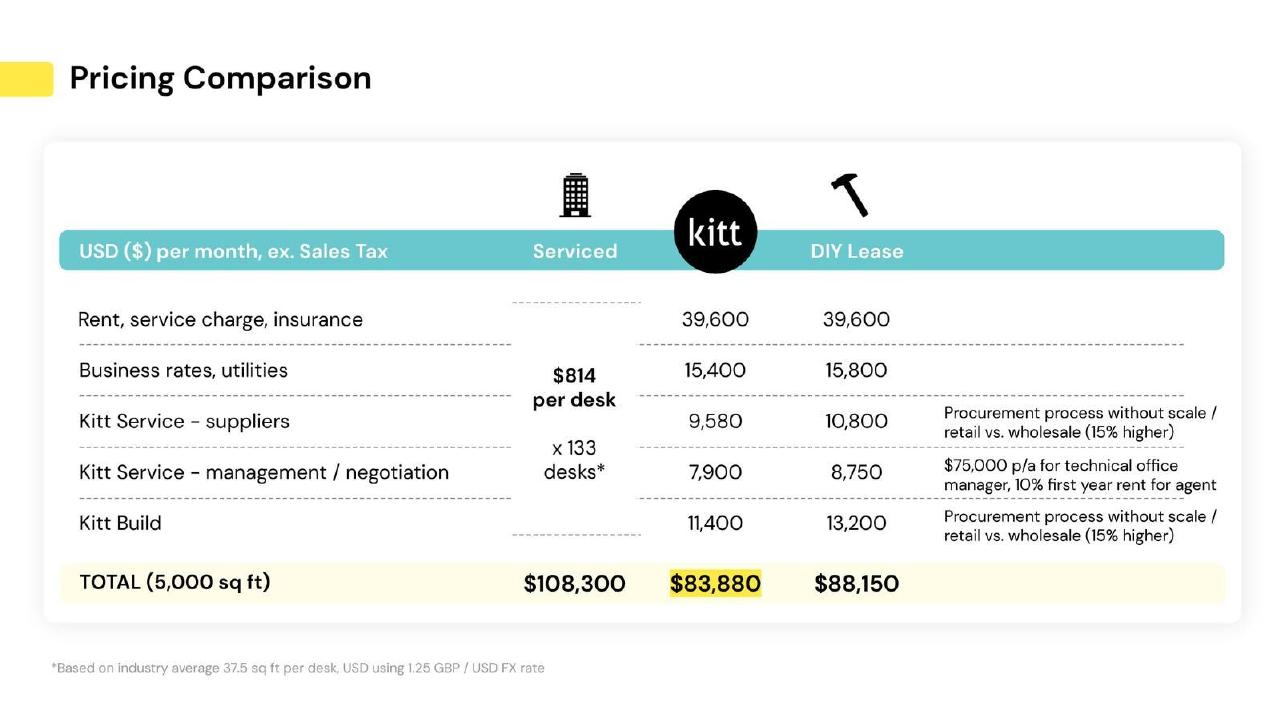
Compare the total cost a customer pays for the same thing, over the same period, line by line, against the option they use today, and print the assumptions under the table. Kitt does this best: a monthly cost table for a 5,000 sq ft office compares serviced space ($108,300), a do-it-yourself lease ($88,150) and Kitt ($83,880), with a note on desk size and exchange rate and a reason for each line where Kitt is cheaper.
Five price comparison slides, read in full
Each slide was rendered from the original deck at full size and read in full. Prices are as the slides state them; we did not check them against the market at the time.
Kitt deck, slide 15. Exact stored slide matched to this analysis.
Our analysis: The clearest and most checkable comparison in the set.
Evidence and limitation: Same size and period; five matching lines; reasons for each difference; assumptions stated.
What a founder can adapt: Add the source and date of the serviced-office price.
Supporting analysis
What the deck claims: "USD ($) per month, ex. Sales Tax"; "TOTAL (5,000 sq ft)": Serviced "$108,300", Kitt "$83,880", DIY Lease "$88,150"; "*Based on industry average 37.5 sq ft per desk, USD using 1.25 GBP / USD FX rate".
Presentation choice: It shows the small saving against a lease as well as the large one against serviced space.
When it does not fit: Showing only the most expensive alternative.
Car co-leasing service, 2016. Problem and solution slide with a cost table.
Orto deck, slide 5. Exact stored slide matched to this analysis.
Our analysis: A fair whole-term view, but a shared car against sole use.
Evidence and limitation: Upfront, monthly, running and whole-term costs; term length only in a separate notes document.
What a founder can adapt: State the term and what sharing means for the customer on the slide.
Supporting analysis
What the deck claims: "Cost comparison with traditional ownership models for a Jaguar F-Type S (1)"; whole term: Orto "£13,496", Leasing / finance "£37,169", Sole ownership "£26,853"; "ORTO % OF COST" 36% and 50%; "reducing the cost by over 60%".
Presentation choice: Whole-term cost avoids hiding upfront and running costs.
When it does not fit: A headline saving that quotes only the larger of two comparisons.
Planned airline for ski routes. Competitive advantage slide.
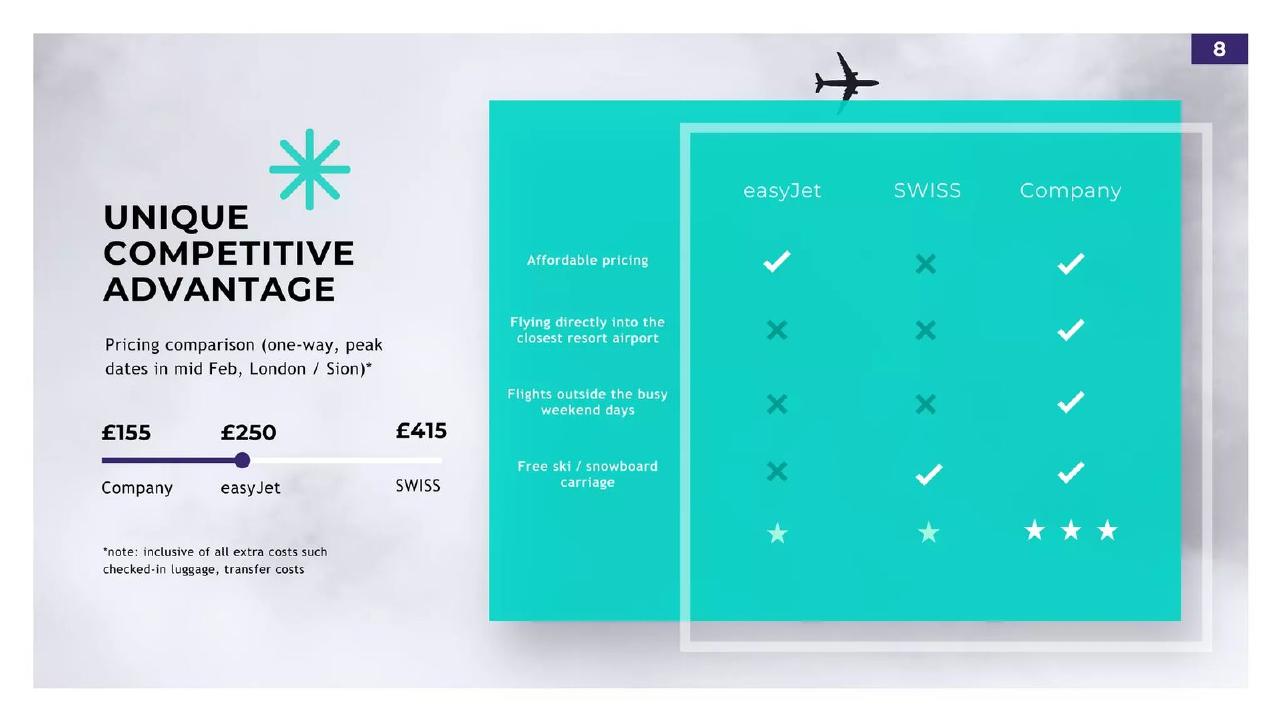
Private airline start-up deck, slide 7. Exact stored slide matched to this analysis.
Our analysis: Precise and fair to rivals, but compares a plan with real fares.
Evidence and limitation: One route, one season, all extras included; company fare is planned, not stated as such.
What a founder can adapt: Label the company fare as planned and show how it was worked out.
Supporting analysis
What the deck claims: "Pricing comparison (one-way, peak dates in mid Feb, London / Sion)*"; "£155 Company", "£250 easyJet", "£415 SWISS"; "*note: inclusive of all extra costs such checked-in luggage, transfer costs".
Presentation choice: Including extras stops low base fares from flattering the rivals.
When it does not fit: Giving a rival an "affordable" tick that the price line contradicts.
Online grocer in four countries. Service and value slide, 2022.
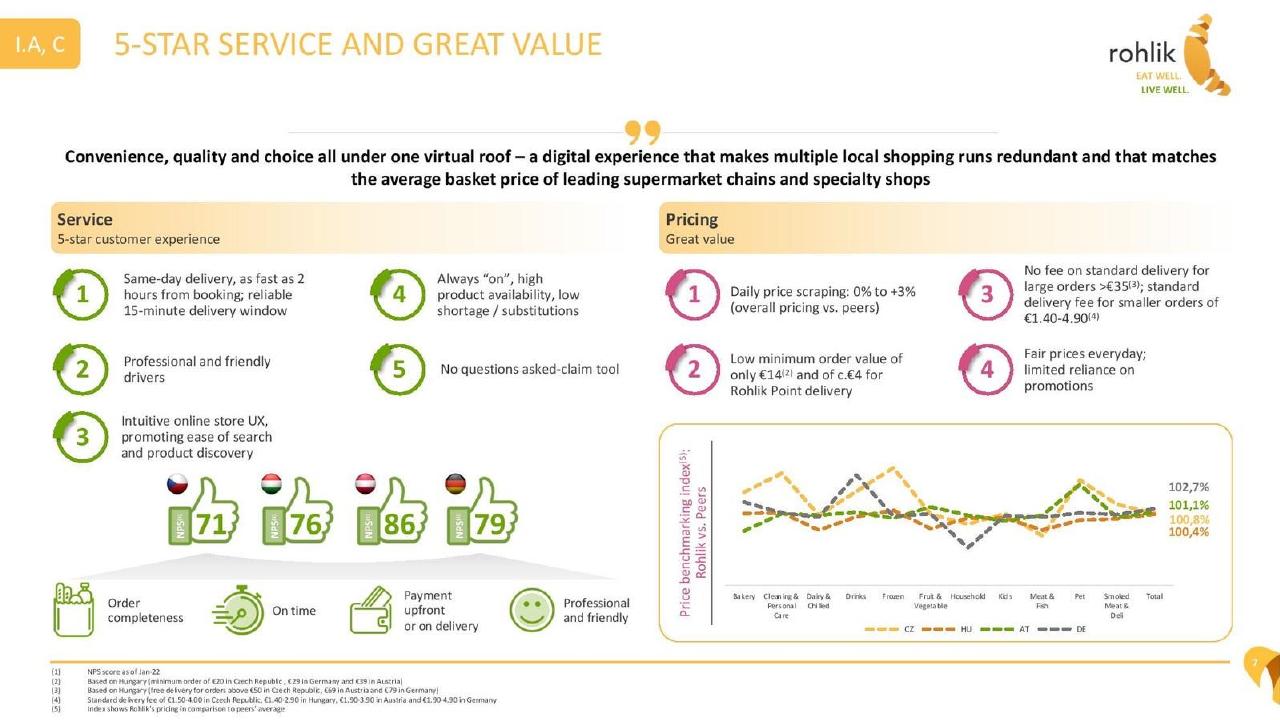
Rohlik deck, slide 8. Exact stored slide matched to this analysis.
Our analysis: An honest way to show parity, then argue on service.
Evidence and limitation: Level pricing claimed with a range, method and category chart; peers not named.
What a founder can adapt: Name the peers and add delivery fees to the comparison.
Supporting analysis
What the deck claims: "matches the average basket price of leading supermarket chains and specialty shops"; "Daily price scraping: 0% to +3% (overall pricing vs. peers)"; index totals 102.7%, 101.1%, 100.8%, 100.4%.
Presentation choice: Not claiming to be cheaper makes the other claims easier to believe.
When it does not fit: Burying part of the customer's cost in footnotes.
Electric car subscription service. Car range slide.
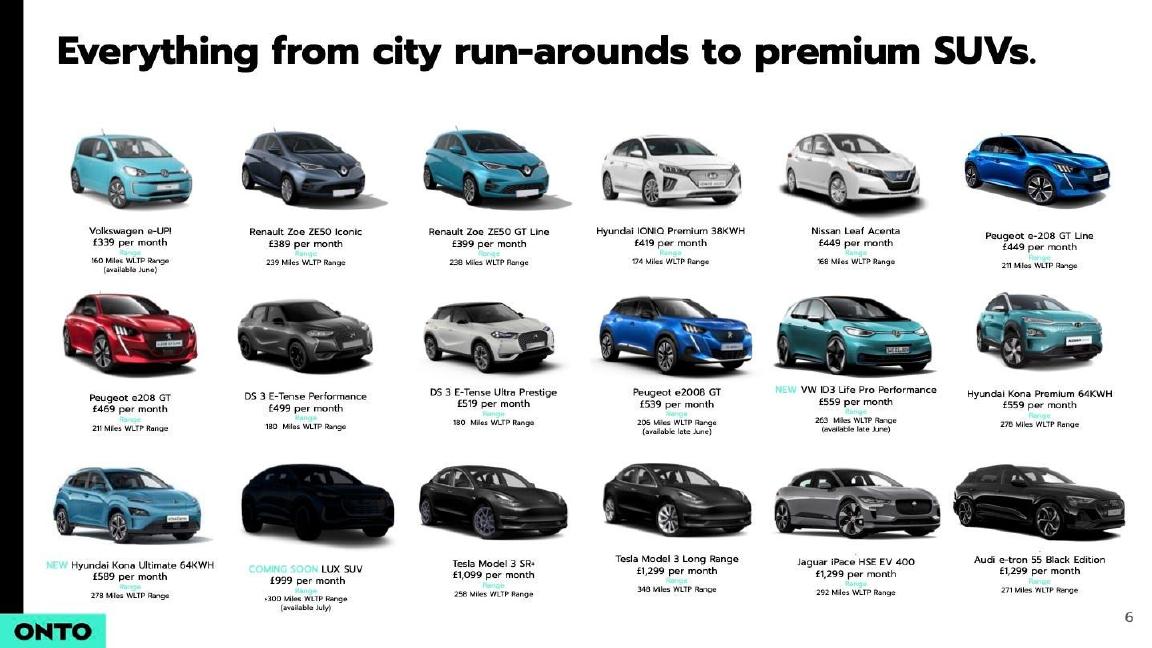
Onto deck, slide 6. Exact stored slide matched to this analysis.
Our analysis: A price list, not a comparison.
Evidence and limitation: Monthly prices for 18 cars; no alternative and no statement of what the price includes.
What a founder can adapt: Add one car priced against a typical lease with insurance and maintenance.
Supporting analysis
What the deck claims: "Everything from city run-arounds to premium SUVs."; "Volkswagen e-UP! £339 per month"; "Tesla Model 3 Long Range £1,299 per month"; 18 cars with price and range.
Presentation choice: Shows the gap a single comparison row would fill.
When it does not fit: Listing your prices and leaving the reader to find the alternative.
Whether each slide compares the same thing, includes all costs, names the alternative and states its assumptions.
Example
Same basis
All costs
Alternative named
Assumptions shown
Kitt
Yes (5,000 sq ft, monthly)
Yes, by line
Serviced, DIY lease
Yes
Orto
Shared vs sole use
Yes, whole term
Leasing, buying
Separate document
Private airline
Yes (one route, date)
Yes, extras included
easyJet, SWISS
Partly; own fare planned
Rohlik
Yes (category index)
Delivery fees in footnotes
"Peers" unnamed
Method stated
Onto
No comparison
Not stated
None
No
Key Takeaways
Compare the same job over the same period.
Include every cost the customer pays.
Name the alternative the customer uses today.
Print the assumptions on the slide.
If you are not cheaper, say so and say why customers pay.
Build your price comparison
Answer each prompt before putting a price comparison in your deck.
Alternative. What does your customer use today, and what is the cheaper alternative?
Basis. Which size, quantity and period will you price for every option?
Costs. Which setup, monthly, running and extra costs apply to each option, including yours?
Source. Where did each rival price come from, and when?
Status. Is your price charged today or planned?
Copyable framework: [Job] for [size/quantity] over [period]: [Option A] [total], [Option B] [total], [Us] [total]. Includes [costs]. Prices from [source], [month year].
Illustrative example 1 — written by us
Before: "60% cheaper than the competition" with no figures.
After: "Running a 20-person office for 12 months: serviced space $210,000, self-managed lease $172,000, us $164,000. Includes rent, utilities, suppliers and fit-out. Rival prices from three listings, March 2024."
What improved: Our illustrative rewrite; the figures are invented for the example. It names the job, the period, both alternatives and the source, and shows the smaller saving as well as the larger one.
The question this guide answers
Founders ask how to show that their product costs less than what customers use now. The pricing slide guide covers what a customer pays for: tiers, usage units and list prices against real prices. The competition guides compare features, usually with tick tables. Neither answers how to build a cost comparison a reader can trust: which alternative to pick, what to include and how to show the assumptions.
This matters because price claims are among the easiest to check. An investor can look up a rival's price in a minute. If the comparison leaves out a cost, picks an unusual date or compares a different product, the reader stops trusting the rest of the deck.
How we chose and read the examples
We searched saved slide text in the teardown library for price comparison, cost comparison, pricing comparison and prices placed side by side with an alternative, and left out mining, resource and listed-company presentations. Five slides from five startup decks remained: Kitt (offices), Orto (shared car leasing), a private airline start-up (named only as "Company" on its slide), Rohlik (online groceries) and Onto (electric car subscriptions).
Each slide was rendered from the original deck at full size and read in full. Quotes and figures are the slides' own. We did not check any price against the market at the time; this guide is about how clearly each comparison is built and what a reader can check.
The strongest pattern: a total-cost table
Kitt, which sets up and runs offices for companies, titles its slide "Pricing Comparison". The table is in "USD ($) per month, ex. Sales Tax" for a "5,000 sq ft" office. Serviced space is shown as "$814 per desk x 133 desks", a total of "$108,300". The do-it-yourself lease and Kitt are broken into the same five lines: rent, service charge and insurance (39,600 for both); business rates and utilities (15,800 against 15,400); suppliers (10,800 against 9,580); management and negotiation (8,750 against 7,900); and build (13,200 against 11,400). Totals are "$88,150" and "$83,880".
Three things make this believable. Every option is priced for the same office size and period. The lines that differ each carry a reason, such as "Procurement process without scale / retail vs. wholesale (15% higher)" and "$75,000 p/a for technical office manager, 10% first year rent for agent". And a footnote states the assumptions: "Based on industry average 37.5 sq ft per desk, USD using 1.25 GBP / USD FX rate".
The table is also honest in a way that helps. Kitt is only about 5% cheaper than the do-it-yourself lease, and rent is identical. A reader learns that Kitt's real advantage over a self-managed lease is the work it saves, while its price advantage is mainly against serviced offices. The slide doesn't say who chose the serviced-office price or when it was collected; one line naming the source would close that gap.
A whole-term comparison
Orto, a 2016 co-leasing service where four people share one car, puts a cost comparison next to its problem and solution. The chart and table compare "Orto", "Leasing / finance" and "Sole ownership (lump sum cash purchase)" for "a Jaguar F-Type S": upfront cost £2,249 against £5,000 and £66,565; monthly cost £489 against £1,273 and £0; running cost £0 against £2,890 and £2,890; whole term £13,496 against £37,169 and £26,853. A final column says Orto costs 36% of leasing and 50% of buying.
This works because it compares the whole term, not one monthly figure that would hide upfront and running costs. Showing all three options also lets a reader see that buying outright is cheaper than leasing over the term, which makes the comparison look less chosen.
Two gaps. The term itself isn't stated on the slide; the heading's "(1)" points to "accompanying notes document", so the key assumption sits outside the deck. And Orto's price buys a quarter share of a car, while the others buy sole use. The comparison is fair only if the reader is told what the customer gives up. The text says "reducing the cost by over 60%", which matches the leasing comparison but not the 50% against buying; a headline should quote the smaller saving too.
One route, one date, all costs included
A private airline start-up, shown on its slide only as "Company", compares fares for "one-way, peak dates in mid Feb, London / Sion": "£155" for the company, "£250" for easyJet and "£415" for SWISS, with a note: "inclusive of all extra costs such checked-in luggage, transfer costs". Next to it is a tick table comparing affordability, flying into the closest resort airport, off-peak days and free ski carriage.
The strength is precision. One route, one season and all extras included make the comparison checkable and fair to the rivals, whose base fares would look lower without luggage and transfers. It suits a business whose customer is choosing between named options for one trip.
The weakness is that the company's price is a plan, not a fare it has sold, and the slide doesn't say so. Since the rivals' prices are real and the start-up's is projected, the reader should be told how the £155 was worked out. The tick table also gives easyJet an "affordable" tick while the price line shows it costs more, which mixes two measures.
When you are not cheaper: say so
Rohlik, an online grocer, titles its slide "5-STAR SERVICE AND GREAT VALUE". Its headline promises a service "that matches the average basket price of leading supermarket chains and specialty shops", and the pricing column says: "Daily price scraping: 0% to +3% (overall pricing vs. peers)". A chart shows a "Price benchmarking index" by product category for four countries, with totals of 102.7%, 101.1%, 100.8% and 100.4%; footnote (5) says the "Index shows Rohlik's pricing in comparison to peers' average".
This is a useful model for a business that isn't cheaper. Rohlik doesn't claim to beat supermarkets; it says its prices are level with them, gives a range, shows how it measures that (daily price checks) and puts the evidence by category. The rest of the slide argues that customers pay for service: same-day delivery, a 15-minute window and NPS scores from 71 to 86 "as of Jan-22".
What it leaves out: the slide doesn't name the peers in the index, and the delivery fees, which are part of what a customer pays, sit in footnotes by country rather than in the comparison.
A price list is not a comparison
Onto, an electric car subscription service, titles a slide "Everything from city run-arounds to premium SUVs." and shows 18 cars with a monthly price and range, from "Volkswagen e-UP! £339 per month" to "Tesla Model 3 Long Range £1,299 per month".
The slide shows the range of what Onto offers, which is useful. But it has no comparison: nothing tells the reader what leasing, financing or buying the same car would cost, or what the monthly price includes. For a subscription business whose case rests on being simpler or cheaper than leasing, a single row for one popular car, with Onto against a typical lease including insurance and maintenance, would do more than eighteen prices.
Choosing the alternative
Compare with what your customer does today, not with the most expensive option you can find. Kitt shows both serviced offices and a self-managed lease; Orto shows leasing and buying. Showing two alternatives, including the cheaper one, makes the comparison look fair.
Then include every cost the customer pays for each option: setup, monthly fees, running costs, extras like luggage or delivery, and the staff time an option needs. A comparison that leaves out costs on your side, such as delivery fees or a membership charge, will be found.
Showing the assumptions
Put the assumptions on the slide, in a footnote if needed: the size or quantity, the period, the date prices were collected, the source of rivals' prices and any exchange rate. Kitt's single line does this. Orto moved its assumptions to a separate document, which a reader of the deck alone can't see.
If your own price is planned rather than charged, say so. If your saving depends on a condition, such as sharing a car or ordering above a minimum, state it next to the figure.
Common mistakes
Only the dearest alternative. Show the cheaper option too.
Missing costs. Include setup, extras, delivery and running costs on every side.
Different products compared. Say what the customer gives up, as with a shared car.
Assumptions off the slide. Put size, period and source in a footnote.
Planned price shown as real. Label it planned.
Diagnostic checklist
Same job, size and period for every option.
All costs included on every side.
Customer's current option named.
Source and date of rival prices.
Your price marked charged or planned.
Frequently asked questions
Should my pitch deck have a price comparison slide?
If your case rests on saving customers money, yes. If customers pay you for something else, show price parity briefly, as Rohlik does, and spend the slide on that reason.
Is a percentage saving enough?
No. Show the figures behind it, so the reader can see what was compared and check it.
Can I compare with a competitor's list price?
Yes, if you say it is a list price and when you took it, and compare it with your own list price on the same basis.
How we chose these examples
Corpus: published pitch deck teardowns on StartupFundraising.com. Founder-uploaded private decks are excluded.
Selection (2026-10-01): we searched extracted slide text for price, cost and pricing comparison phrases and prices shown beside alternatives, excluded mining, resource and listed-company presentations, and kept five slides from five startup decks.
Review: all five slides were rendered from the source decks at full size on 2026-10-01 and read in full against company, deck and page number (editorial model review, with AI assistance in drafting). No person has yet completed a human review. Prices were not checked against the market at the time.