Time-Saved Claims in a Pitch Deck: Per What, Measured How
How to present "hours saved" in a pitch deck: choose the unit (per user, per task, per project, per year), state who measured it.
Time-Saved Claims: Say Per What, Measured How, and What the Time Is Worth
"300 days of engineering time saved." "45 mins saved each rep every day." "1–2 hours in time saved per week." Software that automates work almost always claims to save time, and investors have learned to read those claims with care. A number of hours means little until you know whose hours, per what, measured how, and what the customer does with the time. Three real decks show three different ways to present it. Transcend gives a before-and-after for one task and multiplies it out, and its arithmetic checks. Rattle quotes a different unit for each customer logo. Time by Ping pairs time saved with a revenue effect. This guide shows how to build a time-saved claim an investor can weigh.
TL;DR
A time-saved claim needs four things beside the number. The unit: hours per user per week, per task, per project or per customer per year, so a reader can scale it. The base: the time the task took before and after, not only the difference. The evidence: measured in product logs, reported by the customer, or estimated by you, with how many users and over what period. And the conversion: what the time becomes, either money (hours × a cost per hour the customer recognises) or capacity (more work done by the same team). Transcend's page has all four in rough form for one customer; most slides have one or two. Time is usually worth more to a customer as capacity than as a cost saving, because few customers cut staff when work gets faster; say which you mean.
Three real time-saved claims
Each slide below is shown as it appears in the company's original deck, with what it says, what we checked and what an investor still cannot tell. They run from the most checkable to the claim with the most to fix.
Transcend solution slide — slide 14
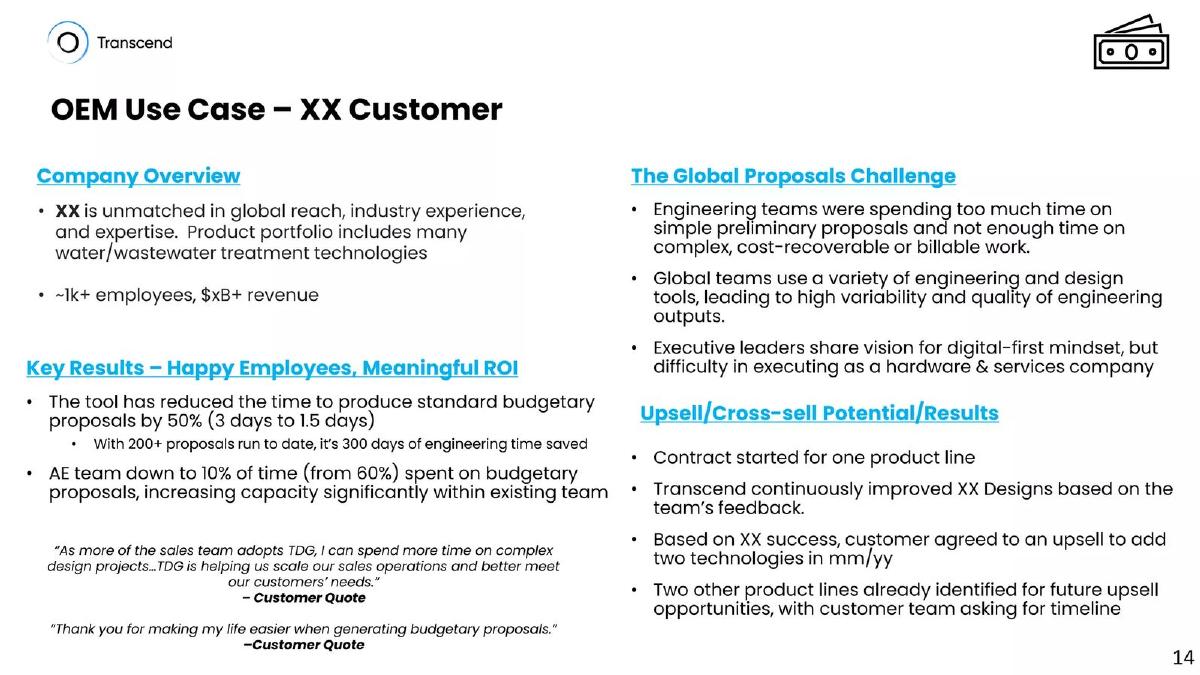
US design-automation software company for water and wastewater infrastructure; page 14 of its $20M deck, "OEM Use Case – XX Customer", a case study with the customer's name redacted.
Transcend deck, slide 14. Exact stored slide matched to this analysis.
Our analysis: The most checkable claim in the set: a before-and-after for one task, a count, and a total that the reader can reproduce. It also frames the gain as capacity ("within existing team") rather than a cost cut, and links the result to an upsell, which is what an investor ultimately cares about. Naming the period and the team size would complete it.
Evidence and limitation: Our checks: 3 − 1.5 = 1.5 days per proposal; 1.5 × 200 = 300 days, matching the slide (and "200+" makes 300 a floor). 300 working days is about 2,400 hours at 8 hours a day, a little more than one person's paid year at 2,087 hours. The 60% → 10% shift says proposal work went from most of the team's time to a small part of it; the team size is not given, so the capacity gain can't be sized. Not stated: whether the 3-day before figure is measured or recalled, over what period the 200 proposals ran, or the money value.
What a founder can adapt: Add the period ("200+ proposals over [n] months"), the team size, and whether the 3-day figure was measured.
Supporting analysis
What the deck claims: "Key Results – Happy Employees, Meaningful ROI": "The tool has reduced the time to produce standard budgetary proposals by 50% (3 days to 1.5 days)"; "With 200+ proposals run to date, it's 300 days of engineering time saved"; "AE team down to 10% of time (from 60%) spent on budgetary proposals, increasing capacity significantly within existing team". Customer: "~1k+ employees, $xB+ revenue". Two unattributed customer quotes. Right side: contract started for one product line; upsell agreed to add two technologies; two more product lines identified.
Presentation choice: It shows a per-task before-and-after multiplied into a total that checks, framed as capacity.
When it does not fit: Don't leave the customer's size as "$xB+" and "~1k+" placeholders if the deck goes out; give a range or remove it.
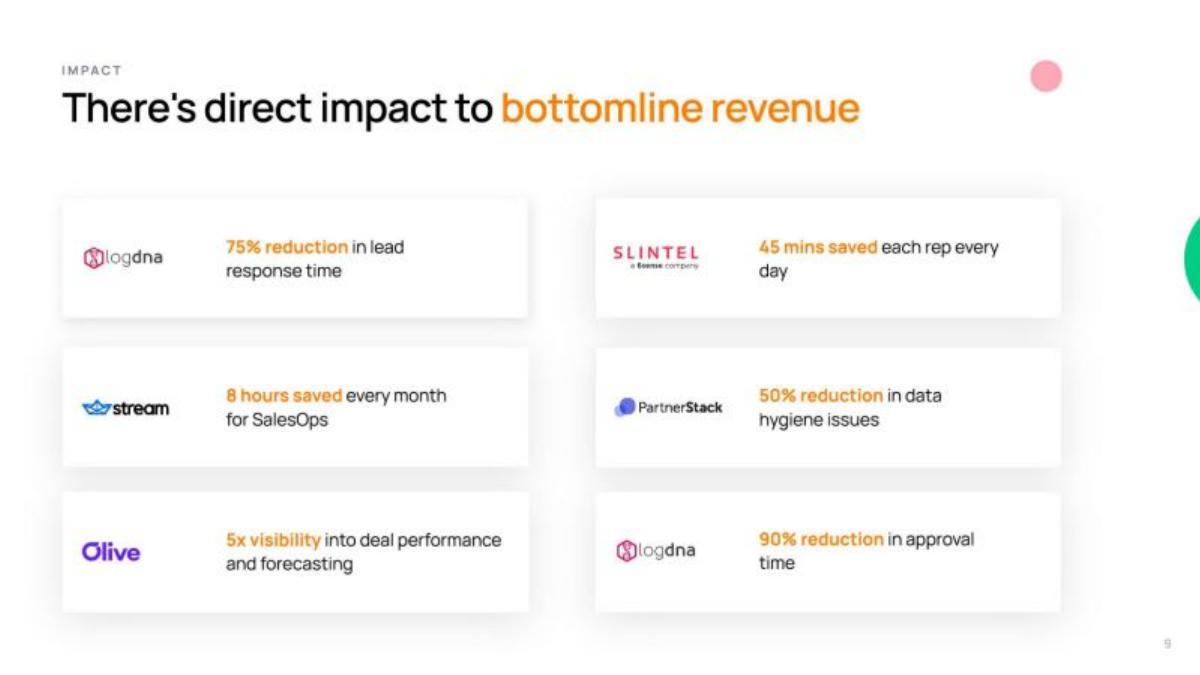
US sales-workflow software company (connects Salesforce to Slack); page 9, "IMPACT — There's direct impact to bottomline revenue", six customer tiles.
Rattle deck, slide 9. Exact stored slide matched to this analysis.
Our analysis: Named customer logos make the page credible, and the per-rep-per-day unit is the right kind for a per-seat product. But mixing units across tiles leaves the reader unable to say what a typical customer gains, and the headline promises revenue the tiles don't show. One consistent unit (hours per rep per month) across the time tiles, plus one revenue or win-rate figure, would support the headline.
Evidence and limitation: Each tile uses a different unit: per rep per day, per team per month, and percentages with no base. Our conversion: 45 minutes × 261 working days is about 196 hours per rep a year, about 9% of a 2,087-hour paid year; Stream's 8 hours a month is 96 hours a year for a whole SalesOps function. The two can't be added or compared without the number of reps. "5x visibility" is not a measurable quantity. The headline claims revenue impact, but no tile shows revenue.
What a founder can adapt: Convert the time tiles to one unit ("hours per rep per month") and add the number of reps per customer; retitle unless a tile shows revenue.
Supporting analysis
What the deck claims: LogDNA: "75% reduction in lead response time"; Slintel: "45 mins saved each rep every day"; Stream: "8 hours saved every month for SalesOps"; PartnerStack: "50% reduction in data hygiene issues"; Olive: "5x visibility into deal performance and forecasting"; LogDNA: "90% reduction in approval time".
Presentation choice: It shows why one consistent unit matters when you quote several customers.
When it does not fit: Don't title a page "impact to revenue" when every figure is time or percentages.
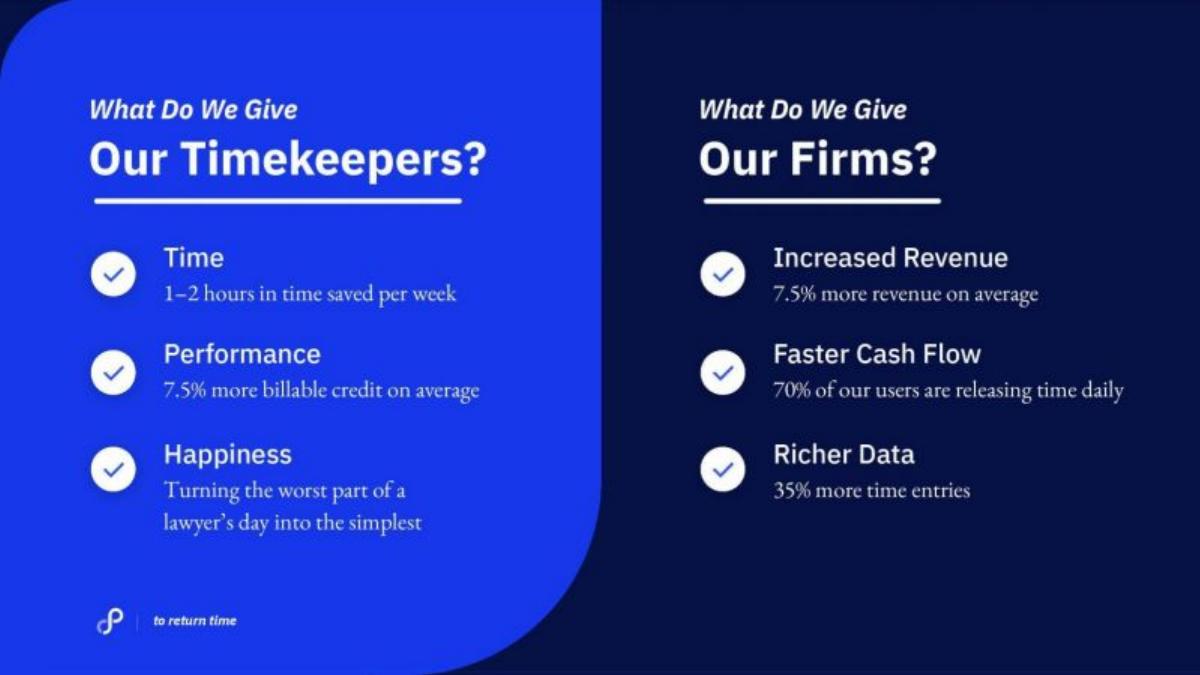
US legal time-tracking software company (automatically records lawyers' billable time); page 11, two columns. Other guides in this library use different Time by Ping pages.
Time by Ping deck, slide 11. Exact stored slide matched to this analysis.
Our analysis: The strongest kind of conversion, from time to billable revenue, which is exactly what a law firm buys. But two different effects (time saved on timekeeping, and more time captured for billing) are presented side by side without saying they are separate, and recorded time is equated with revenue. Separating the two and giving the base would make a strong claim checkable.
Evidence and limitation: Our conversion: 1–2 hours a week × 52 is about 52–104 hours a year per lawyer. For a lawyer billing, say, 1,800 hours a year (our assumption, not the deck's), 7.5% more billable credit would be about 135 hours, more than the time saved, which fits the product's claim that it captures time lawyers previously failed to record rather than only saving time. The slide doesn't say so, and the reader has to work it out. "7.5% more revenue" for firms is presented as the same figure as billable credit; recorded time becomes revenue only when it is billed and collected. Not stated: number of users, period, or how the 7.5% was measured.
What a founder can adapt: "Per lawyer: 1–2 hours a week saved on timekeeping; +7.5% billable hours recorded ([n] firms, [period], from billing data)."
Supporting analysis
What the deck claims: "What Do We Give Our Timekeepers?": "Time — 1–2 hours in time saved per week"; "Performance — 7.5% more billable credit on average"; "Happiness — Turning the worst part of a lawyer's day into the simplest". "What Do We Give Our Firms?": "Increased Revenue — 7.5% more revenue on average"; "Faster Cash Flow — 70% of our users are releasing time daily"; "Richer Data — 35% more time entries".
Presentation choice: It shows the most valuable conversion, time to revenue, and why separate effects must be labelled.
When it does not fit: Don't equate recorded time with revenue; say whether the 7.5% is billed or collected.
The four things a time-saved claim needs, and which each slide provides.
Slide
Unit
Before and after
Evidence
Conversion
Checkable?
Transcend p14
Per proposal, then total
3 → 1.5 days
One customer; count given
Capacity (60% → 10% of time)
Yes
Rattle p9
Mixed: per rep per day, per team per month, %
No
Named customers
None; revenue claimed in title
Only tile by tile
Time by Ping p11
Per lawyer per week; %
No
Averages, source unstated
Revenue (+7.5%)
Partly; effects merged
Key Takeaways
Give the unit: per user per week, per task, per project or per year. Different units can't be added or compared.
Show before and after, not only the difference. "3 days to 1.5 days" is checkable; "50% faster" alone is not.
Say how you know: product logs, customer report or your estimate, from how many users over what period.
Convert hours into what the customer values: money at a stated cost per hour, or capacity the team gains.
Check totals against the inputs. Hours × users × weeks should reproduce your yearly figure.
Don't present time saved as a cost cut unless customers actually reduce spend.
Build your time-saved line
Answer each prompt before you put a time-saved figure on a slide.
Task. Which task, done by whom? Name the role whose hours are saved.
Unit. Per task, per user per week, per project or per customer per year? Match it to how you charge.
Before and after. How long did the task take before, and how long with your product? Which figure is measured and which reported?
Evidence. Product logs, customer report or your estimate? How many users or customers, over what period?
Scale-up. If you give a yearly total, what volume and working-year produce it? Does the multiplication reproduce your figure?
Conversion. Money (hours × which cost per hour) or capacity (share of a role, more output)? What does the customer actually do with the time?
Copyable framework: [n] customers, [period]: [task] [before] ([source]) → [after] ([source]); at [volume] a [month/year], about [hours] hours, [capacity or $ at rate] vs [your price].
Illustrative example 1 — written by us
Before: With 200+ proposals run to date, it's 300 days of engineering time saved.
After: [Customer type], [n] months: 200+ budgetary proposals, 3 days each before ([measured/recalled]) → 1.5 days in the tool = 300+ engineering days, about 2,400 hours. Proposal work fell from 60% to 10% of a [n]-engineer team's time.
What improved: Built from Transcend's page 14. The 2,400 hours assume 8-hour days; the period, team size and evidence label are placeholders the slide does not give.
Illustrative example 2 — written by us
Before: 45 mins saved each rep every day. 8 hours saved every month for SalesOps.
After: Slintel: about 16 hours per rep per month ([n] reps). Stream: 8 hours per month for the SalesOps team ([n] people).
What improved: Built from Rattle's page 9. The 16 hours assume about 21–22 working days a month; the headcounts are placeholders.
Why investors discount "hours saved"
A time saving is a difference between two durations, and the "before" figure is often an estimate or a memory. Customers asked how long something used to take tend to give round numbers, and a vendor choosing which customer to quote will pick its best result. That doesn't make a claim false; it makes the reader ask how it was produced.
The second reason is conversion. A saved hour is only worth money if someone pays less or earns more because of it. A sales rep who saves 45 minutes a day costs the same salary; the gain is the extra selling time, which may or may not produce revenue. Investors know this, so a slide that jumps from hours to dollars without saying how reads as overstated.
This guide is about presenting time-saved claims honestly. It is not legal, employment or investment advice.
Choose a unit a reader can scale
The same product can be described as saving 45 minutes per rep per day, about 196 hours per rep per year, or several thousand hours for a large customer. All three can be true at once. What matters is that the unit lets an investor connect the claim to your price and your market: if you charge per seat, give the saving per seat per month; if you charge per project, per project; if you sell an enterprise licence, per customer per year with the number of users.
Per-task units are the most credible because they can be measured directly: the task took this long before and this long after. Yearly totals are the most impressive but depend on volume assumptions. A strong slide shows the per-task figure and the multiplication that produces the total, the way Transcend does.
When you convert to a year, say which working-year you use. The US Office of Personnel Management computes federal hourly pay rates by dividing annual pay by 2,087 hours, the long-run average of paid working hours in a calendar year; that figure includes paid leave, so actual working hours are lower. Any reasonable divisor is fine if you name it. (US Office of Personnel Management)
Show the before and the after
"Reduced time by 60%" tells a reader the ratio but not the size: 60% of ten minutes and 60% of ten days are very different products. A before-and-after pair ("3 days to 1.5 days") gives both the ratio and the absolute saving, and it is harder to inflate because each figure can be questioned on its own.
When the before figure is an estimate, say so. "Customer-reported: about 3 days per proposal before; 1.5 days measured in the tool across 200+ proposals" is more credible than a single percentage, because the reader can see which half is soft.
Say how you know
Time-saved figures come from three places. Product logs measure how long a task takes in your tool, which is precise for the after but says nothing about the before. Customer reports, from a survey, interview or case study, cover both but are approximate. Your own estimates, from a time-and-motion study or a demo, are a starting point before you have customers. All three are acceptable on a slide if the label says which.
Also say how many. A figure from one champion customer is a case study; a median across forty accounts is evidence about the product. If you have only one, present it as a case study, with the customer's name if you can use it.
Convert time into money or capacity, and say which
There are two honest conversions. Money: hours saved × a cost per hour the customer recognises (a loaded salary cost, or the billing rate for billable staff), giving a figure to set against your price. Capacity: hours saved as a share of a person's or team's time, or as more output from the same team ("proposals per engineer per month up from 8 to 16"). Capacity is often the more truthful framing, because customers rarely reduce headcount when a task gets faster; they do more of it or move people to other work.
For billable professions, saved time can become revenue directly, which is why Time by Ping's page pairs time saved with billable credit. That is the strongest kind of conversion, but it needs its own evidence: billed revenue before and after, not only time recorded.
Whichever you choose, show the rate. "$25,000 a year saved" with no hours, no rate and no number of users can't be checked; "420 hours a year × $60 loaded cost = $25,200, against a $9,000 subscription" can.
Before you have customer data
Early-stage founders often have no customer logs yet, only a demo or a pilot. A time-saved claim is still useful then, as long as the slide says what it rests on. The honest options, from weakest to strongest, are: your own estimate from timing the old process and the new one yourself; a timed test with a few prospective users doing the same task both ways; and a pilot where you record the time in your product and ask the customer how long it took before.
Label each one plainly. "In a timed test with 6 accounts-payable clerks, matching 50 invoices took 95 minutes by hand and 30 minutes in the product" is a small sample, but a reader knows exactly what it is and can ask for more. "Saves hours every week" with no source reads as a guess, even when it is true.
Then say what would make the number stronger and when you will have it: "first 10 paying customers live by [month]; median from product logs to follow." Investors don't expect a pre-revenue company to have audited time studies. They do expect the founder to know the difference between a test and evidence.
Questions investors ask about a time-saved claim
Expect these questions, and answer them on the slide or in the appendix. Whose time is it: the user's, their manager's, or a team that does the task once a quarter? How often is the task done: daily tasks multiply into large yearly totals, rare ones don't. Is the saving still there after the first month, when the novelty has gone and users have found workarounds? And does the customer's budget owner care: a saving that matters to a frontline user may not move the person who signs the contract.
Check also that the time saved is consistent with your price. If you claim to save a user ten hours a week and charge $20 a month per seat, an investor will wonder why you don't charge more, or whether the ten hours are real. If you claim one hour a month and charge $500 a seat, they will wonder why anyone buys. A short line connecting the two ("about 16 hours per rep per month, against a $40 seat price") shows you have thought about it.
Finally, keep the figure the same everywhere. If the solution slide says 45 minutes a day, the case study, the ROI calculator and the sales materials should say the same, or say why they differ.
Worked example: one claim, shown both ways (hypothetical)
This is our illustration, not a figure from any deck. A startup automates insurance claim intake. Across 12 customers over six months, product logs show an intake taking a median of 14 minutes in the tool. Customers reported that the same intake took about 40 minutes before. Each customer processes a median of 1,800 intakes a month.
Saving per intake: 40 − 14 = 26 minutes. Per customer per month: 26 × 1,800 = 46,800 minutes, or 780 hours. At 2,087 paid hours a year (about 174 a month), that is about 4.5 full-time staff's worth of capacity. At a loaded cost of $45 an hour, about $35,100 a month, against a subscription of $6,000 a month.
Weak version: "Save 65% of intake time. Thousands of hours a year." Strong version: "12 customers, 6 months: intake 40 min (customer-reported) → 14 min (product logs). At a median 1,800 intakes a month, about 780 hours a month, roughly 4.5 FTE of capacity; about $35,000 a month at $45/hour vs a $6,000 subscription."
Common mistakes
No unit. "Thousands of hours" without per what can't be scaled or compared.
Percentage without a base. "50% faster" needs the before or after duration.
Mixed units across customers. Per rep per day and per team per month can't be added; normalise them.
Unlabelled evidence. Say whether figures are measured, customer-reported or estimated, and from how many.
Hours to dollars with no rate. Show the cost per hour and the number of users behind any money figure.
Time saved as a cost cut. Customers rarely reduce staff; say if the gain is capacity or revenue instead.
Diagnostic checklist
The task and the role whose time is saved are named.
The unit matches how you charge: per seat, per task, per project or per customer.
Before and after durations are both shown.
The evidence type, number of customers and period are stated.
Any yearly total can be reproduced from the per-task figure, volume and working-year.
Money conversions show the cost per hour; capacity conversions show the team size or output.
A revenue claim is backed by revenue data, not time recorded.
Frequently asked questions
How do I calculate time saved for a pitch deck?
Measure or ask how long one task took before and how long it takes with your product, multiply the difference by the number of times the task is done in a period, and state the source of each figure. Show the per-task figure and the total, so investors can check the multiplication.
Should I convert hours saved into dollars?
Yes, if you show the cost per hour and the number of users, and say whether the customer actually saves the money. Often it is more honest to present the gain as capacity (more work from the same team), because few customers cut staff when a task gets faster.
How many working hours are in a year?
It depends on the convention. The US Office of Personnel Management divides annual pay by 2,087 hours, the long-run average of paid working hours in a calendar year, which includes paid leave. Name the figure you use. (US Office of Personnel Management)
Is a customer-reported time saving acceptable?
Yes, labelled as customer-reported, with the customer named if possible. Pair it with product-log data for the after figure when you have it, and replace single-customer quotes with a median across customers as soon as you can.
How we chose these examples
Discovery (2026-10-04, run 59): we picked construction, an industry with many decks in the collection and no dedicated guides, and read construction-tech decks (Gearflow, Trunk Tools, Mosaic, Briq, Versatile, cove.tool, Krane, Scalera AI, Bridge Software and one deck now held under the source rule). A per-project time-saved claim in one of them led to a corpus search for time-saved claims, which returned 27 pages. Closest content read: the live customer-results case study guide (baselines and ROI multiples for outcome claims; no time-saved figures), the live time-to-value guide (how fast a customer gets value after buying, a different measure), the live value-proposition guide, the value-to-price walkthrough, and the energy-savings draft (baseline and scope for energy claims). None teaches the unit, base, evidence and conversion of a time-saved claim. A previous screen rejected a narrower topic (time saved × hourly rate) because only one deck showed a full calculation.
Three pages from three decks were read from images rendered from the original deck files: Transcend 14, Time by Ping 11 and Rattle 9. All are published teardowns and none matches a deletion request. The images were prepared at 1200px wide and uploaded through the standing slide-image workflow. Repair (2026-10-07, v2): the Daylight and Digs examples, and every figure taken from them, were removed because those decks are held under the whole-deck source rule; every page of the three remaining decks was reviewed visually and its top and bottom edges were read by text recognition at double size; none carries a confidentiality or distribution notice.
Figures were recalculated from the printed inputs; conversions use 2,087 paid hours a year, 261 working days and 8-hour days where stated; the timed-test example in "Before you have customer data" is invented. The 1,800 billable hours in the Time by Ping example and the whole worked example are our assumptions. Company figures are reported as printed and not verified. This guide explains presentation, not legal, employment or investment advice. Slide readings and analysis are an AI editorial model review, not human-checked.