How to Prove Customers Are Switching From Incumbents
How startups show that customers are leaving established vendors for them: win-rate tables, named switching logos, displacement case studies.
How to Prove Customers Are Switching From Incumbents on a Pitch Deck
Six slides from real pitch decks that make one argument: customers are leaving established vendors and choosing this company instead. For each, we record what form the switching evidence takes — a win-rate table, the names of the vendors customers abandon, a displacement case study, a customer's own measured result, or a quote that names the incumbent — and what an investor can check in each.
TL;DR
Claiming that customers are switching is not traction. Naming who they switch from, how often you win when you go head-to-head, and what the switcher got is. Five formats appear in real decks, in rising order of checkability: a bare claim (Brex: "easy to switch to, and hard to switch from"); a logo wall of the vendors customers are leaving (Amplitude: Mixpanel, Localytics and Omniture); structured displacement case studies (Awake Security against RSA NetWitness, Darktrace and Cisco StealthWatch); a named customer's measured outcome (Honeycomb: Vanguard "reduced TCO by displacing Splunk and AppDynamics"); and quotes that name the incumbent (Lago: "Lago vs Stripe Billing", "Lago vs Chargebee"). The most complete form is Rippling's win-rate table: win rates per incumbent, with the sales stages defined, the data source named, and its own flaws disclosed.
Two things separate a switching slide that works from one that does not. First, specificity: name the incumbent, or at least the category and stage where you displace them, instead of asserting "customers are switching". Second, honesty about the number: Rippling anonymises competitors but defines its win-rate stages and warns that its own Salesforce data is "likely imperfect"; Awake Security redacts client details but keeps the structure an investor needs — industry, size band, deployment, use cases, why it won, and the deal size in figures. Both show you can be specific without breaking confidentiality.
Customer-switching evidence from real pitch decks
Each example shows the exact stored slide beside its analysis and links to the full teardown. Figures are the companies' own claims unless marked as our calculation. Stage and year are given only where the slide states them.
Rippling traction slide — slide 10
HR, IT and spend platform raising a Series F. The slide is part of a competition narrative and shows the page number 10.
Rippling deck, slide 10. Exact stored slide matched to this analysis.
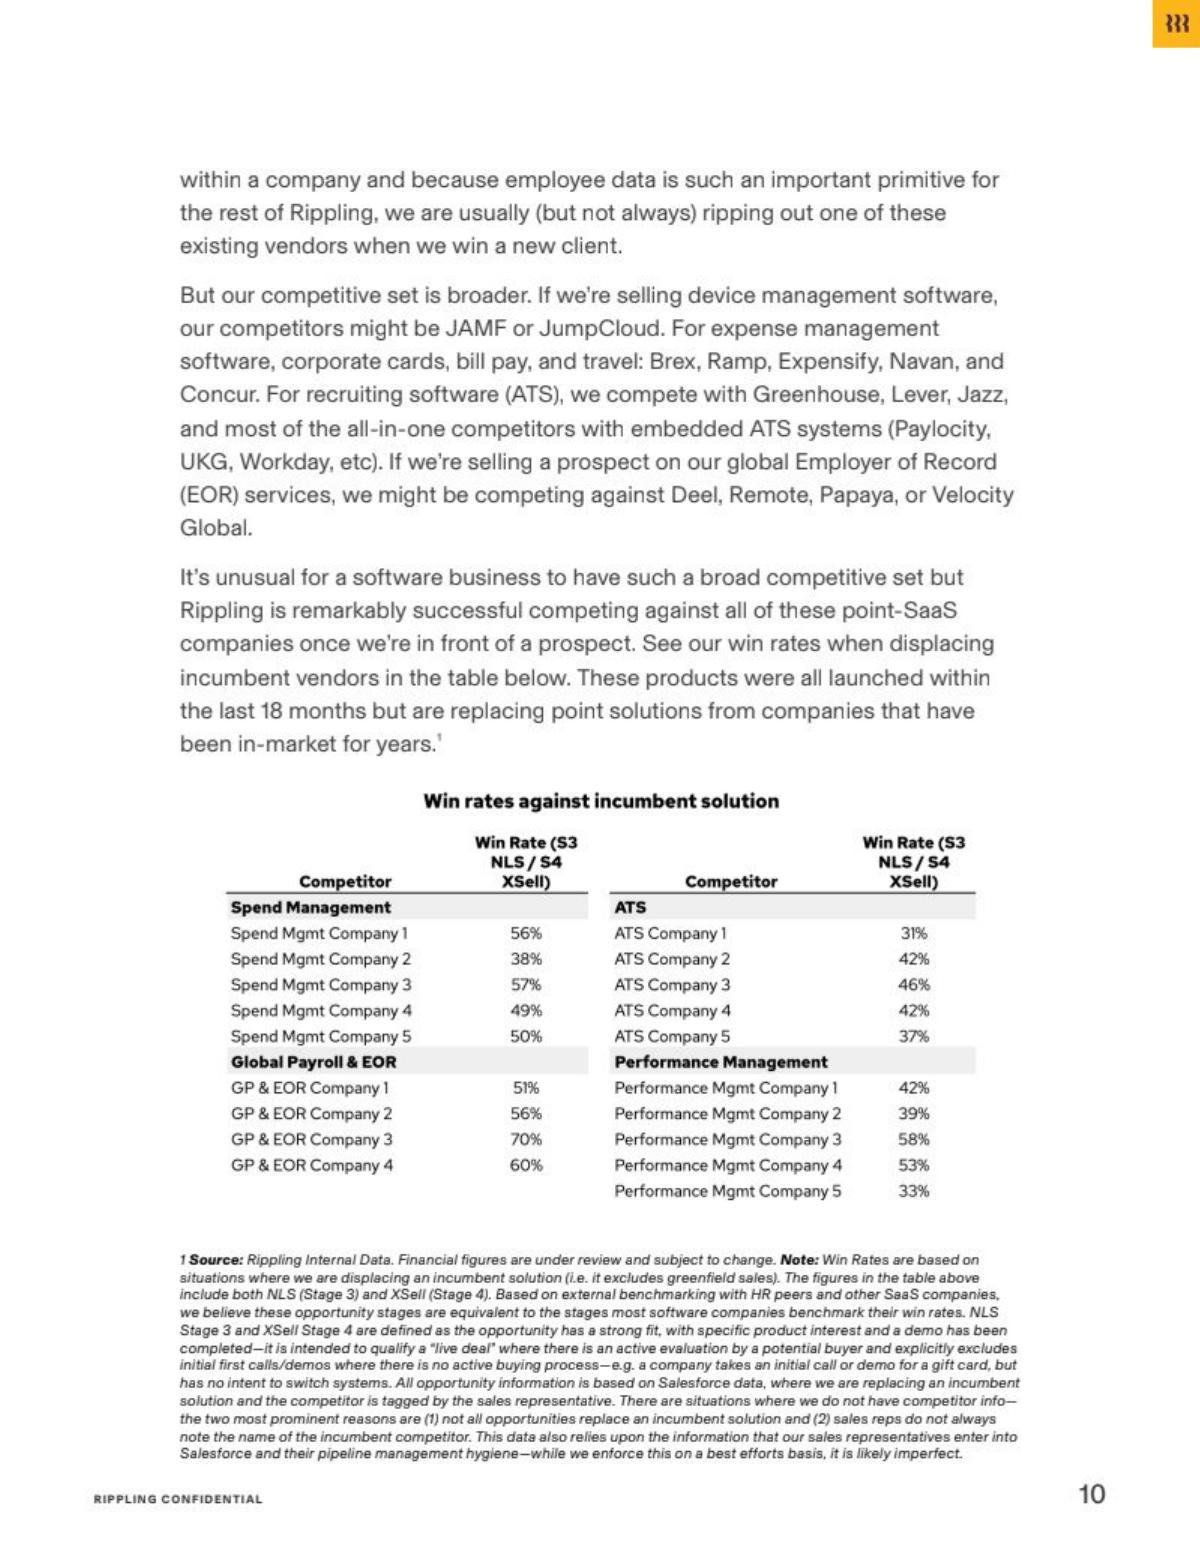
Our analysis: The table claims systematic displacement, not a one-off win: five anonymised incumbents per category and rates above a coin flip in most rows. Anonymity plus stage definitions plus the data-quality warning is a deliberate trade — the reader cannot verify any single number, but the counting method is inspectable and the caveats are the company's own.
Evidence and limitation: No raw win or loss counts are given, so rates cannot be recomputed. Our calculation: across the four categories the printed rates run from 31% (an ATS incumbent) to 70% (a payroll and EOR incumbent); the median printed rate is 50%.
What a founder can adapt: Publish your win rate per incumbent or category, with the stage definition and data source, and name what the data misses.
Supporting analysis
What the deck claims: Text states the company is "usually (but not always) ripping out one of these existing vendors when we win a new client", that these products "were all launched within the last 18 months but are replacing point solutions from companies that have been in-market for years", and invites the reader to "see our win rates when displacing incumbent vendors in the table below". Table: "Win rates against incumbent solution", two columns per block — Competitor, "Win Rate (S3 NLS / S4 XSell)". Spend Management: 56%, 38%, 57%, 49%, 50%. Global Payroll & EOR: 51%, 56%, 70%, 60%. ATS: 31%, 42%, 46%, 42%, 37%. Performance Management: 42%, 39%, 58%, 53%, 33%. Competitors are anonymised ("Spend Mgmt Company 1" and so on). Footnote: "Source: Rippling Internal Data. Financial figures are under review and subject to change." Win rates "are based on situations where we are displacing an incumbent solution (i.e. it excludes greenfield sales)"; NLS Stage 3 and XSell Stage 4 are "the opportunity has a strong fit, with specific product interest and a demo has been completed"; the data relies on what sales representatives enter in Salesforce and "is likely imperfect".
Presentation choice: It is the only slide in this set that quantifies head-to-head displacement and discloses how the number was produced.
When it does not fit: Don't quote a head-to-head win rate without saying which situations were counted.
Product analytics platform raising a Series C. The slide header reads "Traction continued"; the slide footer shows 19 (the PDF page is 28).
Amplitude deck, slide 28. Exact stored slide matched to this analysis.
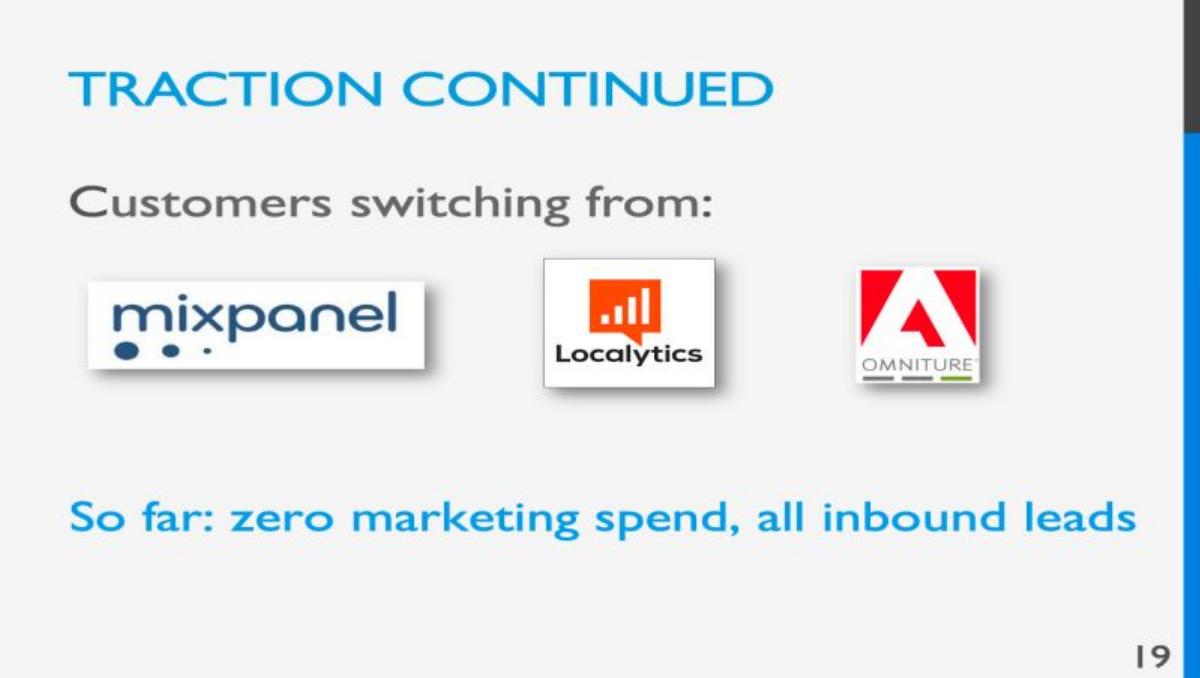
Our analysis: The vendor names carry the whole claim: the reader is expected to know these incumbents, and the logos imply customers are migrating from each. The zero-marketing-spend line adds a growth-quality argument — switching happened inbound, not bought. What is missing is scale: one logo could stand for one customer.
Evidence and limitation: No customer counts, no switching dates, no revenue attached to the switchers.
What a founder can adapt: Pair the logo wall with a count — customers, logos won, or revenue switched — so the reader can size the migration.
Supporting analysis
What the deck claims: "Customers switching from:" above three vendor logos: Mixpanel, Localytics, Omniture. Below: "So far: zero marketing spend, all inbound leads".
Presentation choice: It names the incumbents customers leave, which a generic "displacing incumbents" claim never does.
When it does not fit: Don't show logos of vendors customers left without any number attached.
Network detection and response company raising a Series C (2020). The slide is one of three displacement case studies; the slide footer shows 13 (the PDF page is 14).
Awake Security deck, slide 14. Exact stored slide matched to this analysis.
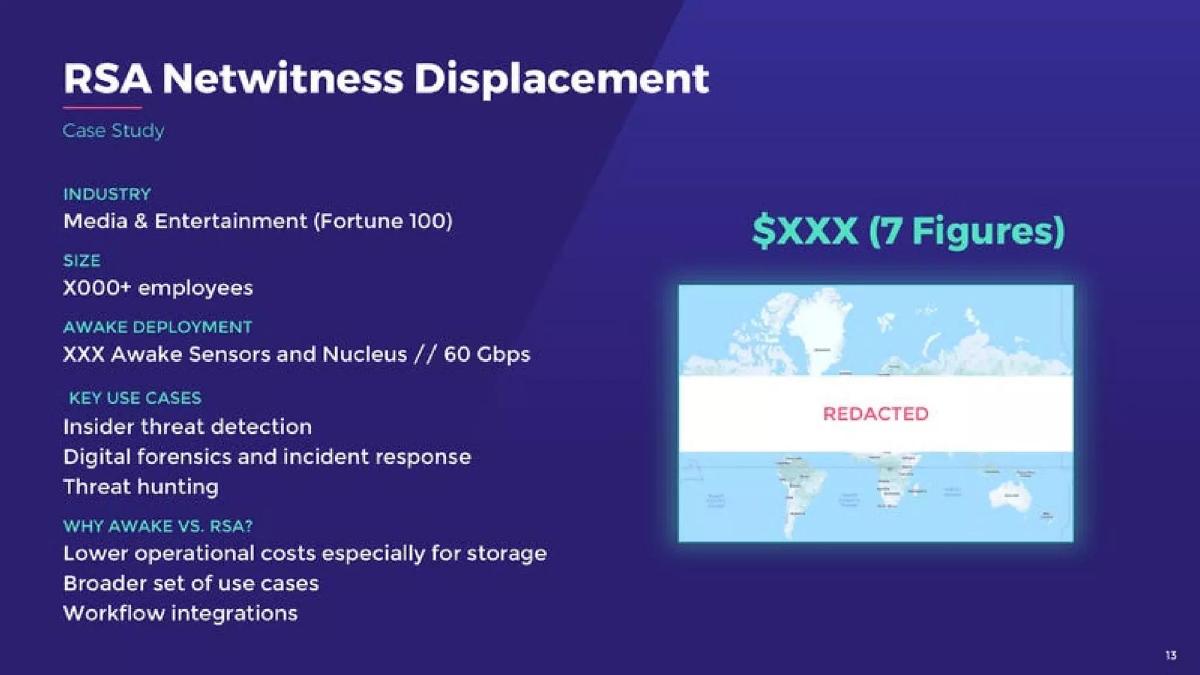
Our analysis: The fixed structure — industry, size band, deployment, use cases, why it beat the incumbent, deal size — is reference-call diligence printed on a slide, with confidentiality handled by redaction rather than omission. The two companion slides repeat the format for Darktrace (high tech, ten locations, "High 6 Figures") and Cisco StealthWatch (finance, GDPR and PCI use cases, "6 Figures"), turning one win into a pattern.
Evidence and limitation: The competitor is named; the customer is deliberately not. Employee count, sensor count and map detail are redacted to "X" marks, while 60 Gbps and the deal-size band are kept.
What a founder can adapt: Repeat one case-study structure per displaced incumbent, keeping industry, deployment, use cases and a deal-size band.
Supporting analysis
What the deck claims: "RSA Netwitness Displacement — Case Study". Industry: Media & Entertainment (Fortune 100). Size: "X000+ employees". Awake deployment: "XXX Awake Sensors and Nucleus // 60 Gbps". Key use cases: insider threat detection, digital forensics and incident response, threat hunting. "Why Awake vs. RSA?": "Lower operational costs especially for storage", "Broader set of use cases", "Workflow integrations". Deal size: "$XXX (7 Figures)". A customer map is labelled REDACTED.
Presentation choice: It shows how to keep displacement evidence specific while redacting the customer.
When it does not fit: Don't redact so much that industry, scale or the reason you won disappear.
Observability platform raising a Series D (2023). A customer-results slide for Vanguard; the slide footer shows 10.
Honeycomb deck, slide 10. Exact stored slide matched to this analysis.
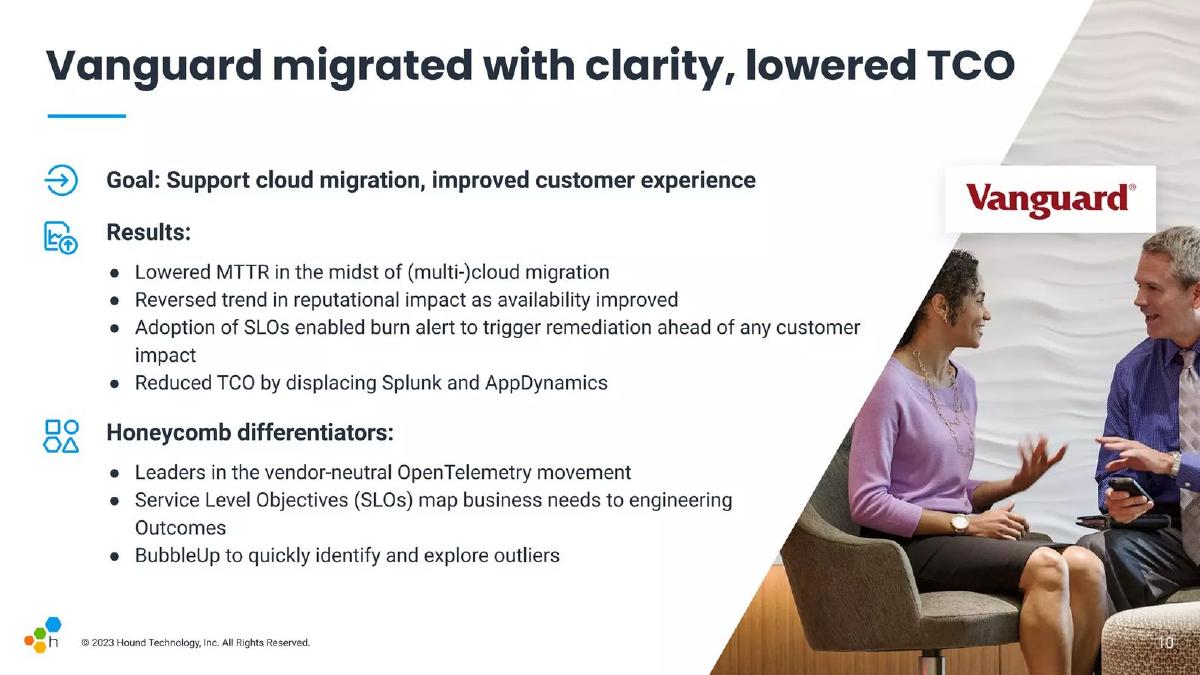
Our analysis: Displacement appears as the customer's own outcome: Vanguard reduced total cost of ownership by removing Splunk and AppDynamics. Framed that way, the switch is evidence about the incumbent's cost, not a vendor boast — but without the figure, the reader takes the result on trust.
Evidence and limitation: The TCO reduction carries no percentage or dollar figure, and the time period is not stated. The other three results are directional rather than measured.
What a founder can adapt: Quote the customer's outcome and state its size — the percentage or dollar saving — and the period it covers.
Supporting analysis
What the deck claims: "Vanguard migrated with clarity, lowered TCO". Goal: "Support cloud migration, improved customer experience". Results: "Lowered MTTR in the midst of (multi-)cloud migration"; "Reversed trend in reputational impact as availability improved"; "Adoption of SLOs enabled burn alert to trigger remediation ahead of any customer impact"; "Reduced TCO by displacing Splunk and AppDynamics". Honeycomb differentiators: leadership in the vendor-neutral OpenTelemetry movement, Service Level Objectives mapping business needs to engineering outcomes, and BubbleUp to identify and explore outliers.
Presentation choice: It puts the switching outcome in the customer's words with a goal-results structure.
When it does not fit: Don't report a customer's cost saving without the number behind it.
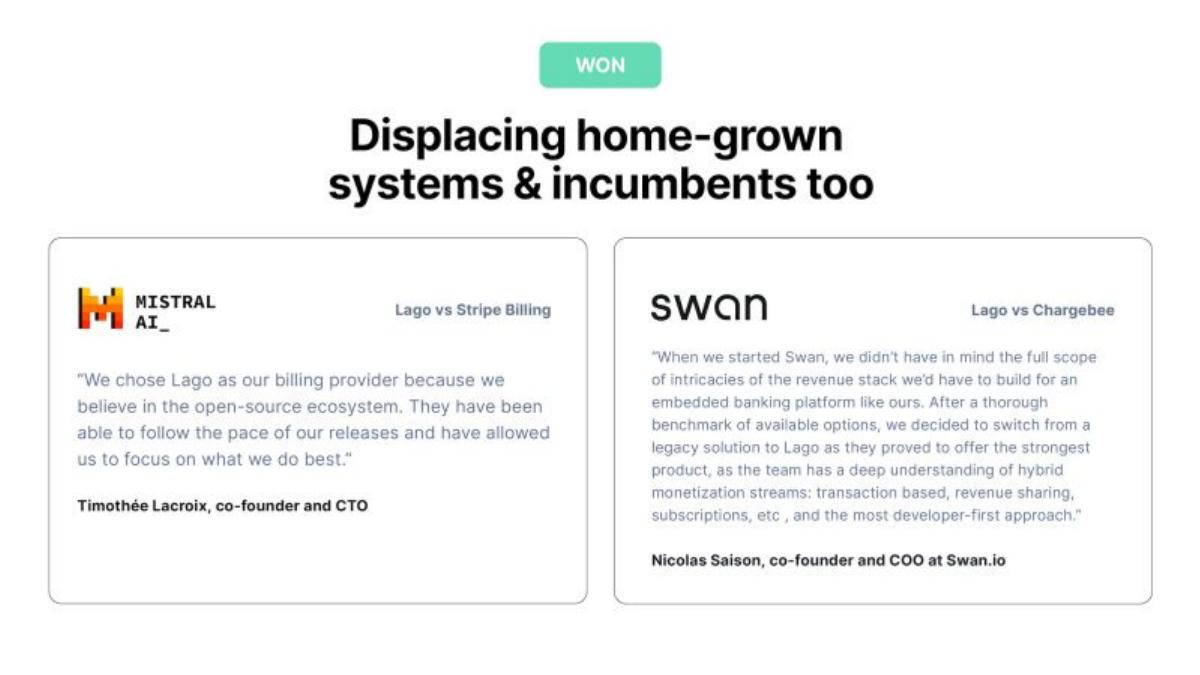
Open-source billing platform raising a Series A. A social-proof slide badged "WON"; no slide number is printed.
Lago deck, slide 13. Exact stored slide matched to this analysis.
Our analysis: Letting the customer name the incumbent shifts the claim from vendor to buyer — and Swan's "decided to switch" is explicit switching language. The heading's "vs Stripe Billing" does more work than the Mistral quote itself, which describes choosing Lago rather than leaving Stripe; the pairing is persuasive, not measured.
Evidence and limitation: The incumbent names sit in the card headings; the quotes give reasons (release pace, developer experience, benchmarking) but no costs, volumes or dates.
What a founder can adapt: Head each quote card with the matchup (you vs the incumbent) and let the quote carry the reason for switching.
Supporting analysis
What the deck claims: "Displacing home-grown systems & incumbents too". Two customer-quote cards: Mistral AI, headed "Lago vs Stripe Billing", quoting Timothée Lacroix, co-founder and CTO: "We chose Lago as our billing provider because we believe in the open-source ecosystem. They have been able to follow the pace of our releases and have allowed us to focus on what we do best." Swan, headed "Lago vs Chargebee", quoting Nicolas Saison, co-founder and COO at Swan.io: "After a thorough benchmark of available options, we decided to switch from a legacy solution to Lago as they proved to offer the strongest product, as the team has a deep understanding of hybrid monetization streams: transaction based, revenue sharing, subscriptions, etc., and the most developer-first approach."
Presentation choice: It shows the incumbent named in the customer's own voice, with the matchup in the heading.
When it does not fit: Don't write a "vs" heading the quote itself never supports.
Corporate card and spend platform raising a Series B. A claims slide in the go-to-market story; the source deck PDF is not in the stored set, so the exact image is recorded as blocked and no substitute is used.
Verified source excerpt — slide 9
"It's Easy to Switch To, and Hard to Switch From" — "We Have Features That Are Retaining Existing Customers As They Scale and Converting Large, Complex Enterprise Organizations".
The exact traction image is not present in the stored slide-image set. No substitute is used.
Our analysis: The slide asserts both sides of switching — customers can leave their bank easily, and Brex customers will not leave it — as product design claims. As switching evidence it is the weakest format in this set: the sentence would survive unchanged for any spend platform. It works only as a header for evidence shown elsewhere in the deck.
Evidence and limitation: No incumbent named, no customer, no win rate, no switching count or example.
What a founder can adapt: If you make this claim, follow it with at least one named incumbent, customer or count — the formats above.
Supporting analysis
What the deck claims: "It's Easy to Switch To, and Hard to Switch From" — "We Have Features That Are Retaining Existing Customers As They Scale and Converting Large, Complex Enterprise Organizations".
Presentation choice: It marks the floor of the evidence ladder: switching language with nothing checkable.
When it does not fit: Don't rely on "easy to switch" language as if it were traction.
Columns report what each slide states; the check column notes what a reader can and cannot verify.
Example
Incumbent named
Count or rate
Customer identifiable
Measured outcome
What a reader can check
Rippling
No (anonymised)
Yes, win rates 31–70%
No
Win rate per stage
The counting method, not each row
Amplitude
Yes, three logos
No
No
No
Which vendors customers left
Awake Security
Yes, per case study
Deal-size band
No (redacted)
Deployment and deal size
Industry, scale, why it won
Honeycomb
Yes, two products
No
Yes, Vanguard
TCO reduction, unquantified
That the switcher reports a result
Lago
Yes, in headings
No
Yes, quoted founders
No
Who switched and their reasons
Brex
No
No
No
No
Nothing — claim only
Key Takeaways
Say who customers switch from. Amplitude puts the Mixpanel, Localytics and Omniture logos under "Customers switching from:" — the vendor names are the claim.
Quantify head-to-head wins. Rippling shows win rates from 31% to 70% against anonymised incumbents, per product category.
Define the measurement. Rippling's footnote says win rates exclude greenfield sales, define the sales stages, name the data source and admit the data is "likely imperfect".
Structure displacement stories. Each Awake Security case study gives industry, employee band, deployment, use cases, why it beat the incumbent, and the deal size in figures.
Let the customer state the result. Honeycomb's Vanguard slide reports "reduced TCO by displacing Splunk and AppDynamics" as the customer's measured outcome.
A switching claim without a name, a number or a story is a slogan. Brex's "easy to switch to, and hard to switch from" carries none of the three.
Build your switching-evidence slide
Answer each prompt in one line with a number or a name where possible.
Incumbents. Which vendors, products or systems are your customers leaving — by name or category?
Head-to-head. Of the deals where you faced an incumbent last quarter, how many did you win, and at which stage is this counted?
Switchers. How many customers migrated from an incumbent, and what revenue moved with them?
Outcome. What did a named switcher get — cost saved, time saved, coverage gained — in figures?
Confidentiality. Which fields must stay redacted, and which stay (industry, size band, deployment, deal-size band)?
Copyable framework: Customers switch from [incumbents]; we win [x]% of head-to-head deals at [stage] (counted since [when], excluding greenfield); [n] customers have switched, including [reference customer], who [measured outcome].
Illustrative example 1 — written by us
Before: It's easy to switch to, and hard to switch from.
After: We win 6 of 11 head-to-head deals against [incumbent] at the demo stage since January (excludes greenfield); [reference customer] cut [cost] by [x]% after switching.
What improved: Illustrative template for Brex's line; bracketed values are for the company to supply.
Why "we're displacing incumbents" needs evidence
Almost every competitive slide argues that the company is better than the alternative. A switching slide makes a stronger and different claim: this is not a greenfield market where buyers have no existing vendor — customers already pay someone else, and they are moving. That claim is worth more than a feature comparison precisely because switching is expensive: buyers must migrate data, retrain teams and drop a contract. If you can show it happening, you have proved both demand and your ability to take business from an entrenched vendor.
The failure mode is asserting the switch without showing it. "Easy to switch to, and hard to switch from" (Brex) is a design intention, not an event. Investors read it as a claim the deck will not substantiate unless a later slide carries the evidence. The guides on the competition slide cover how to position against rivals; this guide is about the traction version — proof that displacement is already happening.
The evidence formats below are not mutually exclusive. A strong deck can pair a quantified table (Rippling) with a named customer story (Honeycomb), or a logo wall (Amplitude) with quotes that name the incumbent (Lago). What they share is a named counterparty: an incumbent product, an industry, a customer, or a measured outcome.
The five evidence formats, strongest first
A win-rate table (Rippling) is the most checkable form. Rippling lists, per product category, a win rate against each anonymised incumbent — spend management between 38% and 57%, global payroll and employer-of-record between 51% and 70%, applicant tracking between 31% and 46%, performance management between 33% and 58% — and states that these products launched within the last 18 months while replacing point solutions that have been in-market for years. The footnote does the credibility work: wins are counted only where an incumbent is being displaced (greenfield sales excluded), the stages are defined, the source is internal Salesforce data, and the company admits the data "is likely imperfect".
A switching logo wall (Amplitude) trades precision for immediacy. Under "Customers switching from:", three named vendors appear — Mixpanel, Localytics, Omniture — with the cost-side claim "So far: zero marketing spend, all inbound leads". It does not say how many customers switched or when, so it is weaker evidence than a table; it works because the vendors are named and recognisable.
Displacement case studies (Awake Security) repeat a fixed structure three times in the deck, once per displaced vendor: RSA NetWitness (media and entertainment, Fortune 100, 60 Gbps of monitored traffic, deal size seven figures), Darktrace (high tech, ten locations, deal size high six figures) and Cisco StealthWatch (finance, two locations, GDPR and PCI compliance use cases, deal size six figures). Client details are redacted, but industry, employee band, deployment, use cases, the reasons it won and the deal-size band are all kept.
A customer-outcome story (Honeycomb) makes the switch the customer's own reported result. Vanguard's slide states the goal (support cloud migration, improved customer experience) and four results, ending with "Reduced TCO by displacing Splunk and AppDynamics". Because the sentence is the customer's outcome, not the vendor's claim, it reads as evidence rather than marketing.
Quotes that name the incumbent (Lago) put the switch in the customer's voice. Two cards, badged "WON", are titled "Lago vs Stripe Billing" (Mistral AI) and "Lago vs Chargebee" (Swan); Swan's quote says it "decided to switch from a legacy solution to Lago" after benchmarking options. The incumbent names sit in the headings, and the reasons are the customer's own.
What each format lets an investor check — and what it hides
Rippling's table survives diligence questions that kill weaker slides: which competitors, at which stage, counted how? Its disclosure also shows what anonymising costs — a reader cannot verify a single number — and what it preserves: the distribution, the category structure and the counting method. Awake's case studies make the opposite trade: the client is unidentifiable, but each story carries the fields an investor would ask for in a reference call, and the deal-size bands give a scale without exposing the client.
The weaker formats hide more. Amplitude's wall names vendors but not counts, so a reader cannot tell whether three customers or three hundred switched. Honeycomb's slide states the TCO result but not its size; Lago's quotes name incumbents but the Swan quote's "legacy solution" is deliberately vague beside the heading's "Chargebee". None of these is dishonest — each is one step on a ladder from slogan to proof, and the deck is stronger when the next step exists elsewhere in the document.
For founders: pick the strongest format your data honestly supports. If you track head-to-head outcomes, publish the table with your counting method and its flaws, as Rippling does. If you have named reference customers, use the customer-outcome format (Honeycomb) or quotes that name the incumbent (Lago). If confidentiality prevents naming, use Awake's structured case-study format — redact the client, keep the fields. If you have none of these, do not claim switching at all; a design intention like Brex's reads as a promise an investor will test.
Common mistakes
Switching without a counterparty. Name the vendor, industry or system customers leave.
A rate without a method. Say which deals were counted, at which stage, and what was excluded.
Logos without scale. A switching wall needs at least a customer count.
Unquantified outcomes. "Reduced TCO" needs the percentage or dollar figure.
Redaction that erases the story. Keep industry, scale and reason even when the client is hidden.
A "vs" heading the quote doesn't support. Match the matchup in the heading to the words in the quote.
Diagnostic checklist
The slide names who customers switch from.
Head-to-head wins carry a rate or count with the counting method.
At least one switcher is identifiable, or the case-study fields survive redaction.
The switcher's outcome is stated in figures.
Confidentiality is handled by redaction, not by deleting the evidence.
No switching claim on the slide rests on language alone.
Frequently asked questions
How do I show that customers are switching from incumbents in a pitch deck?
Pick the strongest format your data supports: a head-to-head win-rate table with the counting method (Rippling), a logo wall of the vendors customers leave (Amplitude), structured displacement case studies (Awake Security), a named customer's measured outcome (Honeycomb), or quotes that name the incumbent (Lago).
Can I show win rates against competitors without naming them?
Yes. Rippling anonymises competitors to "Company 1, Company 2" and keeps credibility by defining the sales stages counted, excluding greenfield sales, naming the data source and warning that the data is imperfect.
How do I show displacement wins when my customers are confidential?
Use Awake Security's case-study format: keep industry, employee band, deployment, use cases, why you won and a deal-size band, and redact the customer's name and identity details.
Is a "customers are switching from" logo wall enough on its own?
It names the incumbents, which a bare claim does not, but it gives no scale. Pair it with a customer count, revenue switched or a win rate so the reader can size the migration.
What is the weakest way to claim switching?
Language alone. Brex's "easy to switch to, and hard to switch from" names no incumbent, customer or number; treat it as a header for evidence shown elsewhere, not as traction.
How we chose these examples
Search (2026-10-01): the durable corpus index (70,729 unique pages, deduplicated by deck-file sha256 + page) was searched for switching, switching from, displacement, displacing, win rate, win rates, ripping out, easy to switch and hard to switch (about 40 index hits; win rate alone returned 12, mostly sales-tool claims). Listed-company, SPAC, mining, energy-utility and cannabis-producer investor-relations decks were excluded. Earlier searches for refunds and returns, win rate alone, seasonality, pilot length and success criteria, and customer concentration did not yield a distinct switching-evidence guide; customer concentration is covered by the deal-size guide and replacement positioning by the SaaS competition guide.
Eight candidate pages were rendered from the original public deck files and read from the images; six slides are used: Rippling 10, Amplitude 28, Awake Security 14, 17 and 18, Honeycomb (Series D deck) 10 and Lago 13. Page numbers are PDF pages; footers show 10, 19, 13, 16, 17, 10 and none (Lago prints no number) respectively.
Brex 9 is used as the claim-only contrast; its source deck PDF is not in the stored set, so its slide image is recorded as blocked and no substitute is used. Figures are as printed on each slide and have not been verified.
How we built this: drafted and checked with AI assistance (editorial model review against the original slide images); no human editor has reviewed this guide.