"Sold Out" on a Traction Slide: How to Show It as Demand
What a sold-out claim proves in a pitch deck and what it hides: quantity, time to sell out, who bought, sell-in versus sell-through and reorders.
"Sold Out" as Traction: State the Quantity, the Time and Who Bought It
Founders of consumer products, events and limited releases often write "sold out" on a traction slide. It sounds like proof of demand, but on its own it only says that the stock you made was gone. Whether that is impressive depends on how much there was, how quickly it went, who bought it and whether they came back. This guide shows how five startups used the phrase and what an investor can and cannot learn from each slide.
TL;DR
A sold-out claim becomes evidence when it carries four facts: the quantity that sold (units, not only revenue), the time it took, who bought it (end customers, or a distributor or shop buying stock) and what happened next (a reorder, a larger second batch, or a waitlist). Without the quantity, "sold out" can describe 50 units as easily as 50,000.
Love With Food gives quantities and a second, larger batch (200 boxes in month one, 300 in month two). DSTLRY separates selling to stores from selling to readers and adds reorders. Folia Water, Glyph and Pimentae each leave out at least one of the four facts, and Glyph's growth label does not match its own chart.
Five sold-out slides and what each one proves
Each slide is shown as it appears in the original deck. The order runs from the most complete demand evidence to the least.
Love With Food traction slide — slide 11
Monthly snack subscription box. The previous page gives a $14 monthly subscription and a 30% commission; the next shows press logos, 117,000+ Facebook fans and 30 blogger reviews.
Love With Food deck, slide 11. Exact stored slide matched to this analysis.
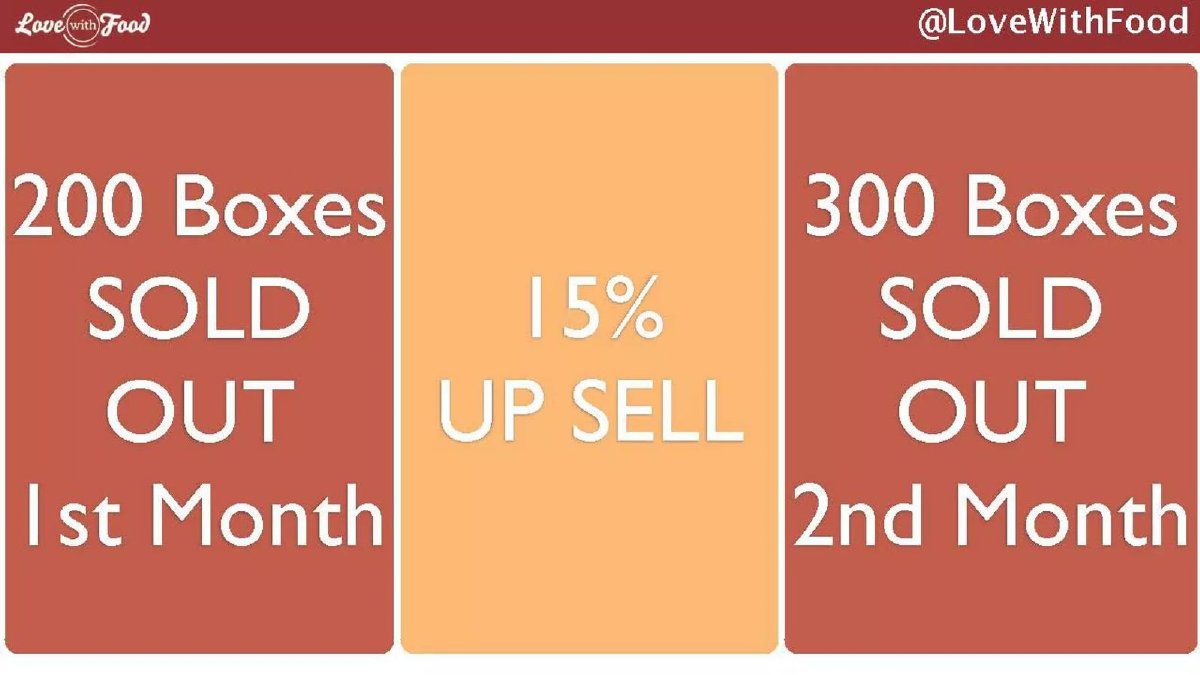
Our analysis: The most complete sell-out claim here: units, period and a larger second batch. It still leaves open whether supply or demand set the 200 and 300.
Evidence and limitation: Two quantities over two periods: the second batch was 50% larger (300 against 200) and also sold out. At the $14 price on page 10, 200 and 300 boxes are about $2,800 and $4,200 of subscription value; that is our calculation, not a figure the deck gives. The slide does not say whether month-two buyers include month-one subscribers renewing, or what "15% up sell" is measured on.
What a founder can adapt: Keep the two batches and add the split between new and returning subscribers, plus a waitlist or turned-away orders if you had them.
Supporting analysis
What the deck claims: Three tiles: "200 Boxes SOLD OUT 1st Month", "15% UP SELL" and "300 Boxes SOLD OUT 2nd Month".
Presentation choice: Showing two consecutive batches turns a one-off event into a trend an investor can extend.
When it does not fit: An unexplained percentage tile between the two numbers; define what "up sell" counts.
Comic book publisher presenting its first year. Pages 19 and 21 surround this slide with release plans and further sales figures.
DSTLRY deck, slide 20. Exact stored slide matched to this analysis.
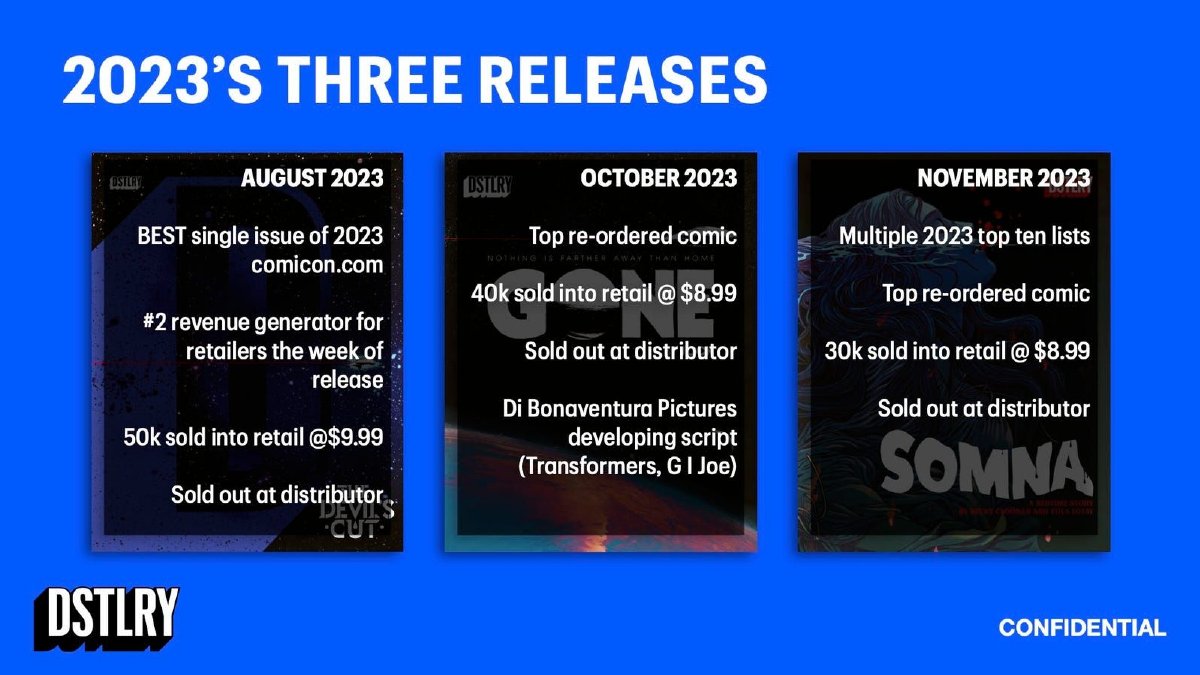
Our analysis: The clearest separation of sell-in from sell-through in this set, with a reorder claim that needs a source.
Evidence and limitation: The wording is precise: units "sold into retail" and sold out "at distributor" are sell-in, and the slide does not claim reader sales. "Top re-ordered comic" is a sell-through signal, because shops reorder what readers buy, but the slide does not name the list or the period. Units fall from 50k to 40k to 30k across the three releases; the slide does not say whether print runs were set lower. At cover price, the three releases are about $499,500, $359,600 and $269,700 of retail value (our arithmetic), not DSTLRY's revenue.
What a founder can adapt: Keep the sell-in wording; add the print run per release, the reorder quantity and the source of the ranking.
Supporting analysis
What the deck claims: "2023's Three Releases": August 2023, "50k sold into retail @$9.99", "Sold out at distributor", "#2 revenue generator for retailers the week of release"; October 2023, "Top re-ordered comic", "40k sold into retail @ $8.99", "Sold out at distributor"; November 2023, "Top re-ordered comic", "30k sold into retail @ $8.99", "Sold out at distributor".
Presentation choice: Labelling the sale as "into retail" stops an investor reading distributor orders as reader purchases.
When it does not fit: Letting a falling unit trend pass without explanation.
UK tequila cocktail brand. A "Key Milestones" grid of eight tiles.
Pimentae deck, slide 10. Exact stored slide matched to this analysis.
Our analysis: Event sell-outs are quantified; the retail sell-out, the one that would show shoppers buying from a shelf, is not.
Evidence and limitation: Two different sell-outs. The events tile gives a count, revenue and serves: £175k across 12 events is about £14,600 per event (our arithmetic). The slide does not say whether the £175k is part of the £250k+ total; if it is, events make up about 70% of revenue to date. The Selfridges tile gives no quantity: "sold out week 1" could be a few bottles or a full order.
What a founder can adapt: Give units stocked and sold for the Selfridges listing, whether it reordered, and how event revenue relates to total revenue.
Supporting analysis
What the deck claims: Tiles include "£250k+ revenue to date, 1150 unique customers, 3k bottle sales", "Influencer launch campaign, 23 million reach, 450 sales in month 1 (£13k)", "Hosted 12 sell-out events generating £175k revenue, 22k+ serves" and "Selfridges listing (London & Manchester), Sold out week 1".
Presentation choice: A respected retailer's name plus "sold out" is persuasive, which is why its missing quantity matters.
When it does not fit: A sell-out claim beside a retailer's name with no units.
Direct-to-consumer shoe brand. Page 2 shows the product; page 4 shows "$27 Paid CAC", "$50k Revenue" and "$53 Profit per pair".
Glyph deck, slide 3. Exact stored slide matched to this analysis.
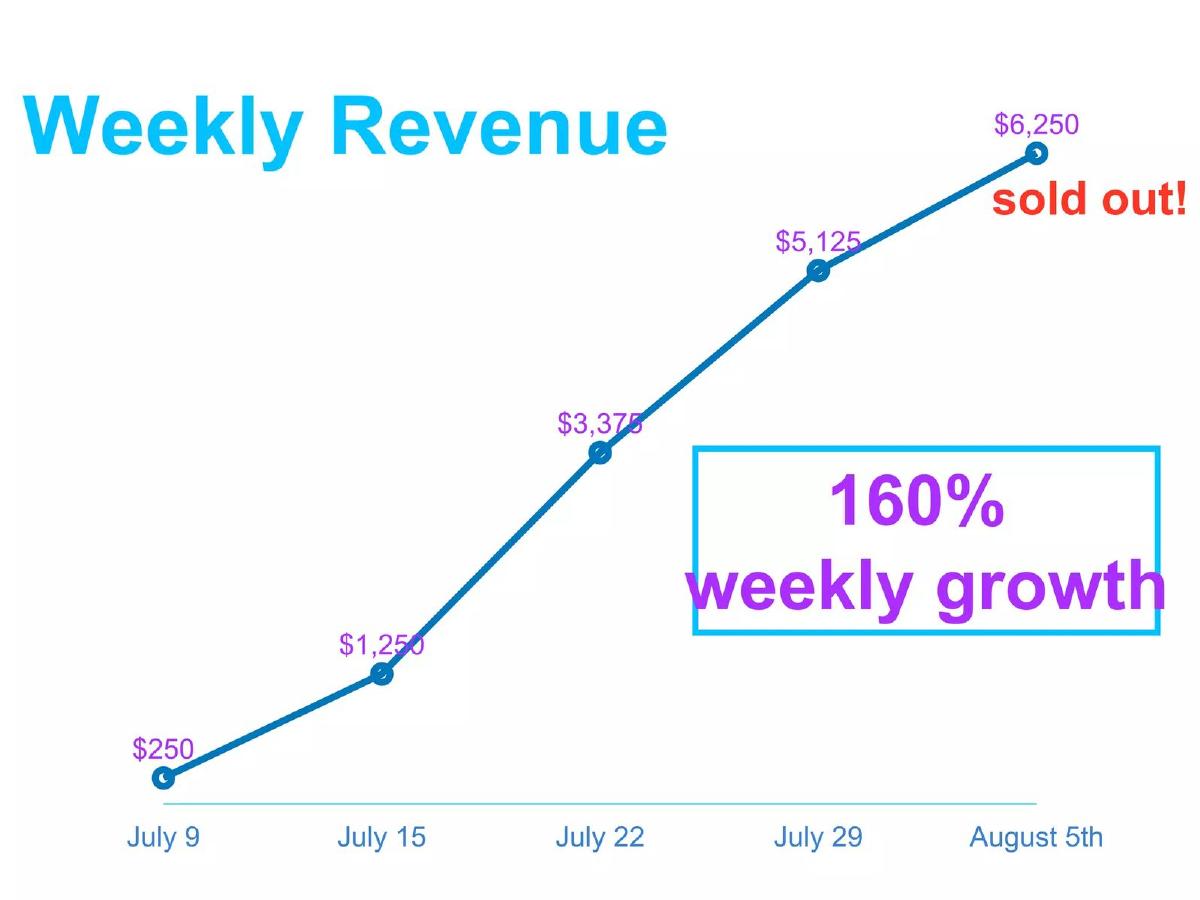
Our analysis: Real weekly data, with a growth label that averages away the slowdown and a sell-out that may be a stock limit.
Evidence and limitation: The week-over-week rises are 400%, 170%, 52% and 22%. Their simple average is about 161%, which matches the label, but the compound rate over the four steps is about 124% a week, and growth slowed every week. The five points add up to $16,250; the deck does not reconcile this with the $50k on page 4. The slide does not say how many pairs were available, so the sell-out cannot be read as demand beyond that week's stock.
What a founder can adapt: Show units and stock per week, state the compound rate or the latest week's growth, and say how much was turned away after selling out.
Supporting analysis
What the deck claims: "Weekly Revenue" chart: $250 (July 9), $1,250 (July 15), $3,375 (July 22), $5,125 (July 29), $6,250 (August 5th), with "sold out!" at the last point and a box reading "160% weekly growth".
Presentation choice: A chart with dated points lets an investor check the label, and here the check changes the reading.
When it does not fit: An averaged growth rate on a decelerating series.
Water-filter paper maker. Page 6 shows unit economics (manufacturing 7¢, distributors 25¢, retail 50¢); page 8 introduces the founders.
Folia Water deck, slide 7. Exact stored slide matched to this analysis.
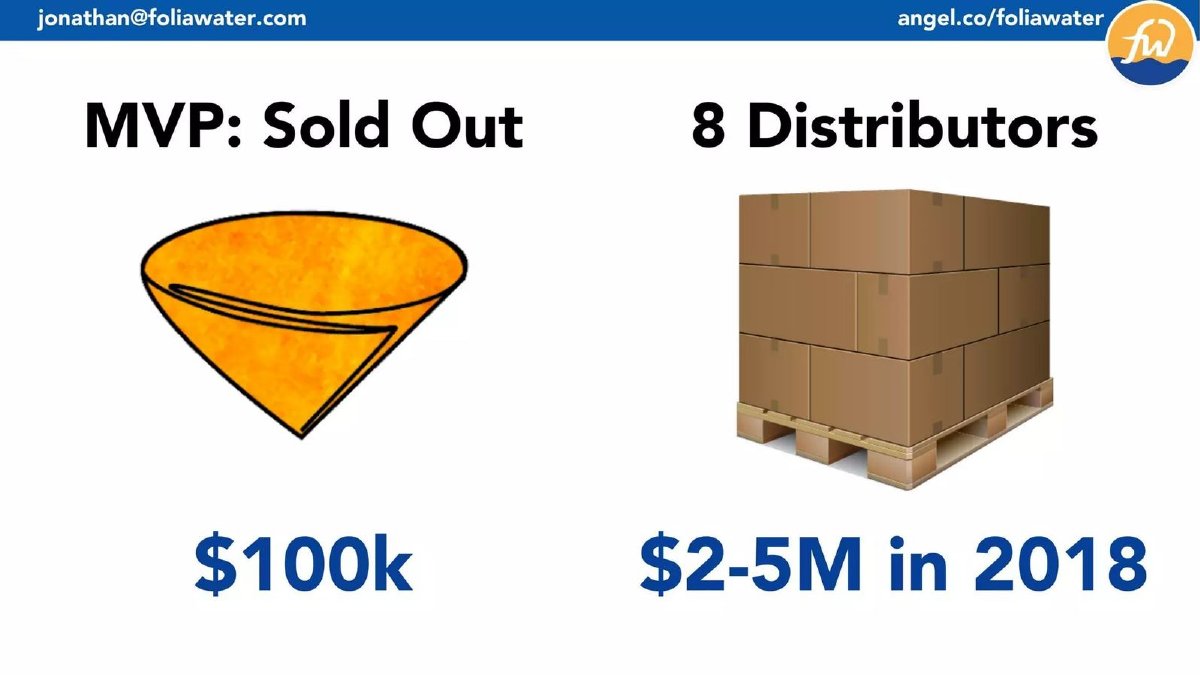
Our analysis: A sell-out with no quantity, period or buyer, set next to a forecast.
Evidence and limitation: The slide does not say what the $100k is: sales, orders or the value of the run. If it were sales at the 25¢ distributor price on page 6, it would be about 400,000 filters; that is our hypothetical reading, not a deck figure. "$2-5M in 2018" is a forecast range beside eight distributors, with no link to the sell-out.
What a founder can adapt: Label the $100k, give units and who bought them, and mark the 2018 range as a forecast built from distributor orders.
Supporting analysis
What the deck claims: "MVP: Sold Out" above "$100k", and "8 Distributors" above "$2-5M in 2018".
Presentation choice: It shows how little "sold out" says when nothing else is attached.
When it does not fit: An unlabelled money figure under "sold out".
Our reading of the five slides against the four facts. "Partly" means present but incomplete.
Slide
Quantity
Time to sell
Who bought
Follow-up
Love With Food p11
Yes (200, 300 boxes)
Yes (per month)
Partly (subscribers)
Yes (larger second batch)
DSTLRY p20
Yes (50k, 40k, 30k)
Partly (release month)
Yes (distributor/retail)
Partly (reorders, no source)
Pimentae p10
Partly (events yes, Selfridges no)
Partly (week 1)
Partly
No
Glyph p3
No (revenue only)
Yes (weekly)
No
No
Folia Water p7
No
No
No
No
Key Takeaways
Give the number of units that sold out, not only the word.
Say how long they took to sell: hours, a week, a month.
Say who bought: end customers, a shop, or a distributor.
Sell-in to a distributor is not sell-through to customers; label which you mean.
A reorder or a larger second batch is the strongest follow-up evidence.
If supply was the limit, say how much more you could have sold and how you know.
Turn your sell-out into a demand statement
Fill in each line. A blank line is a question an investor will ask.
Quantity. How many units were available, and how many sold?
Time. How long did they take to sell?
Price. At what price, and was it discounted?
Buyer. End customers, a shop, or a distributor? Sell-in or sell-through?
Audience. What share came from outside your launch network?
Follow-up. Reorder, larger batch, waitlist or orders turned away.
Revenue. What the company invoiced, separate from retail value.
Copyable framework: [Batch/release]: [units] at [price] sold in [time] to [buyer type]; follow-up: [reorder/second batch/waitlist of N].
Illustrative example 1 — written by us
Before: Selfridges listing (London & Manchester). Sold out week 1.
After: Selfridges (London & Manchester): [units] stocked, sold out in week 1; reorder of [units] on [date].
What improved: Uses Pimentae's claim; bracketed values are placeholders, not company figures.
Illustrative example 2 — written by us
Before: MVP: Sold Out. $100k.
After: MVP run: [units] filters, sold out in [period] to [buyers]; $[x] invoiced.
What improved: Uses Folia Water's claim; bracketed values are placeholders.
What this guide covers and what it doesn't
This guide covers one claim: stock that ran out. Our pre-orders guide covers demand collected before a product ships, and our food traction guide covers food and drink traction in general; both mention a sell-out only in passing. The consumer product go-to-market guide treats sell-through as one prompt in a channel plan. None of them explains what "sold out" measures or how to state it so an investor can use it.
The guide does not cover waitlists or subscriptions with a deliberately limited intake, except where they appear as the follow-up to a sell-out.
What "sold out" can mean
The same words describe different events. A batch can sell out to end customers on your own site. An event can sell out its tickets. A shop can sell out of the units it stocked. A distributor can sell out of the units it bought from you, meaning shops have ordered them, not that readers or drinkers have bought them. In retail these are sell-in (what you sell to the trade) and sell-through (what the trade sells to the end customer).
Each version answers a different investor question. Sell-in shows that buyers in the trade will take your product. Sell-through shows that end customers want it. A reorder shows that the first sell-through was not a one-off. Name which one your slide shows. (Investopedia)
When the sell-out is the size of the batch
A sell-out tells you demand was at least as large as supply. It does not tell you how much larger. If a founder made 200 units, a sell-out proves demand of at least 200 at that price, during that period, from that audience. Investors will ask the next question: how many could you have sold?
Answer it with something you measured: a waitlist that formed after the sell-out, a second batch that sold out faster or in larger size, orders you turned away, or the share of buyers who came from outside your friends and launch network. Avoid presenting the batch size you chose as the size of demand.
Worked example: turning a sell-out into a demand statement
Hypothetical example, invented for illustration. A sauce brand makes 1,200 bottles and sells them in 9 days on its own site at $12, to 870 customers, 60% of whom found it through paid social. A waitlist of 400 people forms afterwards. Batch two, 3,000 bottles, sells out in 21 days, and 22% of buyers are repeat customers from batch one.
The weak slide says "Sold out twice." The useful slide says: "Batch 1: 1,200 bottles at $12 sold in 9 days to 870 customers. Batch 2: 3,000 bottles sold in 21 days; 22% repeat buyers; 400-person waitlist between batches." The second version lets an investor compare speed and size between batches: batch two sold about 143 bottles a day against about 133 for batch one, so the sell-out was not just a small first run.
Revenue, cover price and what the company keeps
Some sell-out slides give a price per unit. Multiplying units by that price gives retail value, not company revenue, when the product goes through distributors and shops that take a share. DSTLRY's slide gives units "sold into retail" at the cover price; the slide does not say what share of the cover price DSTLRY receives. If you show revenue, use what the company invoiced, and label a retail-value figure as retail value.
Where a sell-out claim belongs in the deck
Put a sell-out on the traction slide when it is your strongest evidence that strangers will pay. If the deck already shows monthly revenue, customers and retention, the sell-out is supporting detail: one line beside the revenue chart, giving the batch and the speed. If the sell-out is your main proof, give it the whole slide and attach the four facts, because the investor has nothing else to check it against.
Keep the sell-out next to the numbers it explains. Love With Food puts its boxes right after its price and commission slide, so the reader can work out what each batch was worth. Glyph puts its weekly chart before the unit economics page; a reader has to turn the page to learn the paid acquisition cost behind the revenue. When your sell-out depended on paid marketing, an influencer campaign or a launch event, say so on the same slide: Pimentae's 450 sales in month one sit next to a 23 million reach campaign, which tells an investor how those sales were bought.
Supply limits: turning a constraint into a forecast input
Many early sell-outs happen because the founder could only afford a small run. That is normal, and investors will not mark you down for it if you are clear. The useful move is to show what the constraint hid and what you will do once funded. Three measured signals help: the number of people who joined a waitlist or asked to be notified after the sell-out, the orders you turned away or refunded, and the speed of each batch in units per day.
If batch speed holds or rises as batch size grows, demand is probably above supply. If it falls, the first batch may have been bought by your own network, and the next batch is the real test. Show the per-day rate for each batch so the investor can see which case applies. Then connect it to the ask: the funding pays for a run of a stated size, and the sell-through rate you have measured says how quickly it should sell. Label that last step as a plan, not a result.
Reading the five slides together
Across the five decks, the claims become more useful in a clear order. Folia Water states the word and a money figure without units, period or buyer. Glyph adds dated weekly revenue, which lets an investor check growth, but not stock. Pimentae quantifies its events and leaves its most important retail claim bare. Love With Food gives two batches with units and a period. DSTLRY says exactly which kind of sale it means and adds a reorder claim.
The common gap is the follow-up. Only Love With Food shows a second, larger batch, and only DSTLRY points to reorders. Neither says how many more could have sold. If you take one change from this guide, add the follow-up line: what happened after you sold out.
Common mistakes
No quantity. "Sold out" without units can mean any batch size. Give the number.
Sell-in shown as sell-through. A distributor selling out means shops ordered; say so, and add shop sales if you have them.
Retail value shown as revenue. Units times cover price is not what you received through a distributor.
Averaged growth on a slowing series. State compound or latest-period growth.
Retailer name, no numbers. A famous shop plus "sold out" needs units and a reorder to count.
Diagnostic checklist
Units available and units sold are stated.
The time to sell out is stated.
The buyer is named: end customer, shop or distributor.
Revenue is what the company invoiced.
A follow-up (reorder, second batch, waitlist) is shown or its absence explained.
Growth rates match the chart they sit on.
Frequently asked questions
Is "sold out" good traction?
Only with its quantity, time and buyer. It proves demand was at least as large as the batch, not how much larger.
What if we deliberately made a small batch?
Say so, and show what happened next: a waitlist, a faster second batch or orders turned away.
Our distributor sold out. Can we call that customer demand?
Call it sell-in. Add reorders or shop sales data to show end customers bought, as DSTLRY's reorder claim tries to.
Should we show revenue or units for a sell-out?
Both if you can. Units show how big the batch was; revenue shows the price held. If you sell through distributors, show what you invoiced, not units times the shop price.
Does selling out an event count as traction?
Yes, if you give the number of events, tickets or serves and the revenue, as Pimentae does. Say whether event revenue is included in your total revenue, and what it says about buying in shops or online.
How do we show demand we couldn't fill?
Use measured signals: a waitlist count, orders refunded or turned away, or units per day across batches. Don't estimate unmet demand from the speed of the sell-out alone.
How we chose these examples
Discovery (2026-10-04, Run 201): corpus index search for "sold out" and variants found these five decks plus passing mentions in existing guides. Closest guides were read: pre-orders, food traction, consumer product go-to-market.
Each example page and its neighbours were rendered from the stored deck file and read from the images. Calculations marked as ours are not stated in the decks. The worked example is invented and labelled.
Company figures are not verified. Classifications are our editorial reading. Drafted with AI assistance and checked by editorial model review, not human-reviewed.