Glyph’s 2019 pitch deck is a lean, visual-heavy presentation that leans into the 'minimalism' brand identity it sells. With only 14 slides, the company avoids dense text in favor of high-impact metrics and lifestyle imagery. The deck successfully communicates a strong early-stage signal by showcasing $50k in revenue and a 160% weekly growth rate leading up to a 'sold out' status on slide 3. While it lacks traditional sections like a detailed market size (TAM) or a formal 'Ask' slide with valuation, it compensates with a highly credible team slide featuring deep expertise in digital advertisin…
Key takeaways
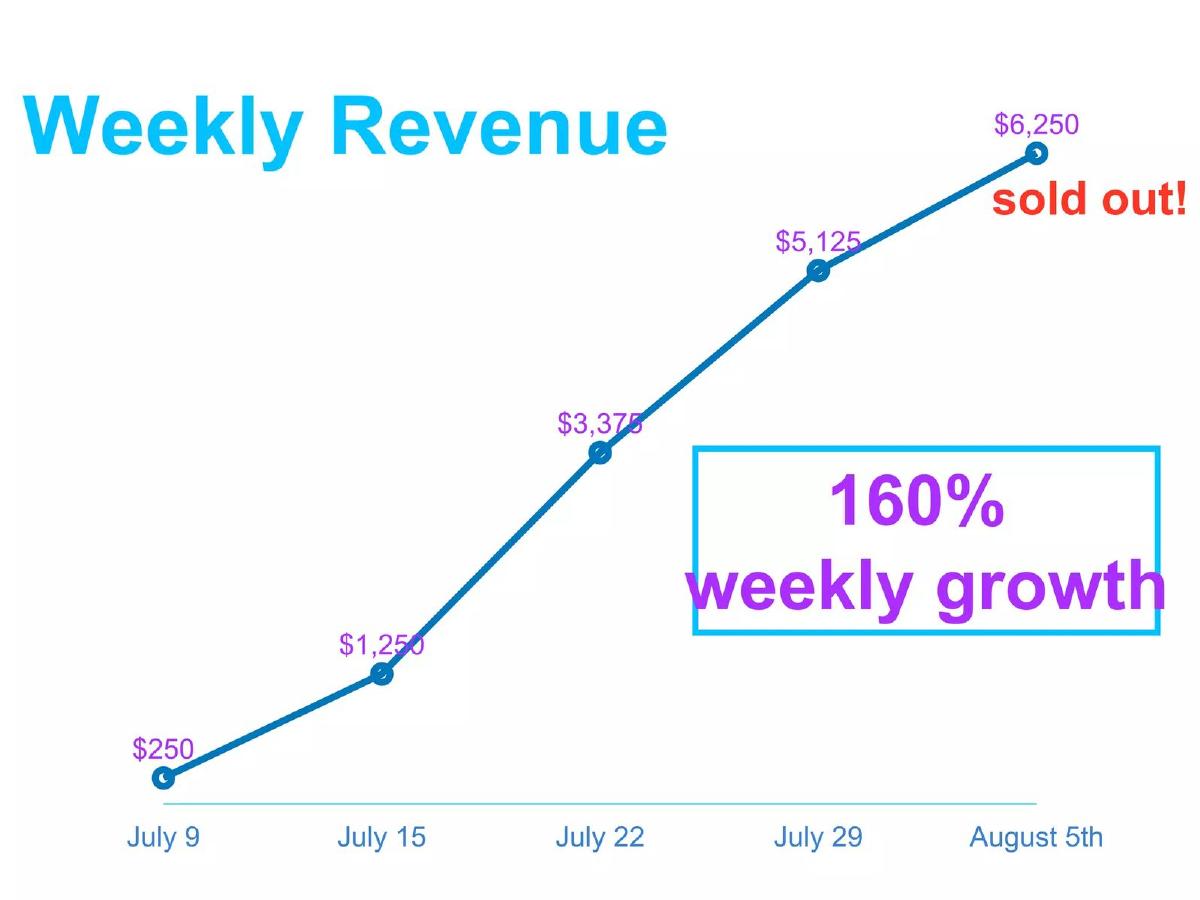
- The deck reports a 160% weekly growth rate in revenue between July 9 and August 5 on slide 3.
- Glyph achieved a 'sold out' status by the final week of the reported period, reaching $6,250 in weekly revenue as shown on slide 3.
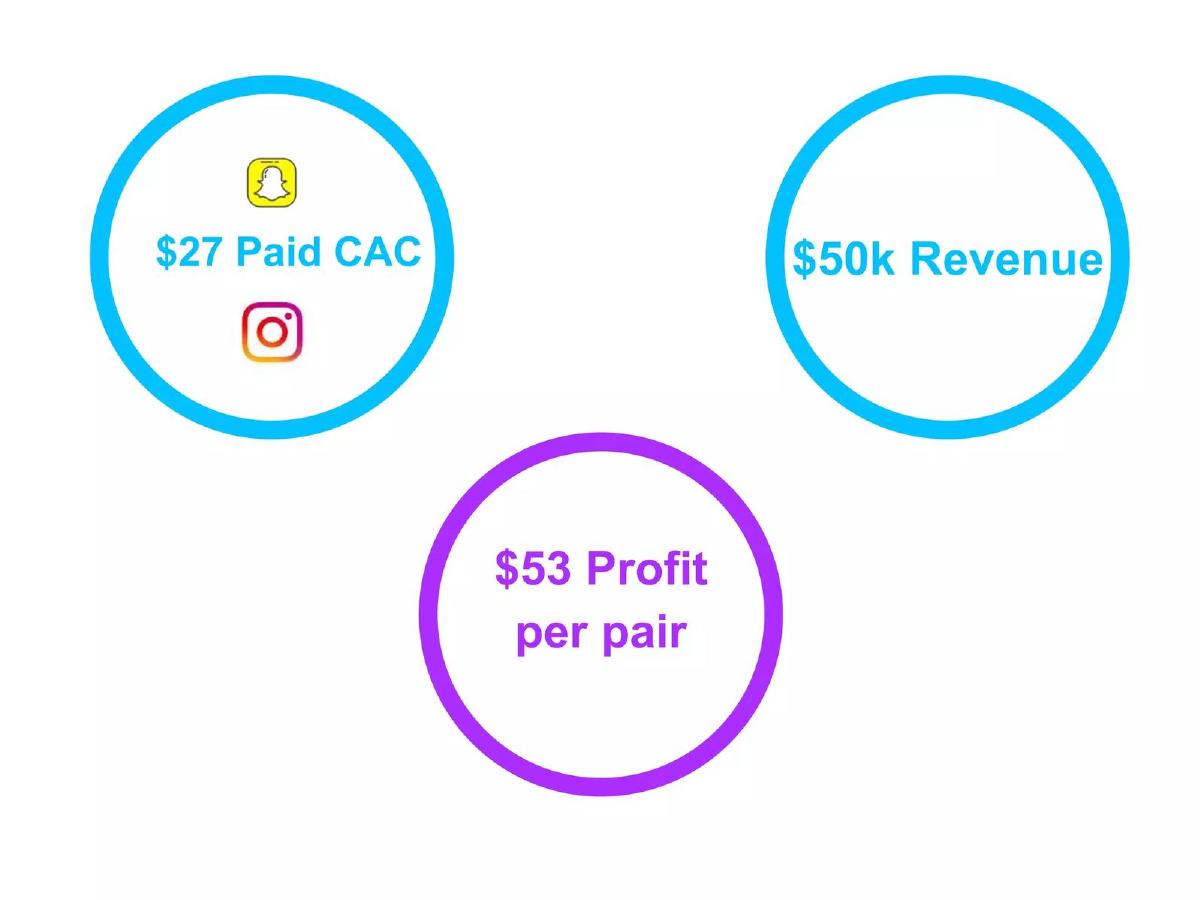
- Unit economics are clearly defined on slide 4, citing a $27 Paid CAC and a $53 profit per pair.
- The company total revenue at the time of the deck was stated as $50k on slide 4.
- Founder Pranav Sachdev brings experience managing $300 million in digital advertising spend, according to slide 13.
- Founder Alan Lau provides domain expertise via a 'Hong Kong Apparel Family' background and a Mechanical Engineering degree on slide 13.
- The deck utilizes six consecutive slides (slides 7-12) of user-generated content and social media handles to demonstrate social proof.
- There is no slide detailing the specific investment amount sought or the intended use of funds within the 14-slide deck.
The Power of Minimalism in D2C Fundraising
Glyph’s pitch deck is a reflection of its product: minimalist, functional, and devoid of unnecessary clutter. In the crowded D2C (Direct-to-Consumer) fashion space, founders often over-explain the 'why' behind their brand. Glyph takes the opposite approach, letting a few key metrics and a clear aesthetic speak for themselves. This teardown examines how a 14-slide deck helped secure $150K in Seed funding by focusing on velocity and founder-market fit.
Slides 1-2: The Hook and the Product
Slide 1 introduces the brand with the tagline 'digitally knit shoes for IRL.' The logo is modern and colorful, contrasting with the stark white background. This immediately establishes the brand identity.
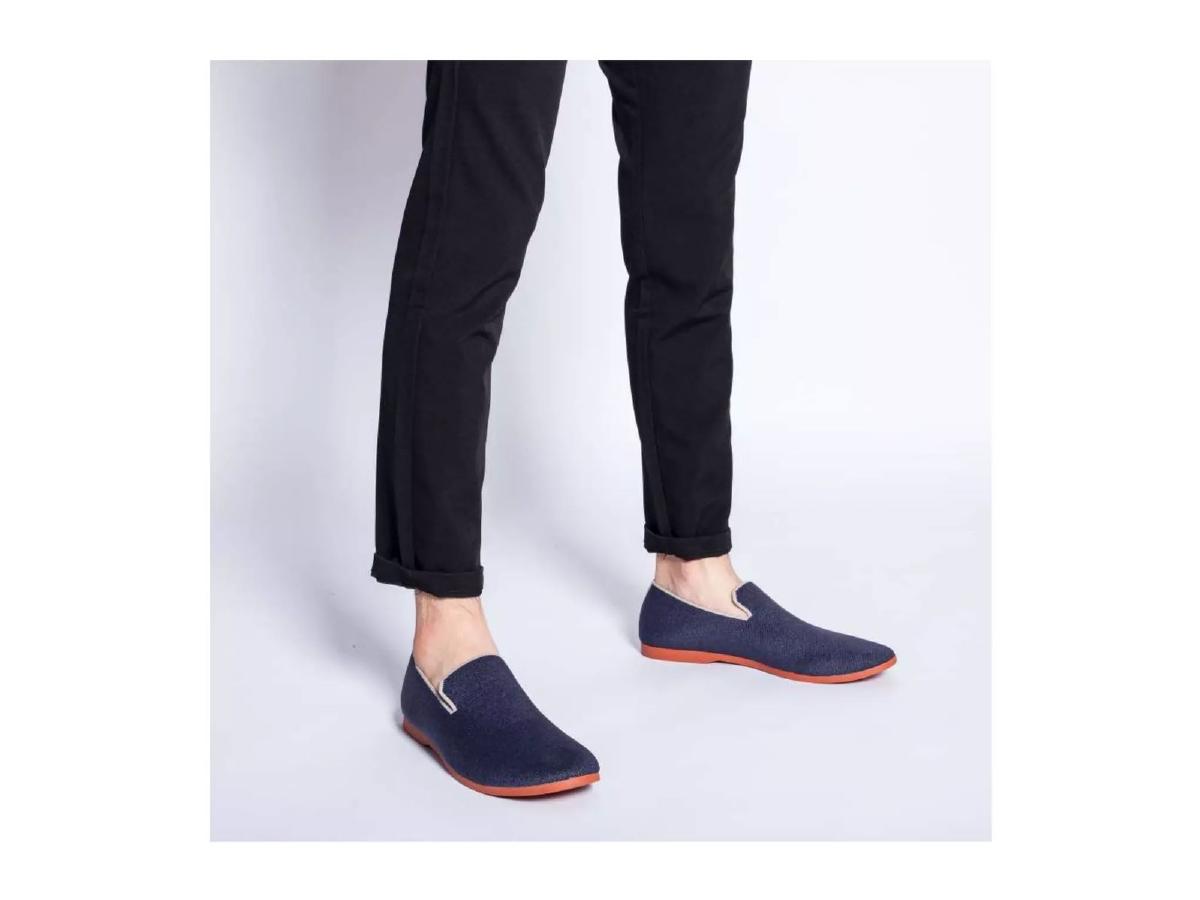
Slide 2 is a full-bleed product shot. It shows the shoe in a real-world context—worn with black trousers. The shoe itself is a simple loafer style with a contrasting orange sole. By leading with the product rather than a problem statement, Glyph assumes the 'problem' (the need for versatile, simple footwear) is self-evident to anyone who sees the design.
Slide 3: The Traction Inflection Point
This is arguably the most important slide in the deck. Slide 3 displays a line graph of 'Weekly Revenue' from July 9 to August 5. The numbers are small in absolute terms—starting at $250 and ending at $6,250—but the percentage growth is the story. The slide highlights '160% weekly growth' and a 'sold out!' stamp at the peak. For a Seed investor, seeing a product sell out in its first month is a powerful indicator of demand, regardless of the starting dollar amount.
Slide 4: Unit Economics and Scale
Slide 4 provides the financial validation for the growth shown on the previous slide. It highlights three key figures: $27 Paid CAC , $50k Revenue , and $53 Profit per pair . By showing the logos of Snapchat and Instagram next to the CAC, they demonstrate they have identified repeatable acquisition channels. The $53 profit per pair is a healthy margin for a startup, suggesting that as they scale, the business has a clear path to profitability.
Slide 5-6: The Technology and The Vision
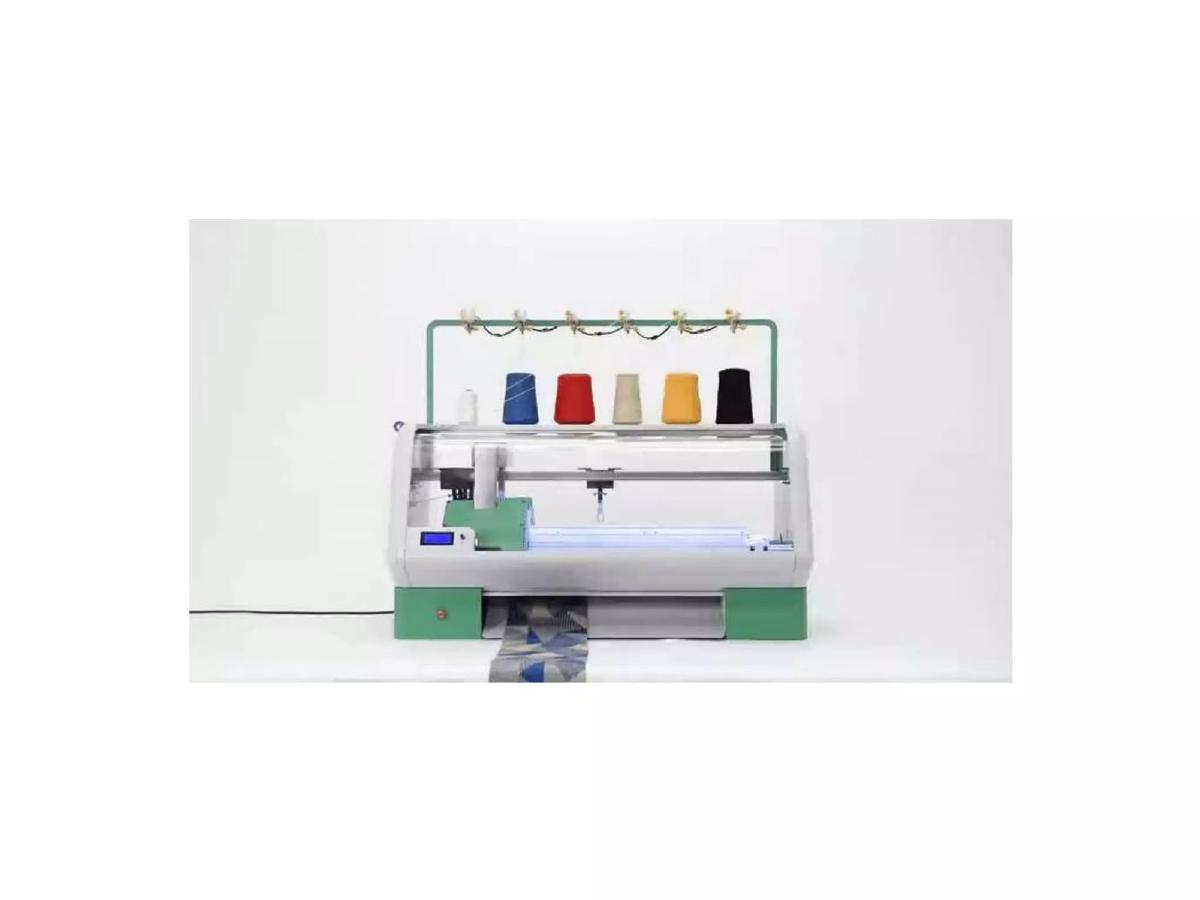
Slide 5 shows the digital knitting machine. This is a subtle 'moat' slide. Digital knitting reduces inventory risk and waste, which are the two biggest killers of fashion startups. It moves the conversation from 'we buy shoes' to 'we make shoes efficiently.'
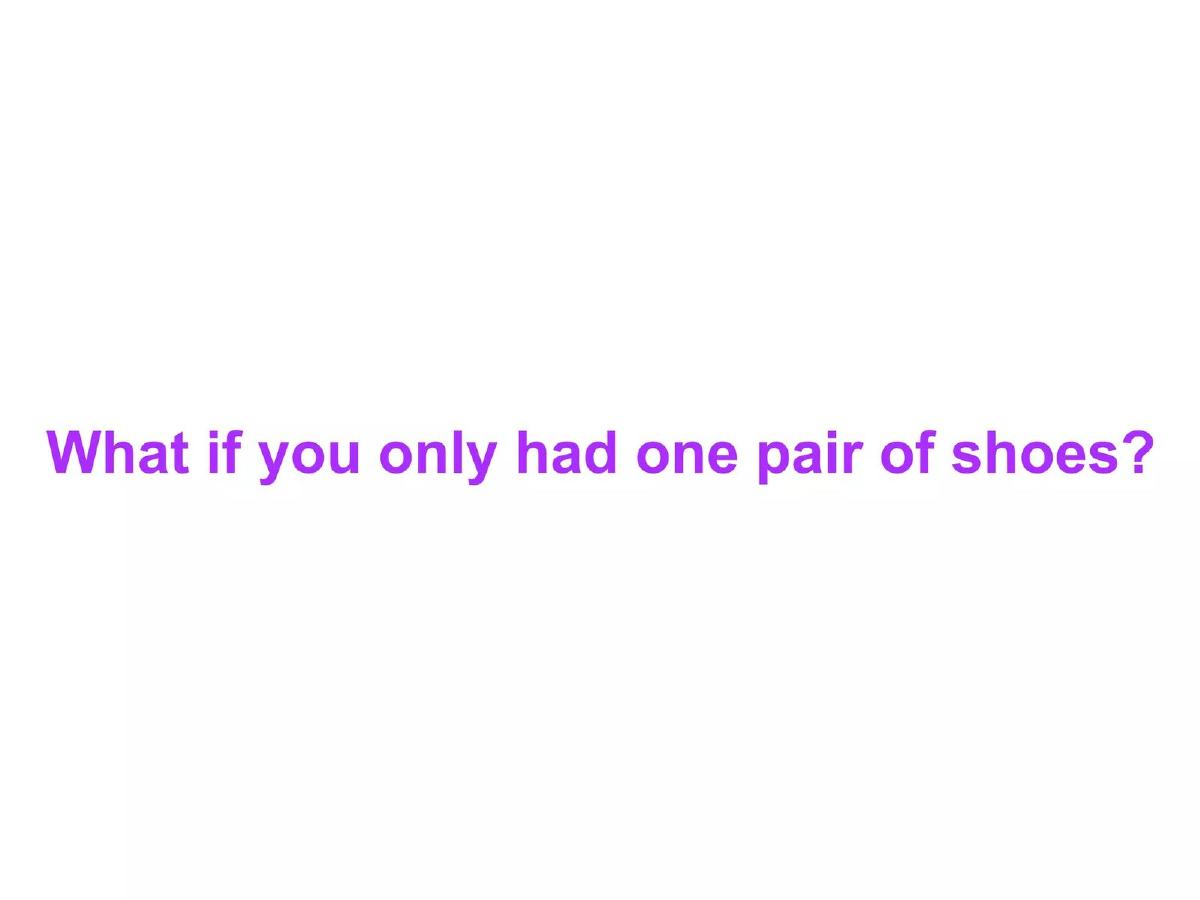
Slide 6 poses the philosophical question: 'What if you only had one pair of shoes?' This slide defines the brand's mission. It isn't just selling footwear; it is selling a minimalist lifestyle. This resonates with a specific consumer segment that values 'less but better.'
Slides 7-12: Social Proof and Versatility
The deck then moves into a long sequence of lifestyle images ( Slides 7 through 12 ). Each slide features a different user, identified by their Instagram handle (e.g., @jayabd, @bjet123, @lizzpstick). The settings vary significantly:
A medical professional in a clinic. · A traveler at an airport with a suitcase. · A person relaxing in a hammock. · A person walking through a puddle (demonstrating water resistance). · A professional setting in an office.
This sequence serves two purposes. First, it proves the shoes are versatile enough to be the 'only pair' someone owns. Second, it shows that real people are already wearing and tagging the brand on social media, which validates the $27 CAC mentioned earlier.
Slide 13: Founder-Market Fit
Slide 13 introduces the founders, Pranav Sachdev and Alan Lau. The credentials listed are highly specific to the challenges of a D2C brand. Sachdev is credited with managing $300 million in digital advertising spend and working on the Facebook Ad Platform. This explains the low CAC. Lau is a Mechanical Engineer from a Hong Kong Apparel Family , with experience at Accenture and EY. This explains the manufacturing and supply chain capability. The logos of J.P. Morgan, Tremor Video, Cornell, and EY add institutional credibility.
Slide 14: The Closing
Slide 14 is a simple call to action: 'Get a Sneak Peak After the Presentations!' followed by an email address. Interestingly, the deck does not include a slide asking for a specific dollar amount or disclosing a valuation. This suggests the deck was likely used as a backdrop for a demo day or a first-touch meeting where the 'Ask' is delivered verbally.
What Glyph Does Well
The deck is exceptionally disciplined. It avoids the 'wall of text' trap that many early-stage founders fall into. By focusing on Slide 3 (Growth) and Slide 4 (Economics) , they answer the two biggest questions investors have: 'Do people want this?' and 'Can you make money selling it?'
The use of social media handles on the lifestyle slides is a clever way to invite due diligence. An investor could easily look up those accounts to see the engagement and authenticity of the brand's fans. Furthermore, the team slide is a masterclass in highlighting relevant experience. They didn't just list where they went to school; they listed the specific skills (ad spend management and apparel manufacturing) that mitigate the risks of the business.
What is Missing from the Glyph Deck
While the minimalism works for the brand, the deck leaves several stones unturned. There is no mention of the Total Addressable Market (TAM) . While the footwear market is obviously large, investors usually want to see how the founders define their specific slice of it. There is also no Competitor Analysis . In 2019, brands like Allbirds were already dominant in the 'sustainable/knit shoe' space; Glyph’s failure to differentiate themselves from these incumbents in the deck is a notable omission.
Finally, the lack of a Financial Forecast or a Use of Funds slide means the deck is incomplete as a standalone document. It functions well as a teaser or a presentation deck, but a follow-up would be required to understand the long-term capital requirements of the business.
Founder Lessons: What to Copy
Lead with Traction: If you have a 160% weekly growth rate, put it on the third slide. Don't bury your best news at the end. · Quantify Your Expertise: Don't just say you are an 'expert.' Say you managed '$300 million in spend.' Specificity creates authority. · Show, Don't Tell: Instead of writing a slide about 'Versatility,' Glyph showed six slides of the product in different environments. Visual evidence is always more persuasive than bullet points. · Define Your Unit Economics Early: Even at $50k in revenue, knowing your CAC and profit per unit shows you are a metrics-driven founder who understands the levers of your business.
Frequently asked questions
- What is Glyph's core product value proposition?
- Glyph positions itself as a 'minimalism company' creating digitally knitted shoes designed to be the only pair a person needs to own. The product aims to bridge the gap between different daily activities, as evidenced by the lifestyle imagery showing the shoes in medical, travel, office, and leisure settings.
- How does Glyph demonstrate product-market fit in this deck?
- The deck uses a combination of rapid revenue growth and social proof. Slide 3 shows revenue scaling from $250 to over $6,200 per week in one month, ending in a stockout. This is followed by six slides of diverse customers wearing the shoes, proving the product's versatility across different demographics and use cases.
- What are the key unit economics mentioned?
- On slide 4, Glyph discloses a Paid Customer Acquisition Cost (CAC) of $27 using platforms like Instagram and Snapchat. They also report a profit of $53 per pair. With $50k in total revenue already processed, these figures suggest a sustainable contribution margin for an early-stage D2C brand.
- Does the deck explain the manufacturing process?
- Slide 5 features a photograph of a digital knitting machine with multiple yarn spools. While it lacks technical text, the visual supports the claim that the shoes are 'digitally knit,' which typically implies a reduction in waste and a more streamlined production process compared to traditional footwear assembly.
- What is missing from the Glyph pitch deck?
- The deck omits several standard venture components: a competitive landscape analysis, a total addressable market (TAM) calculation, a detailed financial roadmap, and a specific 'Ask' slide. It functions more as a high-level brand and traction overview rather than a comprehensive business plan.