Star Ratings and Reviews on a Pitch Deck: Count, Source
A 4.8-star rating means little without the number of reviews, where they were left and when.
Star Ratings and Reviews on a Pitch Deck: Give the Count, Name the Source, Show the Spread
Consumer apps and service companies often put a star rating on their deck: '4.8 stars on the App Store', '4.7 from 450+ reviews', '#1 rated contractor'. Ratings are public, easy to check and familiar to everyone, which makes them tempting. They are also easy to over-read. Almost every successful app sits between 4.5 and 4.9, so the stars alone rarely separate one company from another. What makes a rating useful is everything around it: how many people rated, on which platform, over what period, how the ratings are spread, and how the rating relates to the number of customers. This guide shows how four founders presented ratings and what an investor can and cannot conclude from each.
TL;DR
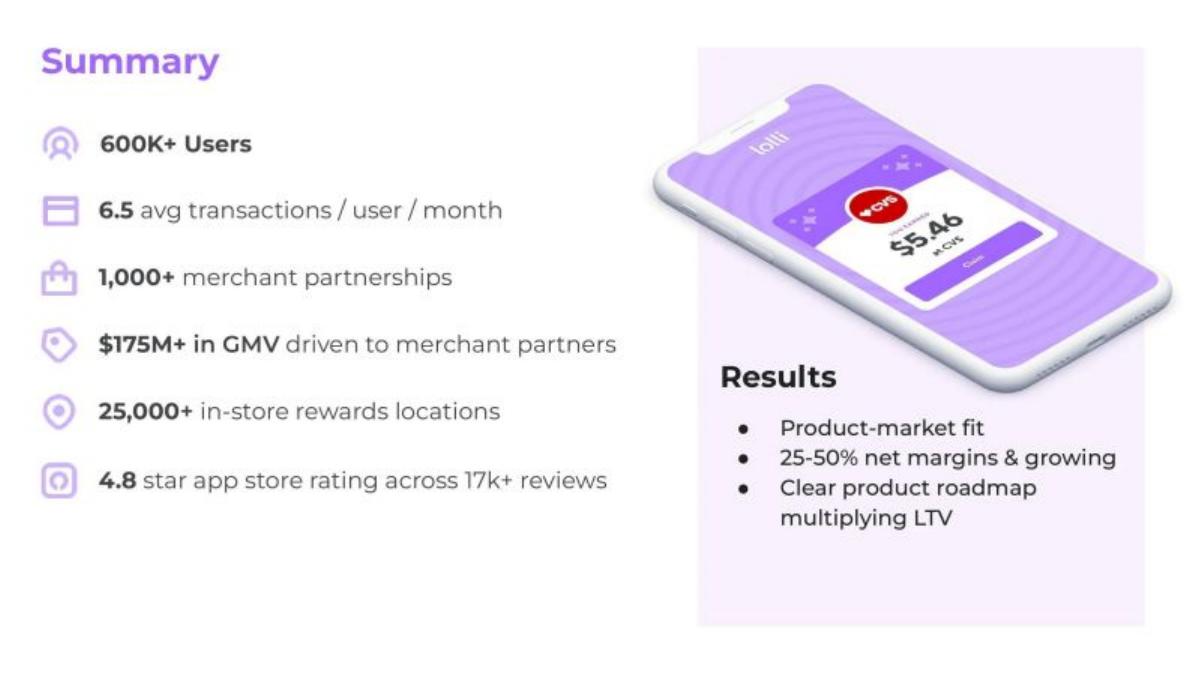
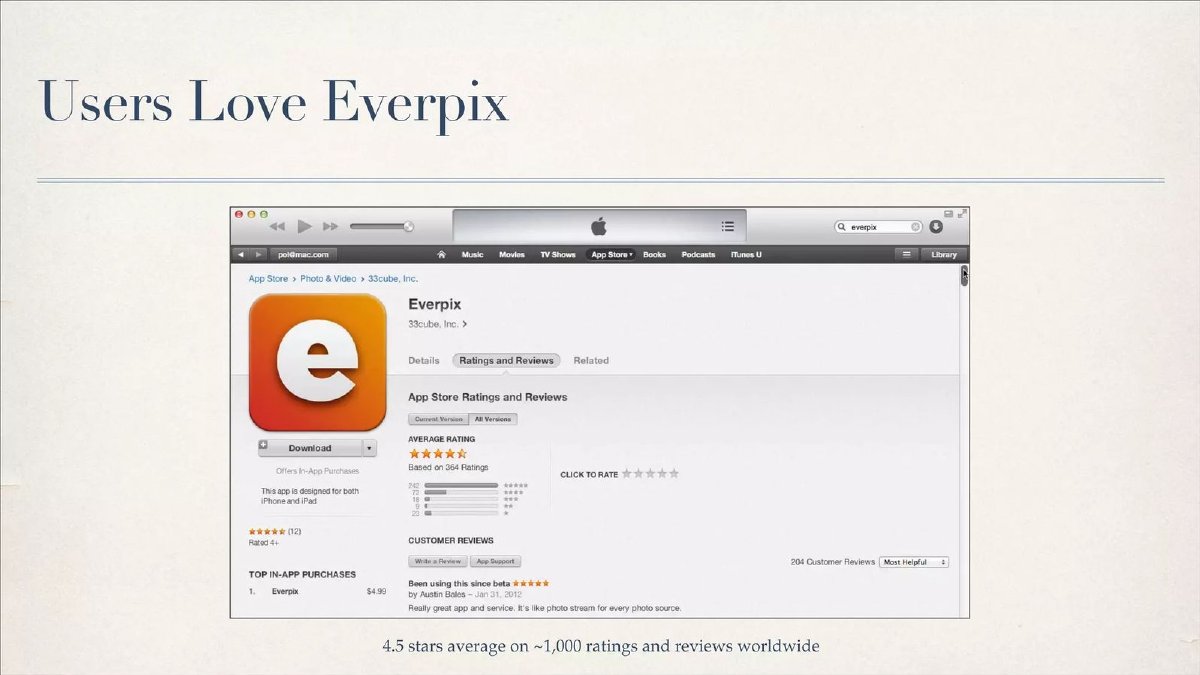
Give the rating with its review count, name the platform and the date you took it, and, if you can, show the spread of ratings rather than the average alone. Keep it beside a behaviour metric such as retention, because a rating shows satisfaction among people who chose to rate, not how many customers stay. Lolli does the basics in one line: '4.8 star app store rating across 17k+ reviews'. Everpix goes further by showing the App Store breakdown itself: 242 five-star, 72 four-star, 18 three-star, 9 two-star and 23 one-star ratings out of 364.
Four slides that present a star rating
Each slide is read at full size. Quotes are exact.
Lolli traction slide — slide 3
Bitcoin shopping rewards app. Summary slide.
Lolli deck, slide 3. Exact stored slide matched to this analysis.
Our analysis: A solid minimum, set beside behaviour metrics.
Evidence and limitation: Rating and review count given; store and date not stated. Reviews are about 3% of users (our calculation).
What a founder can adapt: Name the store and add the date.
Supporting analysis
What the deck claims: "4.8 star app store rating across 17k+ reviews"; "600K+ Users"; "6.5 avg transactions / user / month".
Presentation choice: Shows the rating-plus-count line most decks should use.
Everpix deck, slide 23. Exact stored slide matched to this analysis.
Our analysis: The only example showing the spread of ratings.
Evidence and limitation: Full breakdown shown; it works out to about 4.4 average and 6% one-star (our calculation). Caption covers a wider base than the screenshot.
What a founder can adapt: Say which store the screenshot shows and how the caption's base differs.
Supporting analysis
What the deck claims: "Based on 364 Ratings" (242 / 72 / 18 / 9 / 23 by star); "4.5 stars average on ~1,000 ratings and reviews worldwide".
Presentation choice: Lets a reader see and check the shape of satisfaction.
When it does not fit: A caption that describes a different base from the image.
Count, platform, date, spread and supporting evidence.
Example
Rating and count
Platform
Date
Spread
Beside it
Lolli
4.8, 17k+
'App store'
Not stated
Not shown
Users, transactions
Little Journey
4.7, 450+
App Store
Reviews dated 2019–2021
Not shown
Quote, unsourced 97%
Dandelion
4.8, no count
HomeAdvisor
Not stated
'No three star reviews'
Quotes, NPS 63
Everpix
~4.4 from 364 shown
iTunes App Store
Review dated Jan 2012
Full breakdown
Caption: ~1,000 worldwide
Key Takeaways
Always give the review count beside the rating.
Name the platform and the date you took the figure.
Show the spread when you can, not only the average.
Relate the review count to your user base.
Pair satisfaction with a behaviour metric such as retention.
Source every 'top rated' or '#1' claim.
Prepare your rating
Answer these before writing the slide.
Count. How many ratings stand behind the average?
Platform. Which store or site, which country, all versions or current?
Date. When did you take the figure?
Spread. What share are five-star, and what share one- or two-star?
Behaviour. Which retention or usage figure will sit beside it?
Copyable framework: "[x.x] on [platform] from [n] ratings ([month year]); [a]% five-star, [b]% one-star."
Illustrative example 1 — written by us
Before: "4.8 star app store rating across 17k+ reviews"
After: "4.8 on the [App Store] from 17k+ ratings ([month year]); about 3% of users have rated."
What improved: Our illustrative rewrite of Lolli's line. Bracketed details are not stated on the slide; the 3% is our calculation from its user count.
The question this guide answers
This guide answers one founder question: my customers rate us highly on an app store or review site. How should I show that on my deck so that investors give it the right weight?
Our testimonial guide covers quotes from named customers, and our outside quotes guide covers press and analyst quotes. Our NPS guide covers Net Promoter Score surveys the company runs itself. Our product-market fit survey guide covers the 'very disappointed' question. A public star rating is a different kind of evidence: anyone can check it, the company does not choose who answers, and the scale is the same for every competitor. None of those guides explains how to present one, which is the decision this guide covers.
How we chose and read the examples
We searched extracted text across the library for 'app store rating', 'star rating' and phrases such as '4.8 stars'. Of the 25 matches, several were healthcare quality scores (the US government's 'Star Ratings' for health plans), several were duplicate copies of one deck, and one was from a listed company. We kept four private-company slides that show customer ratings in different ways: a one-line summary metric, a rating beside a screenshot of reviews, a review-site rating beside quotes and an NPS score, and a full App Store screenshot with the rating breakdown.
Each slide was rendered from the source deck and read at full size; Everpix's rating breakdown was also read enlarged. Calculations, such as Everpix's average from its own breakdown and Lolli's ratio of reviews to users, are ours from the slides' numbers. All four companies were private when these decks were made. We did not check any rating against the live app stores or review sites.
Why investors treat ratings carefully
The scale is compressed. Apps with ratings below about four stars rarely survive long, so most decks that show a rating show something between 4.5 and 4.9. The difference between 4.6 and 4.8 tells an investor little; the count and spread tell more.
Raters choose themselves. A rating reflects people who decided to leave one, often prompted by the app at a happy moment. It is not a survey of all customers, and companies can raise it by choosing when to ask.
Counts vary by platform and period. A rating on one country's App Store, the current version only, or one review site is a slice. Investors will want to know which slice they are looking at.
Satisfaction is not retention. Customers can like a product and still stop using it. A rating supports a retention chart; it doesn't replace one.
A rating in the summary: Lolli
Lolli, a shopping rewards app that pays users in bitcoin, opens its deck with a 'Summary' slide of six metrics: '600K+ Users', '6.5 avg transactions / user / month', '1,000+ merchant partnerships', '$175M+ in GMV driven to merchant partners', '25,000+ in-store rewards locations' and '4.8 star app store rating across 17k+ reviews'. A 'Results' box beside a phone image lists 'Product-market fit', '25-50% net margins & growing' and 'Clear product roadmap multiplying LTV'.
The line is a good minimum. It gives the rating and the number of reviews behind it, which is the single most important addition. 17,000 reviews is a large enough base that a few unhappy or enthusiastic users won't move the average much. Setting it next to users and transactions per user also lets a reader relate satisfaction to behaviour: 6.5 transactions a month is evidence of use, and the rating supports it.
Three details are missing. 'App store' doesn't say which store, Apple's or Google's, or whether the figure combines both. There is no date. And a reader can work out that 17,000 reviews is roughly 3% of 600,000 users (our calculation), which is normal for apps but worth knowing: the rating reflects a small, self-selected share of users. One phrase would fix the first two: '4.8 on the App Store, 17k+ ratings, as of [month]'.
A rating beside the reviews themselves: Little Journey
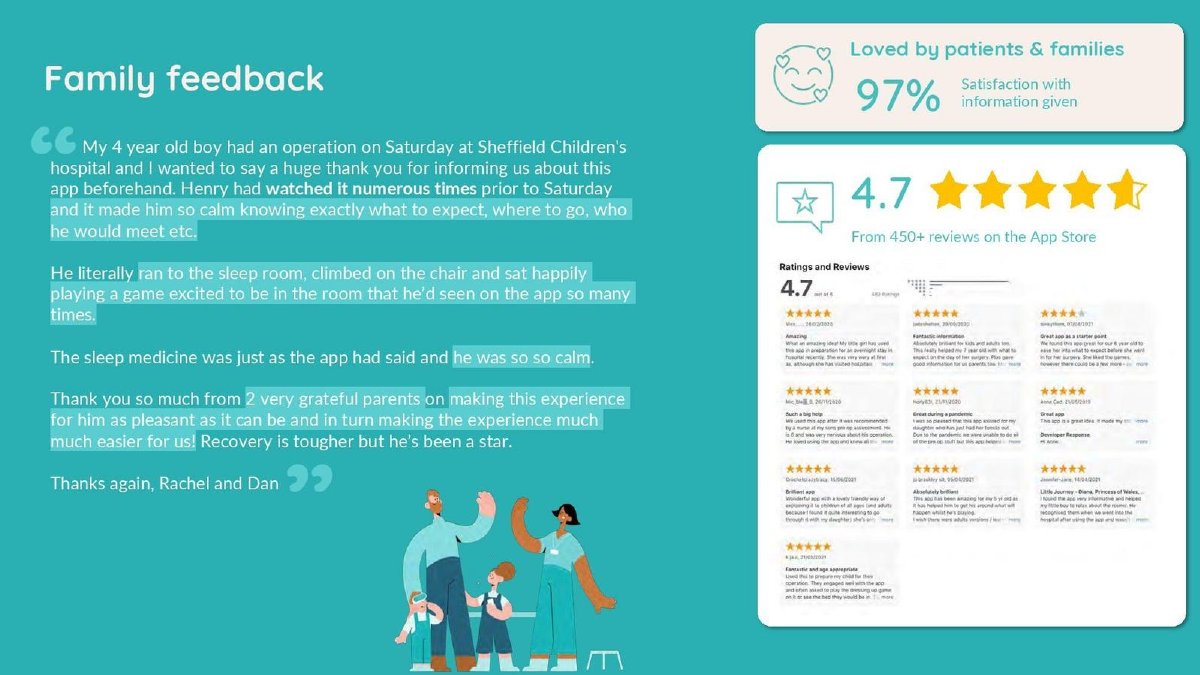
Little Journey, an app that prepares children for hospital visits, has a slide headed 'Family feedback'. On the left is a long quote from two parents, 'Rachel and Dan', about their four-year-old's operation at Sheffield Children's hospital. On the right, a box headed 'Loved by patients & families' says '97% Satisfaction with information given', and below it a large '4.7' with five stars and 'From 450+ reviews on the App Store', above a screenshot of the App Store 'Ratings and Reviews' page showing ten five-star and four-star reviews dated between 2019 and 2021.
Showing the source is the lesson. The screenshot of the store page tells a reader exactly where the 4.7 comes from and that real reviews stand behind it. The review count and platform are both stated. The dated reviews also give a rough sense of period: the ratings were collected over at least two years.
The weaknesses are about selection and the second number. The screenshot shows only top reviews, so it can't show the spread; a reader sees five-star reviews but not how many low ones exist. The '97% Satisfaction with information given' figure has no source, sample or period on the slide; it seems to come from a separate survey, possibly run by a hospital partner, and should say so. Putting an unsourced percentage beside a sourced rating weakens the sourced one, because a reader can't tell which standard the slide is using.
A review-site rating with quotes and NPS: Dandelion
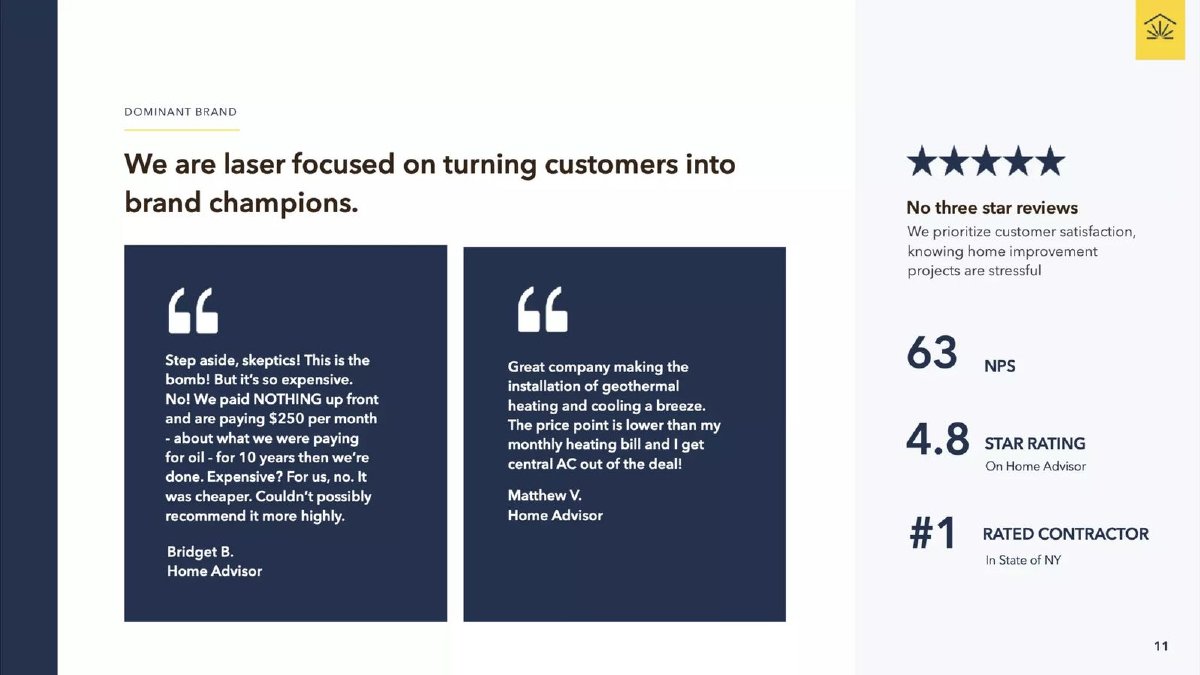
Dandelion Energy, which installs geothermal heating and cooling in homes, has a slide headed 'DOMINANT BRAND' and 'We are laser focused on turning customers into brand champions.' Two quote boxes come from customers credited as 'Bridget B. Home Advisor' and 'Matthew V. Home Advisor'. On the right, under five stars: 'No three star reviews', 'We prioritize customer satisfaction, knowing home improvement projects are stressful', then '63 NPS', '4.8 STAR RATING On Home Advisor' and '#1 RATED CONTRACTOR In State of NY'.
Choosing the platform that buyers actually use is the lesson. A home installer has no app store; HomeAdvisor is where homeowners compare contractors, so a rating there is what a prospective customer would see. Taking the quotes from the same site keeps the evidence consistent. Pairing the public rating with an NPS score also gives two different kinds of satisfaction evidence, one public and one from the company's own survey.
What the slide leaves out matters more than with an app. There is no review count, so a reader can't tell whether 4.8 rests on 20 reviews or 2,000. 'No three star reviews' is ambiguous: it seems to mean no reviews of three stars or lower, but read literally it says nothing about one- and two-star reviews. '#1 RATED CONTRACTOR In State of NY' gives no category, date or basis, so a reader can't check it. NPS 63 has no sample or period. A stronger panel: '4.8 on HomeAdvisor from [n] reviews ([month]); no review below four stars; NPS 63 ([n] respondents, [period]).'
The full breakdown: Everpix
Everpix, a photo storage app, has a slide headed 'Users Love Everpix' that is almost entirely a screenshot of its iTunes App Store page, open on 'Ratings and Reviews'. The page shows 'AVERAGE RATING' with four and a half stars, 'Based on 364 Ratings', and a bar for each star level: 242 five-star, 72 four-star, 18 three-star, 9 two-star and 23 one-star. Below are '204 Customer Reviews' and one review dated Jan 31, 2012. The caption under the screenshot reads: '4.5 stars average on ~1,000 ratings and reviews worldwide'.
Showing the spread is the lesson, and no other example does it. The five bars tell a reader far more than the average: two-thirds of raters gave five stars (242 of 364), and there is a small but distinct cluster of 23 one-star ratings, about 6% (our calculation), which suggests a specific group of unhappy users worth asking about. An investor can see the shape of satisfaction rather than one number.
The breakdown also lets a reader check the average, and it doesn't quite match. Weighting each star level by its count gives about 4.4 (our calculation), which the store displays as four and a half stars because it rounds to half stars. The caption's '4.5 stars average on ~1,000 ratings and reviews worldwide' covers a wider base than the screenshot, which appears to show a single country's store, and adds reviews to ratings. Neither is wrong, but the caption and the image describe different things. Saying so ('364 US ratings shown; ~1,000 worldwide across stores') would remove the doubt.
What to put on the slide
The rating with its count. '4.8 from 17k+ ratings' is the minimum. Lolli and Little Journey give both; Dandelion gives no count.
The platform and date. Which store or site, which country if it matters, and when you took the figure. Little Journey and Dandelion name the platform; none of the four dates the rating clearly.
The spread. The share of five-star and of one- and two-star ratings, or a screenshot of the breakdown. Only Everpix shows it.
The relation to users. Review count as a share of customers, so a reader knows how representative the rating is. Lolli's slide lets a reader work it out.
A behaviour metric beside it. Retention, repeat use or transactions per user. Ratings support these; they don't replace them.
Sources for every superlative. '#1 rated' or 'top rated' needs the ranking, category, source and date.
Where ratings go in the deck
On the traction slide as one supporting metric, or on a customer-love slide beside testimonials. A rating rarely deserves a slide of its own unless the breakdown or the reviews tell a story the numbers don't.
Keep platforms consistent. If you quote the App Store on one slide and Google Play on another, say so; better, give both together.
Don't let it stand in for retention. If the deck has a rating but no retention or repeat-use figure, investors will ask why.
Templates
Basic: '[x.x] on [platform] from [n] ratings, as of [month year].'
Spread: '[a]% five-star, [b]% one- or two-star ([n] ratings, [platform]).'
Representativeness: '[n] ratings from [m] active users ([p]%).'
Superlative: '#[k] in [category] on [platform], [source], [month year].'
What these examples can and cannot show
These four slides show how founders presented customer ratings. They can't show whether the ratings were representative of all customers, whether the companies prompted reviews selectively, or what the ratings are today. We did not check any rating against the live stores or sites. Our calculations depend on the figures shown on the slides.
Treat them as patterns. Lolli gives the rating and count in one line but no platform or date. Little Journey shows the store page but pairs it with an unsourced percentage. Dandelion picks the right platform for its buyers but gives no count and an unsourced '#1'. Everpix shows the full spread, and its own breakdown reveals a slightly lower average than the caption implies.
Common mistakes
No count. A rating with no number of ratings behind it.
No platform or date. 'App store rating' without saying which store or when.
Average only. A single number where the spread would show more.
Unsourced superlative. '#1 rated' with no ranking, category or source.
Rating instead of retention. Satisfaction shown where usage evidence is needed.
Diagnostic checklist
Rating with its count.
Platform and date named.
Spread shown where possible.
Review count related to users.
A behaviour metric beside it.
Frequently asked questions
My rating is only 4.3. Should I leave it out?
If investors can look it up, leaving it out doesn't hide it. Show it with the count and, if it is rising, the trend since a specific product change.
Should I combine App Store and Google Play ratings?
Show both separately with their counts. If you give one combined figure, say how you combined them.
How we chose these examples
Corpus: published pitch deck teardowns on StartupFundraising.com. Founder-uploaded private decks are excluded.
Selection (2026-10-01): we searched extracted text for app store and star rating phrases, set aside healthcare quality scores, duplicate copies and a listed-company deck, and kept four private-company slides each presenting customer ratings differently.
Review: the four slides were rendered from the source decks on 2026-10-01 and read in full at full size against company, deck and slide number; Everpix's rating breakdown was also read enlarged (editorial model review, with AI assistance in drafting; not human-reviewed). Calculations use the slides' stated numbers. No rating was checked against live stores or review sites.