Gross Margin Path in a Pitch Deck: Show Today's Margin
How to show investors how your gross margin gets from today's level to your target: which cost lines move, which lever moves each one, when.
Gross Margin Path: Show Today's Margin, the Target, and the Costs That Move It
Three slides from three real pitch decks try to explain why gross margin will be higher later than it is today. A software company lays out a now-versus-target structure with its numbers hidden, an online-classes company breaks one class into revenue and costs and lists its improvement drivers, and a reconciliation software company defines what it counts as cost of sale. Together they show what a margin path needs, and what each one leaves the investor to guess.
TL;DR
If your gross margin today is below where it needs to be, investors want the path, not just the destination. Show today's margin on a stated revenue basis, the target margin and the date you expect to reach it, each cost line that has to change, the lever that changes it (lower cost per unit, a higher price, a different product or customer mix, better utilization of people or infrastructure), and which part of the movement has already happened versus what is forecast.
None of the three slides below does all of this. Cloudsmith has the clearest now-to-target structure, with the figures blanked out. WhiteHat Jr shows per-class economics and three drivers, only one of which acts on gross margin as its own chart defines it. Duco defines its cost of sale, which is where every margin path should start.
Three real slides that explain a gross margin, or try to
Each slide is shown as it appears in the original deck, followed by what it says, what we checked and what a founder can take from it.
Cloudsmith unit economics slide — slide 36
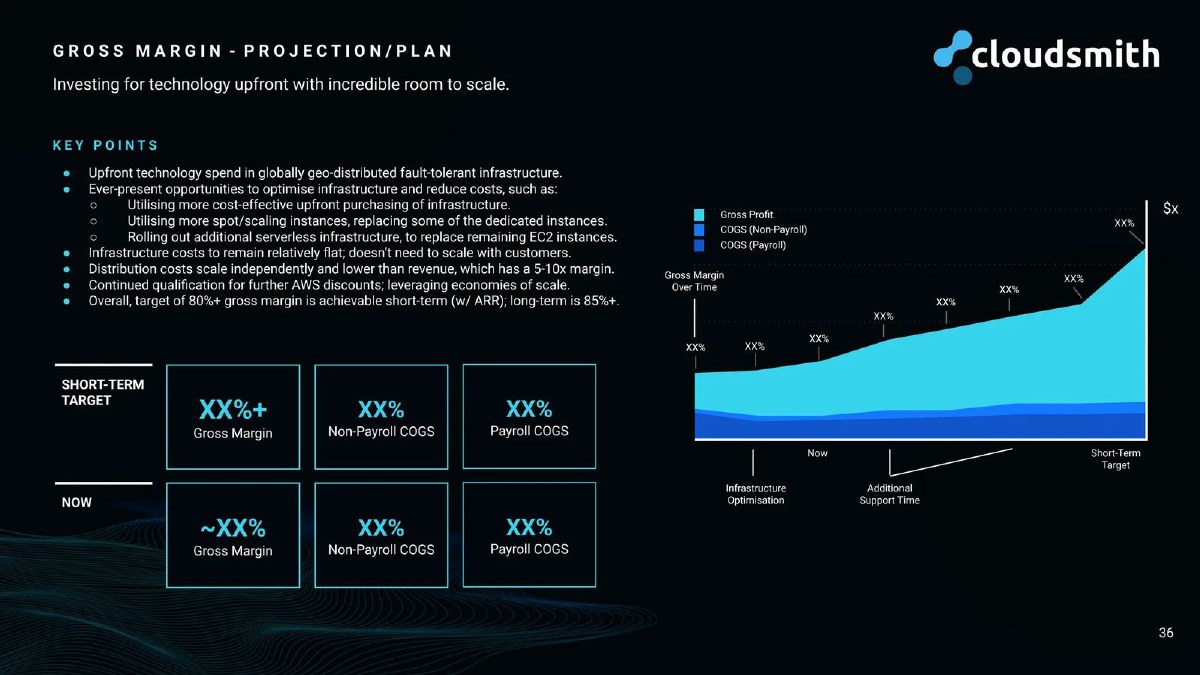
Software package management company. Page headed "Gross Margin – Projection/Plan" in the version of the deck shared publicly, where the figures are replaced with XX.
Cloudsmith deck, slide 36. Exact stored slide matched to this analysis.
Our analysis: The clearest structure among the three: today and target side by side, cost split into payroll and non-payroll, named infrastructure levers, and an argument (flat infrastructure cost as revenue grows) that is a utilization lever, not a cost-per-unit one. With the numbers removed, it shows the shape of a good margin path but cannot prove one.
Evidence and limitation: Every margin and cost value on the page is shown as XX, so we cannot check the size of the gap or of any lever, and we do not estimate them. The only figures printed are the 80%+ short-term and 85%+ long-term targets. No date is given for the short-term target.
What a founder can adapt: Use the same now-and-target boxes with real figures, add a date to the target, and attach each lever to the cost group it changes.
Supporting analysis
What the deck claims: Two rows of boxes, "Now" and "Short-Term Target", each split into Gross Margin, Non-Payroll COGS and Payroll COGS. A chart, "Gross Margin Over Time", shows gross profit above two cost bands (non-payroll and payroll) from "Now" to "Short-Term Target", with "Infrastructure Optimisation" and "Additional Support Time" marked on the timeline. Key points list cheaper upfront purchasing of infrastructure, more spot and scaling instances, more serverless infrastructure replacing remaining EC2 instances, further AWS discounts, "Infrastructure costs to remain relatively flat; doesn't need to scale with customers", and "Overall, target of 80%+ gross margin is achievable short-term (w/ ARR); long-term is 85%+".
Presentation choice: Lays out exactly the boxes an investor wants to fill in: where you are, where you are going, and which cost group moves.
When it does not fit: Don't send a version with placeholders unless you say why the figures are withheld and when they will be shared.
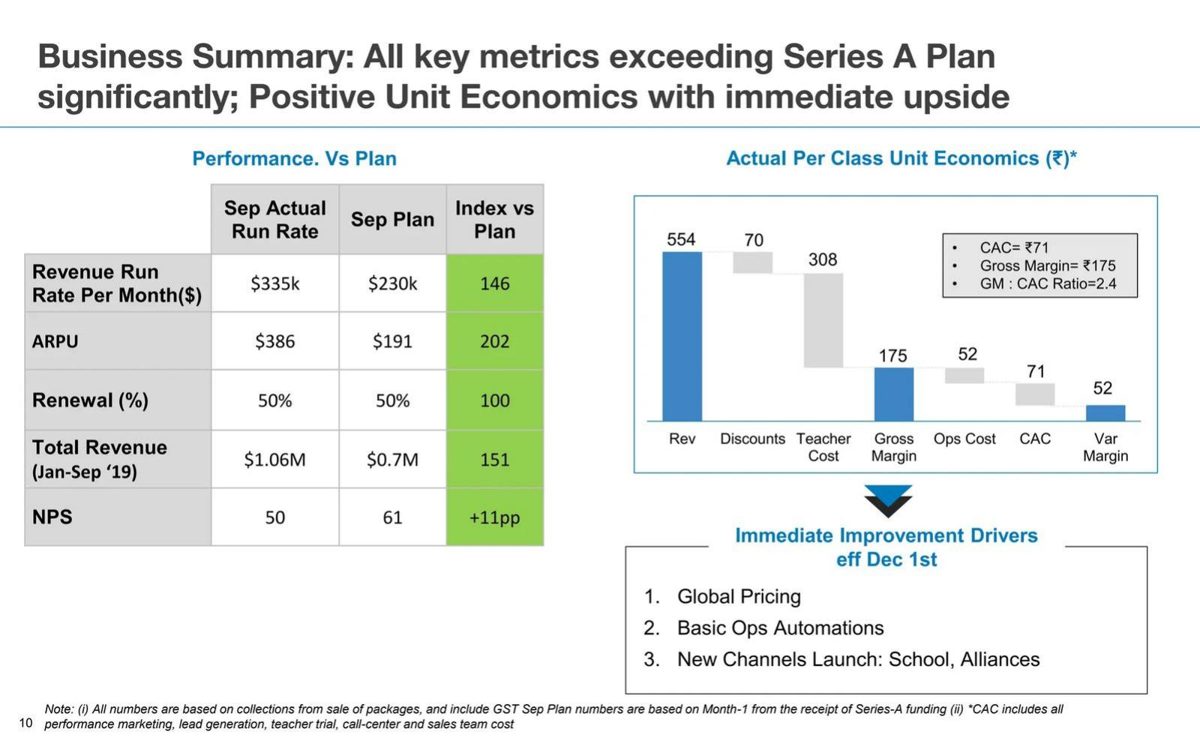
Online coding classes for children; business summary against its Series A plan (Jan–Sep 2019). The same slide appears in our ARPU guide for a different lesson.
WhiteHat Jr deck, slide 10. Exact stored slide matched to this analysis.
Our analysis: An actual per-unit bridge from revenue to margin with the main cost (teachers) visible, plus dated drivers. It shows how a per-unit view makes a margin path concrete, and also how drivers can be listed without saying which cost line each one moves or by how much.
Evidence and limitation: Our arithmetic: 554 − 70 − 308 = 176, against 175 shown (a ₹1 difference, likely rounding). Gross margin as a share of revenue is 175 ÷ 554 = 31.6%; as a share of revenue after discounts it is 175 ÷ 484 = 36.2%, so the stated basis matters. On the slide's own layout, ops cost and acquisition cost sit below gross margin: of the three drivers, global pricing acts on gross margin directly, while ops automation acts on the ₹52 ops cost and new channels on the ₹71 acquisition cost. None of the drivers is quantified. Revenue includes GST, a sales tax, which a margin would normally exclude.
What a founder can adapt: Show one unit of sale as a waterfall, then attach each driver to the bar it changes and give the expected change in that bar.
Supporting analysis
What the deck claims: "Actual Per Class Unit Economics (₹)": a waterfall from Rev 554, minus Discounts 70 and Teacher Cost 308, to Gross Margin 175; then Ops Cost 52 and CAC 71 to Var Margin 52. A box: "Gross Margin= ₹175", "GM : CAC Ratio=2.4". Below: "Immediate Improvement Drivers eff Dec 1st": Global Pricing, Basic Ops Automations, New Channels Launch: School, Alliances. Footnote: numbers are based on collections from sale of packages, including GST.
Presentation choice: A per-unit waterfall lets an investor see the one cost that dominates (teacher cost is 56% of gross revenue per class) and judge whether any lever can move it.
When it does not fit: Don't list improvement drivers under a gross margin figure if most of them change costs below it, and state whether revenue includes tax and discounts.
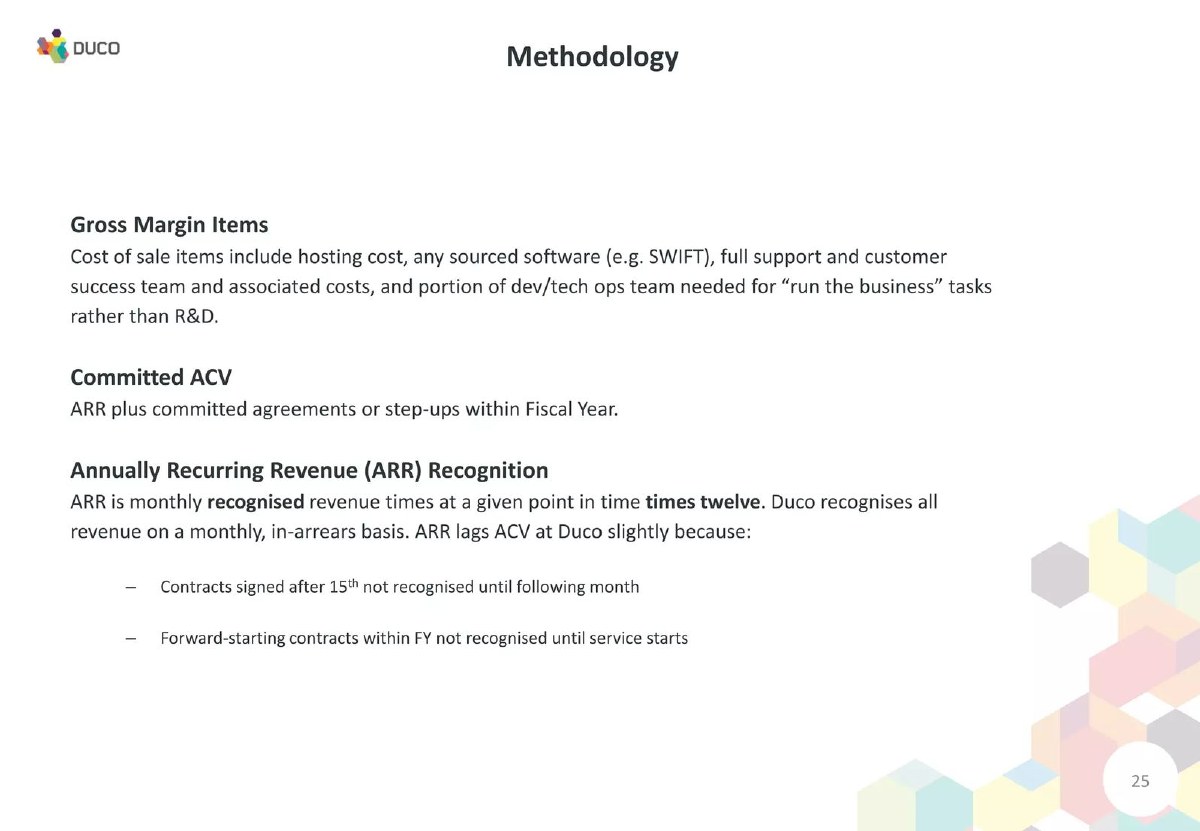
Data reconciliation software for financial institutions; a "Methodology" page near the end of the deck (printed page number 25, file page 26).
Duco deck, slide 26. Exact stored slide matched to this analysis.
Our analysis: The starting point for any margin path. Once the definition is stated, a reader can tell whether a later improvement comes from real savings or from moving costs between categories.
Evidence and limitation: A definition only; the page has no margin figure. It puts the whole support and customer success team, and part of the engineering and operations team, into cost of sale, which is a conservative choice: a company that left those people in operating expenses would report a higher gross margin for the same business.
What a founder can adapt: Add a one-line definition of cost of goods sold to your margin slide or appendix, including how you split shared engineering or operations staff.
Supporting analysis
What the deck claims: "Gross Margin Items: Cost of sale items include hosting cost, any sourced software (e.g. SWIFT), full support and customer success team and associated costs, and portion of dev/tech ops team needed for 'run the business' tasks rather than R&D." The page also defines committed ACV and how ARR is recognised.
Presentation choice: Investors compare margins across companies; a stated definition shows yours is comparable and that a future improvement will not come from reclassification.
When it does not fit: Don't change the definition between the current and target margin; if you must, restate the current margin on the new basis.
What each slide explains and what it leaves unknown
Our reading of each slide against the five things a margin path should show. "Partly" means present but incomplete.
Slide
Definition
Today's margin by cost line
Target and date
Lever per cost line
Actual vs forecast
Cloudsmith p36
Partly (payroll / non-payroll)
Hidden (XX)
Partly (80%+ short-term, undated)
Yes (infrastructure levers)
Partly (labelled plan)
WhiteHat Jr p10
Partly (discounts, teacher cost)
Yes (per class, actual)
No
Partly (drivers unquantified)
Yes (actual; drivers dated)
Duco p26
Yes
No
No
No
Not applicable
Key Takeaways
Define what is in cost of goods sold before you show any margin.
Show today's margin and the target on the same revenue basis.
Name each cost line that moves, and the lever that moves it.
Separate cost-per-unit savings, price changes, mix and reclassification.
Label forecast periods; don't present a planned margin as achieved.
Levers interact: compute the combined effect instead of adding points.
Build your margin bridge
Fill in one row per cost line, on one revenue basis. If a column is blank for a line that moves, the slide is not ready.
Definition. What is in cost of goods sold, including how shared staff are split. Same definition today and at target.
Revenue basis. Gross bookings, net of discounts, or recognised revenue; excluding taxes. Use it for every percentage.
Cost line today. Each line as a percentage of that revenue, with the period (for example, last quarter).
Cost line at target. The same line at the target date.
Lever and type. What changes it: cost per unit, price, mix, utilization, or reclassification.
Evidence. Already measured, contracted, piloted, or assumed.
Date. When the change takes effect.
Combined result. Recompute the margin with all changes together; don't add the points.
Copyable framework: Gross margin [x]% today ([period], on [revenue basis]; COGS = [definition]). Target [y]% by [date]: [cost line] [a]% to [b]% via [lever, type, evidence]; [cost line] [c]% to [d]% via [lever, type, evidence]. Forecast periods marked (F).
Illustrative example 1 — written by us
Before: Target of 80%+ gross margin is achievable short-term.
After: Gross margin [x]% today (last quarter, recognised revenue). Target 80% by [date]: non-payroll COGS [a]% to [b]% (reserved and spot infrastructure, cost per unit; [evidence]); payroll COGS [c]% to [d]% (support time spread over more revenue, utilization).
What improved: Built on Cloudsmith's page 36 structure; bracketed values are placeholders, not Cloudsmith's figures. Adds a date, a basis and a lever type to each cost group.
Illustrative example 2 — written by us
Before: Gross margin ₹175 per class. Improvement drivers: global pricing, ops automation, new channels.
After: Gross margin ₹175 per class (36% of revenue after discounts, including GST). Global pricing: [expected change] to revenue per class. Ops automation and new channels act on ops cost (₹52) and acquisition cost (₹71), below gross margin.
What improved: Uses WhiteHat Jr's page 10 figures; the pricing effect is a placeholder. Attaches each driver to the line it changes.
What this guide covers and what it doesn't
This guide is about one task: explaining the movement from today's gross margin to a target. Our gross margin guide covers which margin to show, which revenue it is measured against and over what period; read it first if you are unsure what your margin figure means. The cost-at-volume guide covers how the cost of one unit falls as volume rises. The contribution margin guide covers the variable costs below gross margin.
A margin path draws on all three, but answers a different investor question: if the margin is 55% today and you say 75% in two years, what exactly changes, why, and how sure are you?
Five things a margin path should show
Our framework, used throughout this guide.
Definition. List what goes into cost of goods sold (hosting, payment fees, third-party software, support staff, delivery labour, materials). Gross margin is revenue minus cost of goods sold, divided by revenue; what you put into cost of goods sold decides the number. If you move people or tools between cost of goods sold and operating expenses, say so, because the margin changes without anything getting cheaper.
Today's margin, by cost line. Give the current margin with its period and its revenue basis (gross bookings, net revenue after discounts, recognised revenue). Show each cost line either as an amount or as a percentage of that same revenue. Shares of total cost are useful for mix, but they cannot be added up to a margin.
Target and date. The target margin, the period you expect to reach it, and whether it is a plan or something you have already reached in a recent month.
Lever per cost line. For each line that moves, name what moves it and which kind of change it is: a lower cost per unit (a cheaper supplier, automation, reserved infrastructure), a higher price, a shift in product or customer mix, better utilization of fixed capacity, or a reclassification. These behave differently and carry different risks.
Evidence and status. For each lever, what you have already done or measured (a signed supplier contract, a pilot, a price test, a month already at the new cost) and what is still assumed. Mark forecast periods clearly, for example with (F) after each forecast period. (Corporate Finance Institute)
Why different levers are not interchangeable
A lower cost per unit improves margin on every sale it applies to, but often needs volume, contracts or engineering time first. A price increase raises revenue on the same costs, so it improves margin by less than the percentage increase suggests, and it can reduce sales. A mix shift (more of a high-margin product, more paying users versus free users, larger customers) changes the average margin without making anything cheaper, and reverses if the mix moves back. Better utilization spreads costs that don't change with volume, such as a support team or reserved servers, across more revenue, and only holds while growth continues. A reclassification changes the reported margin and nothing else.
Investors weigh these differently. A path that rests on signed supplier pricing is easier to believe than one that rests on a future price increase, and a path that rests on reclassification is not a path at all. Labelling each lever by type lets the reader judge the plan instead of guessing at it.
Worked example: a margin bridge from 67% to 75%
Hypothetical example, invented for illustration; the numbers are not from any deck. A software company has $100 of net revenue (after discounts) per customer per month. Its cost of goods sold per $100 of revenue is: hosting $14, customer support staff $10, third-party software $6, payment fees $3, a total of $33. Gross margin is (100 − 33) ÷ 100 = 67%.
Plan for the next 18 months. Hosting: move steady workloads to reserved capacity, cutting hosting from $14 to $10 per $100 of revenue (a cost-per-unit change; one month already measured at $11). Support: a help-centre and ticket automation project expected to cut support from $10 to $7 (a utilization change for a fixed team; not yet started). Price: a 5% list-price increase for new customers (a price change; tested on one segment).
Combined effect. With the two cost changes, cost of goods sold is $10 + $7 + $6 + $3 = $26 on $100 of revenue, so margin is 74%. Add the price increase on the same volume and costs: revenue $105, costs $26, margin (105 − 26) ÷ 105 = 75.2%. The price increase adds 1.2 points here, not 5. Applied first, before the cost changes, it would add 1.6 points ((105 − 33) ÷ 105 = 68.6%). So the contribution of each lever depends on the order you count them in; the slide should show the combined result and say how the split was made.
Payment fees usually scale with price, so a fuller model would raise them slightly with the price increase. The example keeps them flat to keep the arithmetic visible; your slide should not.
Amounts or percentages: pick one basis and say which
Cost lines can be shown in three ways: as amounts (dollars per month or per unit), as percentages of revenue, or as shares of total cost. The first two can be turned into a margin; the third cannot. WhiteHat Jr's chart shows amounts per class, which can be turned into percentages, but its margin percentage depends on whether discounts are taken out of revenue first.
Our recommendation: show cost lines as percentages of the same revenue figure the margin uses, and add the amounts in a note if they help.
Common mistakes
A target with no starting point. A target margin without today's margin and period gives the investor nothing to measure the plan against.
Adding lever effects. Price and cost changes interact; recompute the combined margin rather than adding the points from each lever.
Mixing revenue bases. A margin on gross revenue and a target on net revenue are not comparable. Use one basis and say which.
Improvement by reclassification. Moving support or operations staff out of cost of goods sold raises reported margin without saving anything. Keep the definition fixed.
Drivers attached to the wrong line. Savings in sales, marketing or general operations do not change gross margin. List them on the slide where they belong.
Forecast shown as achieved. Label forecast periods and planned savings, and say which levers are already measured.
Diagnostic checklist
Cost of goods sold is defined, and the definition is the same today and at target.
Today's margin has a period and a stated revenue basis.
The target margin has a date.
Each cost line is shown as an amount or as a percentage of the same revenue.
Each moving cost line has a named lever and its type.
Each lever is marked as measured, contracted, piloted or assumed.
The combined target margin is recomputed, not added up.
Forecast periods are labelled.
Frequently asked questions
Should I show my margin path as percentages or amounts?
Percentages of revenue make the path readable as margin points; amounts help when costs are mostly fixed and revenue is growing. Whichever you choose, keep one revenue basis, and don't show cost lines as shares of total cost if you want the reader to see margin points.
Can I include free users in my margin?
Show both. A margin on paying users only shows the economics of a sale; a margin including free users shows what the business earns overall. Free users generate no revenue but still use infrastructure, so the gap between the two figures is the cost of the free tier.
Is a price increase a margin lever?
Yes, but its effect on margin is smaller than the percentage increase (costs stay the same while revenue rises), and it can change how many customers buy. Show it separately from cost savings.
How we chose these examples
Discovery (2026-10-03): the topic qualified in a bounded opportunity review that reassessed an earlier rejection based on an unnecessarily strict slide-count rule. Candidates came from the durable corpus index (gross margin, COGS, margin target with named drivers), then each original slide was inspected. Closest existing content checked: the published gross margin guide (which margin, revenue basis, period), the published cost-at-volume guide (unit cost falling with volume), the contribution margin guide and the cross-slide consistency draft; none teaches a now-to-target margin bridge by cost line.
Three pages are used, each rendered from the original deck file and read from the image: Cloudsmith 36, WhiteHat Jr 10 and Duco 26. Two images are new uploads at 1200px wide; the WhiteHat Jr image was already stored and was checked against the original. All three companies have live teardown pages, none appears in our corpus exclusions, and no removal or deletion request names them. Figures were checked by recalculation where the slide allows it; chart values not printed on the slide are given only as approximate readings and labelled as such, and Cloudsmith's hidden figures are not estimated.
Company figures are not verified. The worked example is invented and labelled. Classifications and recommendations are our editorial reading, not financial or accounting advice. Drafted with AI assistance and checked by an editorial model against the slide images; not reviewed by a person.