Store and Location Economics in a Pitch Deck: Site Profit
If you open stores, clinics, venues or hotels, show one location's opening cost, ramp, site profit after rent, and what head office costs on top.
Location Economics in Your Pitch Deck: How to Show What One Store, Site or Venue Really Earns
Six slides from three real pitch decks present the economics of a physical location: a hotel-and-coworking clubhouse, a sneaker store chain and a gaming venue. They show how easily a site-level figure, a planned site and the company's overall result get mixed together, and what an investor needs to tell them apart.
TL;DR
For a business that grows by opening locations, investors want one location's economics laid out so they can rebuild them: what it costs to open, how long it takes to reach normal sales, what it earns at the site after rent, and what head office costs on top of all the sites. Label every column as actual, mature or planned.
In the slides below, Onda's table does most of this well: it puts its operating location's actual trailing twelve months beside a mature estimate and a planned site, line by line. But its headline numbers on page 7 come from the planned site, its first location pays no rent, and three different profit figures for the same period appear on different pages. Impossible Kicks shows a clean month-by-month revenue ramp for seven stores but no store profit or opening cost. WeArena gives a profit-margin target with nothing to check it against.
Six real slides that present a location's economics
Each example shows the exact slide discussed. Quotations are from the slide; "our reading" and "our calculation" mark interpretation. Company figures are as presented in the decks and are not verified.
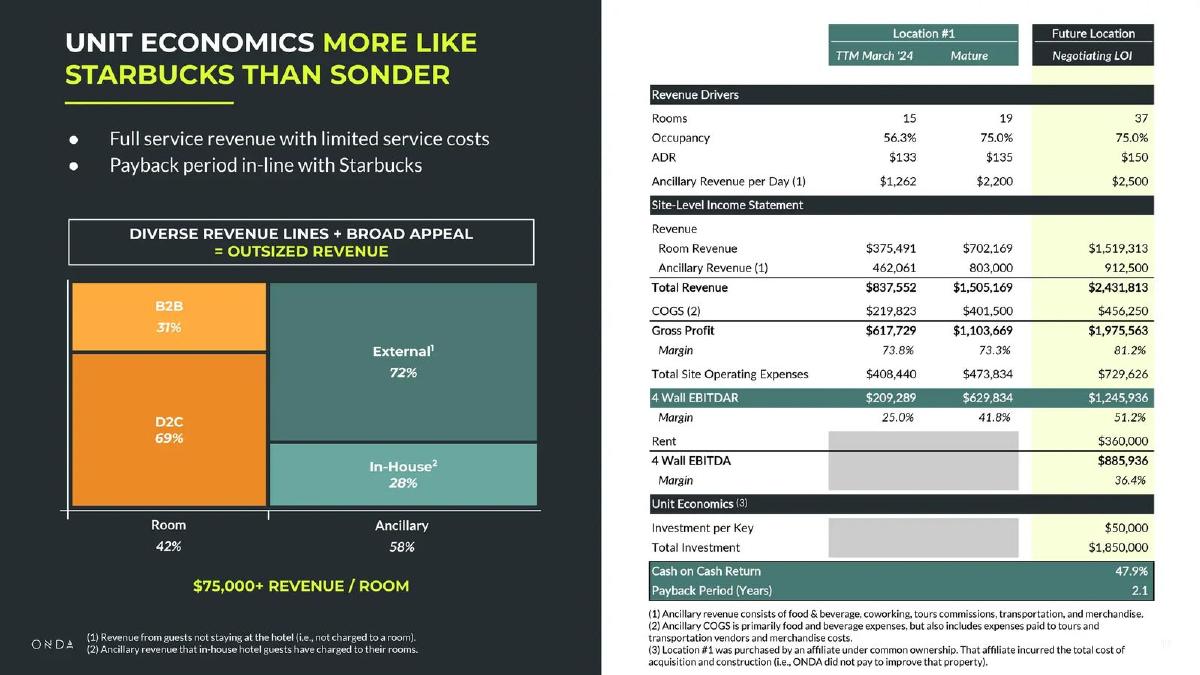
Onda unit economics slide — slide 17
Hospitality company running clubhouses for remote workers, 2024 deck. A page headed "Unit Economics More Like Starbucks Than Sonder".
Onda deck, slide 17. Exact stored slide matched to this analysis.
Our analysis: A site-level table with actual, mature and planned columns side by side. The operating site's figure is before rent, and the only after-rent figure and payback belong to a site not yet signed.
Evidence and limitation: Our calculations: 37 rooms × $50,000 = $1,850,000; $1,245,936 − $360,000 = $885,936; $885,936 ÷ $1,850,000 = 47.9%; $1,850,000 ÷ $885,936 = 2.1 years. All match. The mature column's EBITDAR ($1,103,669 − $473,834) is $629,835, a $1 rounding difference. The mature column also assumes 19 rooms, not 15, and 75% occupancy against 56.3% actual; the slide does not say how the extra rooms come about. The comparison with Starbucks's payback is not sourced on the slide.
What a founder can adapt: Copy the three-column layout. Add a market-rent line for any site that pays no rent, give the opening cost of the operating site (even if an affiliate paid it), and state what changes between actual and mature.
Supporting analysis
What the deck claims: Three columns: "Location #1 TTM March '24", "Mature" and "Future Location Negotiating LOI". Rooms 15, 19 and 37; total revenue $837,552, $1,505,169 and $2,431,813; "4 Wall EBITDAR" $209,289 (25.0%), $629,834 (41.8%) and $1,245,936 (51.2%). Rent and "4 Wall EBITDA" appear only for the future location: rent $360,000, EBITDA $885,936 (36.4%). "Investment per Key $50,000", "Total Investment $1,850,000", "Cash on Cash Return 47.9%", "Payback Period (Years) 2.1". Footnote 3: Location #1 was bought by an affiliate under common ownership, which paid acquisition and construction costs.
Presentation choice: Separates actual from planned in the column headers, shows every line from rooms to profit, and discloses in a footnote why the operating site has no rent or investment line.
When it does not fit: Don't let the only payback and after-rent profit come from the planned column without saying so in the headline.
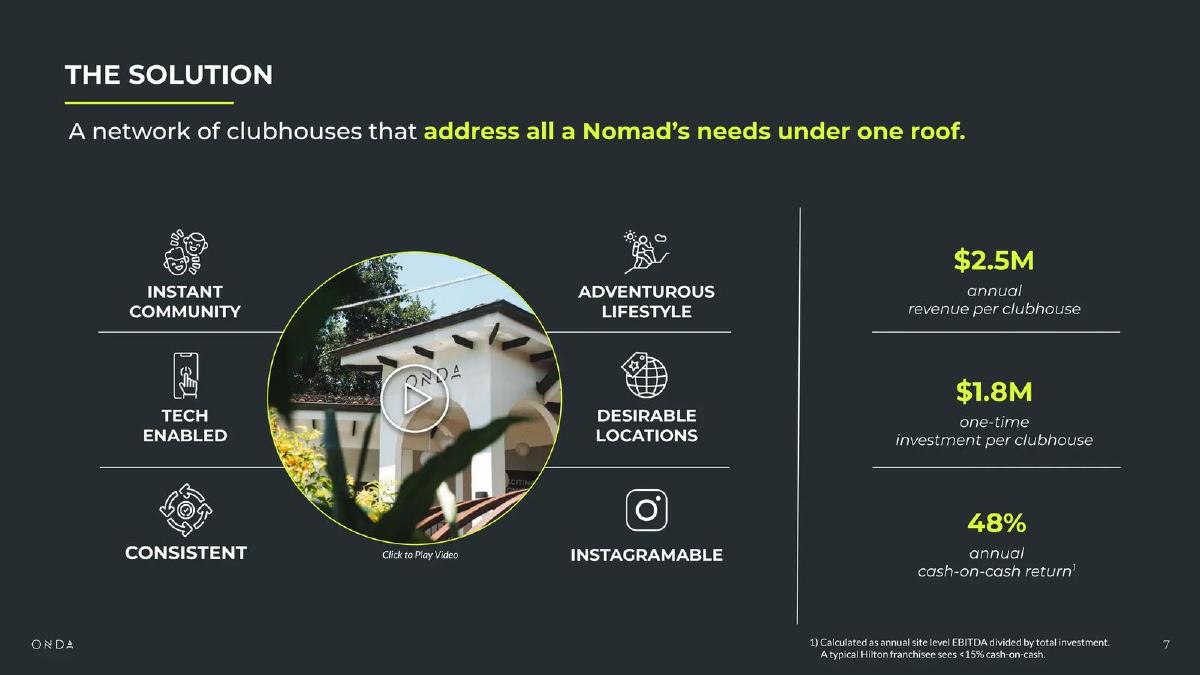
Same deck, "The Solution", ten pages before the table.
Onda deck, slide 7. Exact stored slide matched to this analysis.
Our analysis: A planned site's figures presented as a general per-clubhouse fact.
Evidence and limitation: Our reading: the three headline figures match the "Future Location — Negotiating LOI" column on page 17 ($2,431,813 revenue, $1,850,000 investment, 47.9% cash-on-cash), not the operating location, whose trailing revenue is $837,552. Page 7 does not say the figures are for a planned site.
What a founder can adapt: Write the basis beside the headline: "planned 37-room site under LOI" or "Location #1, trailing twelve months". If the planned site is the better illustration, give the operating site's figure next to it.
Supporting analysis
What the deck claims: "$2.5M annual revenue per clubhouse", "$1.8M one-time investment per clubhouse", "48% annual cash-on-cash return". Footnote: "Calculated as annual site level EBITDA divided by total investment."
Presentation choice: The footnote defines the return, which many decks don't, and the figures can be traced to a full table later in the deck.
When it does not fit: Don't quote a planned site's revenue as "annual revenue per" location without a label.
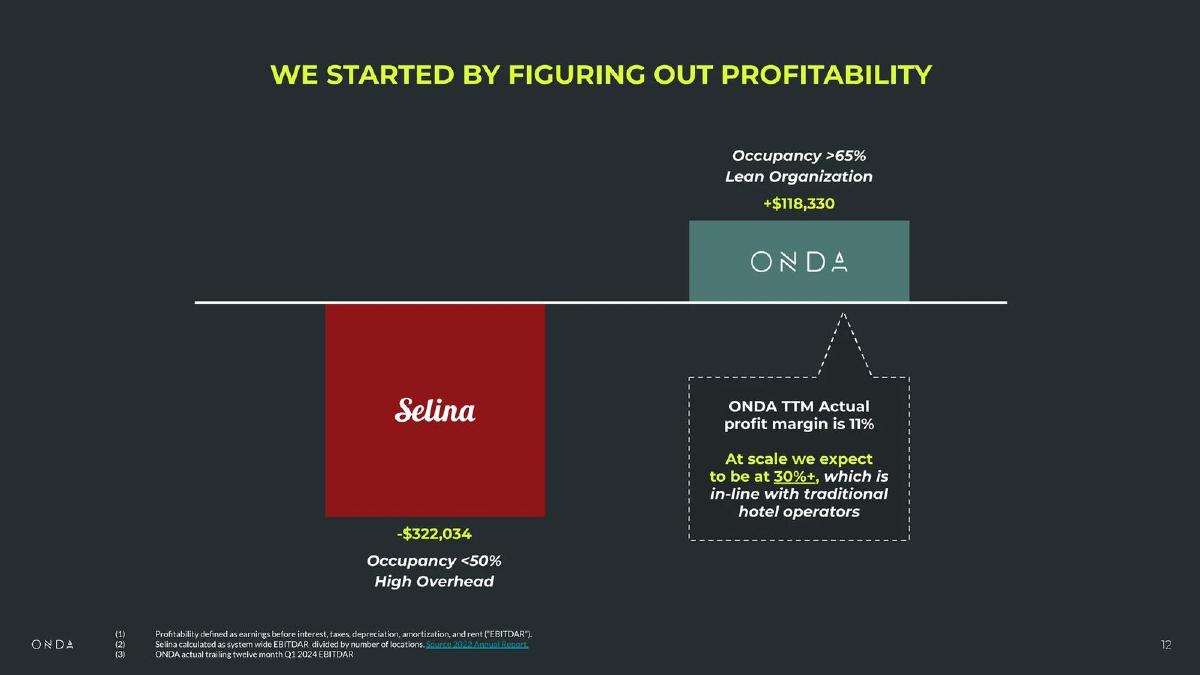
Same deck, "We Started by Figuring Out Profitability".
Onda deck, slide 12. Exact stored slide matched to this analysis.
Our analysis: A company-level result for a one-site company compared with a competitor's system-wide average per location, using a third profit figure for the same period.
Evidence and limitation: Our calculations: $118,330 ÷ $837,552 (page 17's trailing revenue) = 14.1%, not 11%; the slide does not say which revenue the 11% uses. Page 17 gives the same location's trailing four-wall EBITDAR as $209,289. The $90,959 difference is consistent with company costs outside the site, but the deck does not say so. We did not check Selina's annual report.
What a founder can adapt: Reconcile on one page: site EBITDAR, less head office, equals company EBITDAR, with the margin on stated revenue. Compare like with like: a competitor's average per location against yours.
Supporting analysis
What the deck claims: Selina "-$322,034" ("Occupancy" under 50%, "High Overhead") against Onda "+$118,330" ("Lean Organization"). Callout: "ONDA TTM Actual profit margin is 11%. At scale we expect to be at 30%+". Footnotes: profitability defined as EBITDAR; Selina "calculated as system wide EBITDAR divided by number of locations" from its 2022 annual report; Onda "actual trailing twelve month Q1 2024 EBITDAR".
Presentation choice: Defines the profit measure in a footnote and names the source of the competitor figure, so the comparison can be checked.
When it does not fit: Don't show three profit figures for the same period on three pages without a bridge between them.
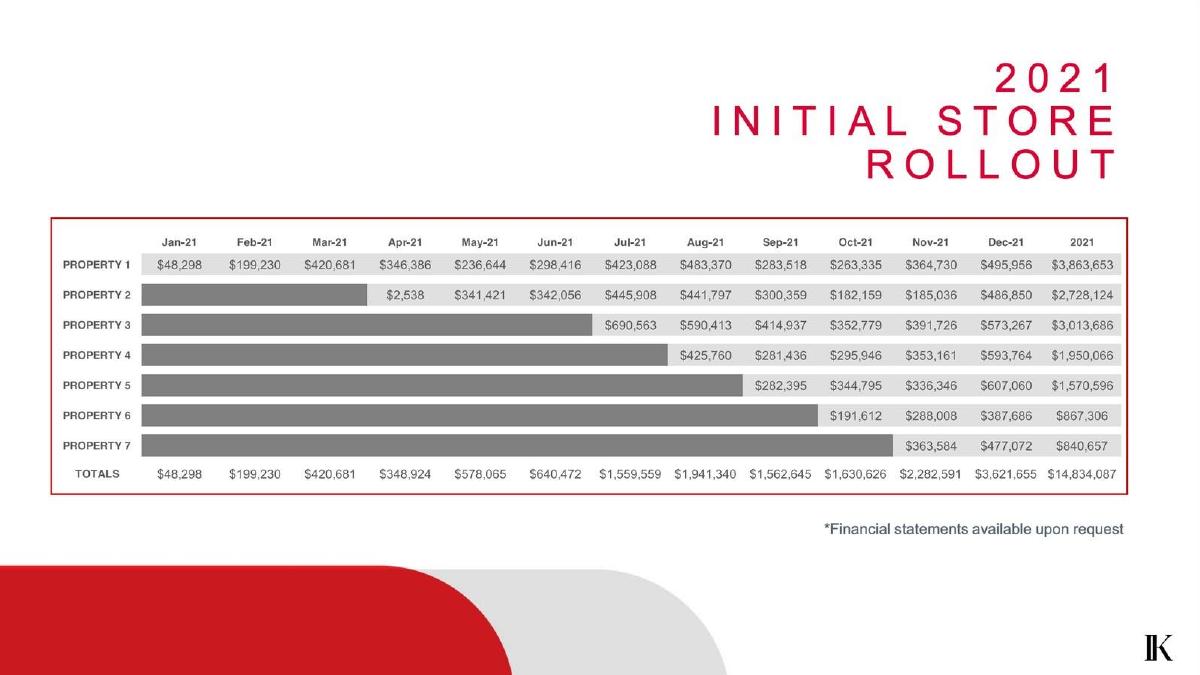
Sneaker resale store chain, 2022 deck. "2021 Initial Store Rollout".
Impossible Kicks deck, slide 18. Exact stored slide matched to this analysis.
Our analysis: A clean revenue ramp by location and month, with no store profit, rent, inventory or opening cost.
Evidence and limitation: Our calculations: the property totals add to $14,834,088, a $1 rounding difference. Counting each month a store traded, there are 41 store-months (Property 2's first month is $2,538), so the average is about $361,800 a month, roughly $4.3 million a year per store. December's average across seven stores is about $517,400 a month, but December is a holiday month and every store peaks there. The figures are labelled 2021 but not stated to be audited.
What a founder can adapt: Add store-level profit after rent beneath the revenue for at least the oldest stores, and the opening cost per store, including inventory for a resale business.
Supporting analysis
What the deck claims: Monthly sales for seven properties from January to December 2021, each starting in its opening month: Property 1 $3,863,653 for the year; Property 3 opened in July at $690,563; Property 7 opened in November. Totals by month, ending at $3,621,655 in December, and $14,834,087 for the year. "*Financial statements available upon request".
Presentation choice: Shows every store from its first month, so a reader can see ramp, seasonality and the effect of adding stores without relying on an average.
When it does not fit: Don't annualize a peak month or a newly opened store's best month as the run rate.
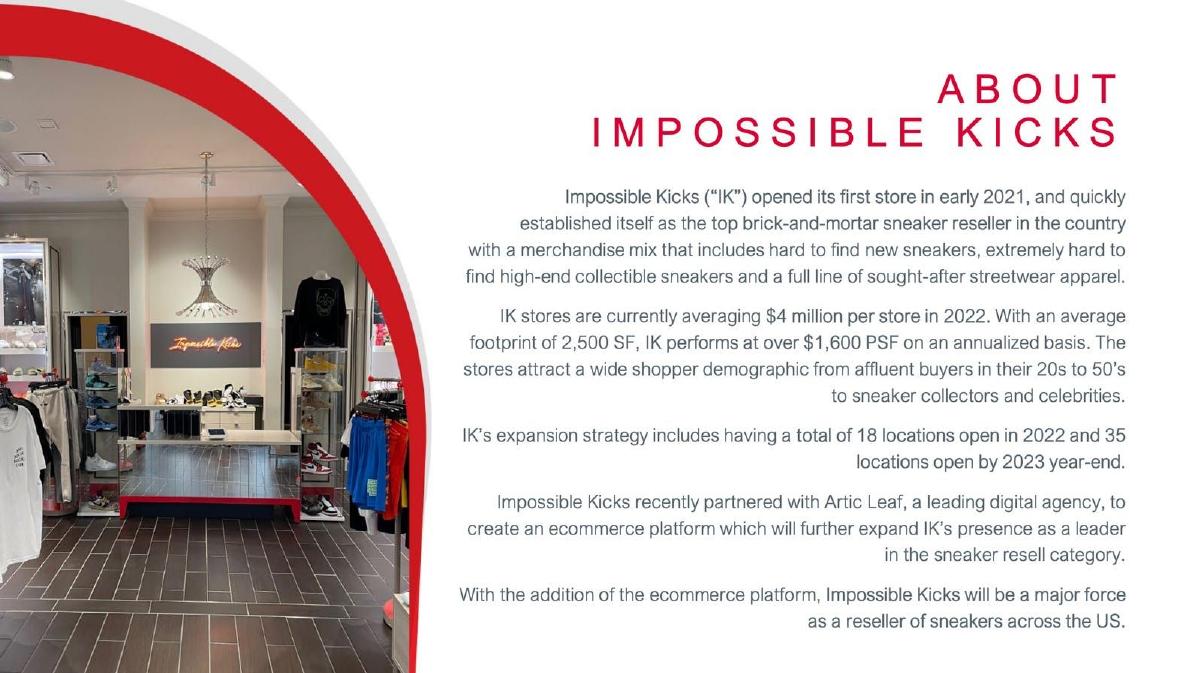
Impossible Kicks deck, slide 2. Exact stored slide matched to this analysis.
Our analysis: An annualized sales average quoted without its basis, beside a rollout plan that makes most stores new.
Evidence and limitation: Our calculations: $4,000,000 ÷ 2,500 sq ft = $1,600 per sq ft, matching. The slide does not say which months of 2022 the average uses or how new stores are counted. Going from 7 stores to 18 in 2022 and 35 by the end of 2023 means 11 and then 17 openings in a year.
What a founder can adapt: State the basis: stores open twelve months or more, which months, and the range across stores. Show how many stores in the plan will still be ramping at each year end.
Supporting analysis
What the deck claims: "IK stores are currently averaging $4 million per store in 2022. With an average footprint of 2,500 SF, IK performs at over $1,600 PSF on an annualized basis." Expansion: "a total of 18 locations open in 2022 and 35 locations open by 2023 year-end."
Presentation choice: Gives sales per square foot, which lets a reader compare stores of different sizes and check against retail benchmarks.
When it does not fit: Don't quote an annualized average that mixes mature and newly opened stores without saying so.
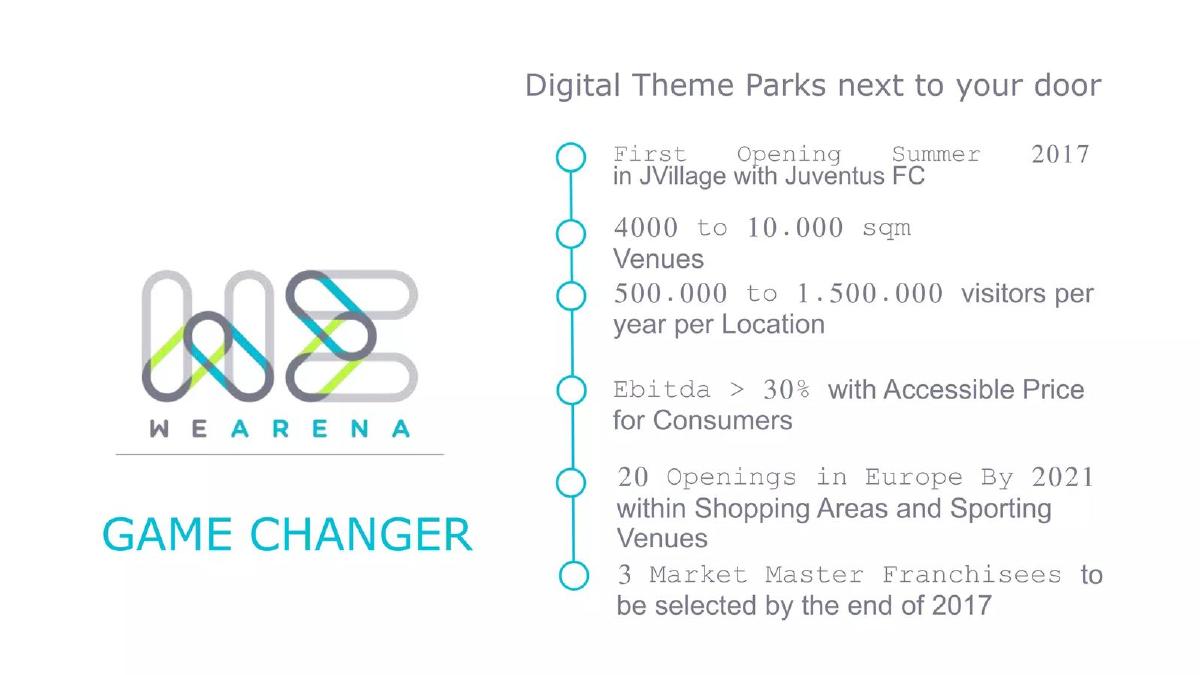
Gaming and digital theme-park venue company, 2017 deck presented at the MAPIC retail property fair. "Digital Theme Parks next to your door", headed "Game Changer".
WeArena deck, slide 13. Exact stored slide matched to this analysis.
Our analysis: A planned location described by size, visitors and a margin target, without the lines needed to test it.
Evidence and limitation: All figures are targets before the first opening. The visitor range spans a factor of three and no revenue per visitor, venue cost or rent is given, so the margin cannot be rebuilt. Venue size is in square metres; the slide uses European number formatting.
What a founder can adapt: Turn the targets into one planned-venue table: visitors × spend per visitor = revenue; less staff, content and rent; equals EBITDA. Label it planned and show the low end of the visitor range.
Supporting analysis
What the deck claims: "First Opening Summer 2017 in JVillage with Juventus FC"; "4000 to 10.000 sqm Venues"; "500.000 to 1.500.000 visitors per year per Location"; an "Ebitda" margin above 30% "with Accessible Price for Consumers"; "20 Openings in Europe By 2021"; "3 Market Master Franchisees to be selected by the end of 2017".
Presentation choice: Gives the physical scale of a venue and a visitor range, which are the starting inputs for a location model, and dates the first opening.
When it does not fit: Don't state a margin target without the revenue and costs that produce it.
Our reading of each slide against the four numbers that describe a location. "Partly" means present but incomplete.
Slide
Opening cost
Ramp
Site profit after rent
Head office separated
Basis labelled
Onda p17
Planned site only
Partly (actual vs mature)
Planned site only
No
Yes (column headers)
Onda p7
Planned site
No
Planned site
No
No
Onda p12
No
No
No (before rent)
Partly (implied by gap)
Partly (footnotes)
Impossible Kicks p18
No
Yes (monthly by store)
No
No
Yes (2021)
Impossible Kicks p2
No
No
No
No
No
WeArena p13
No
No
No (margin target)
No
Partly (dated plan)
Key Takeaways
Show one location as a table: opening cost, revenue, site costs, rent, site profit.
Label each column: actual (with period), mature (with the assumption that gets you there) or planned.
Quote headline numbers from an operating site, or say clearly that they are a plan.
Show site profit after rent. If a site pays no rent, say so and show a market-rent version.
Show head-office cost separately and the number of sites needed to cover it.
Show ramp: months from opening to normal sales, from your own openings.
Use one profit definition across the deck, or reconcile the different ones on the page.
Build your one-location table
Fill this in for your best operating location and, separately, for your planned next one. If a line is blank, the slide is not ready.
Basis. Actual (which months), mature (what assumption) or planned (what stage: lease signed, LOI, idea).
Opening cost. Build-out, equipment, deposits, initial inventory and pre-opening spending, with who paid.
Ramp. Months from opening to normal monthly sales, from your own openings.
Revenue. With its drivers: customers, visits, rooms, occupancy, price, sales per square foot.
Site costs before rent. Cost of goods, site labour, utilities, other site operating costs.
Rent. Actual rent, or a market-rent estimate if the site is owned or rent-free.
Site profit after rent. Amount and margin, with the profit measure named.
Head office. Annual cost not at any site, and the number of mature sites needed to cover it.
Copyable framework: [Location], [actual months / mature / planned]: opening cost [$x] incl. [$y] pre-opening; reaches normal sales in [n] months; revenue [$r]; site profit after rent [$p] ([m]%). Head office [$h] a year = [k] mature sites to break even.
Illustrative example 1 — written by us
Before: $2.5M annual revenue per clubhouse. 48% annual cash-on-cash return.
After: Planned 37-room site (LOI stage): $2.4M revenue, 48% cash-on-cash after $360K rent. Our operating 15-room site, trailing 12 months: $0.84M revenue, $0.21M site profit before rent (rent-free, affiliate-owned).
What improved: Built only from figures on Onda's pages 7 and 17. Labels the planned site and puts the operating site beside it, including the rent caveat.
Illustrative example 2 — written by us
Before: Stores averaging $4 million per store.
After: Hypothetical: Stores open 12+ months average $[x]M a year (range $[a]M to $[b]M). New stores reach normal monthly sales in [n] months. Store profit after rent: $[p] ([m]%).
What improved: Invented for illustration; bracketed values are placeholders. States which stores the average covers and adds ramp and profit.
Why location businesses get their own kind of scrutiny
A chain of stores, clinics, gyms, hotels or venues grows by repeating one unit. If one location makes money after its own costs and rent, and the company can open more at a known cost, the business case is a multiplication. That is why founders put a single-location profit figure on the slide, and why investors test it hard.
The trouble is that a location profit figure is usually not the company's profit. Public restaurant companies make this explicit. CAVA's FY2024 annual report defines restaurant-level profit as revenue less food, beverage and packaging, labor, occupancy and other operating expenses, excluding depreciation and amortization, and says it also excludes pre-opening costs. Head-office costs sit outside it. A startup's "four-wall" or site-level figure works the same way, but in a pitch deck the definitions are rarely written down.
This guide is about laying out one location so an investor can tell site profit from company profit, a working site from a planned one, and an opening month from a mature one. Two neighbouring guides cover related ground: the payback period guide explains the different meanings of payback, including payback on a location; the contribution margin guide covers which variable costs belong below the line. Franchise economics, where someone else funds the location, has its own guide. (CAVA Group, Inc. (SEC EDGAR))
Four numbers that describe one location
Our framework, used throughout this guide.
Opening cost: build-out, equipment, deposits and pre-opening spending such as hiring and training before the first sale. CAVA reports pre-opening costs separately from restaurant-level profit, which is a useful habit: if you leave them out of site profit, show them in the opening cost.
Ramp: how sales and costs behave in the first months. CAVA's risk factors say labor and operating costs for a newly opened restaurant are materially greater in the first six months, and that new restaurants take time to reach planned operating efficiency. Your investor will assume the same of yours unless your own openings show otherwise.
Mature site profit: revenue less the site's own costs and rent, once ramp is over. State which costs are inside. If you quote a figure before rent (often called EBITDAR), say so and show rent on the next line.
Head office: everything not at a site, such as management, marketing, technology and the team opening new locations. Divide it by mature site profit and you get the number of sites needed before the company as a whole breaks even (our calculation method; worked example below). (CAVA Group, Inc. (SEC EDGAR))
Worked example: from one site to the company
Hypothetical example, invented for illustration; the numbers are not from any deck. A fitness studio chain spends $400,000 to open a studio, including $40,000 of pre-opening costs. A mature studio has revenue of $900,000 and site costs of $500,000 before rent, so site profit before rent is $400,000. Rent is $150,000, leaving site profit after rent of $250,000, a 27.8% margin.
Payback on the opening cost is $400,000 ÷ $250,000 = 1.6 years once mature. If the first six months run at half of mature profit, the studio earns $62,500 in that half-year instead of $125,000, adding about three months: payback is roughly 1.85 years from opening.
Head office costs $1.5 million a year. $1,500,000 ÷ $250,000 = 6 mature studios to cover it. With four studios open, two of them still ramping, the company loses money even though every mature studio is profitable. Both statements belong on the slide.
Actual, mature and planned: keep them in separate columns
The most useful habit on any location slide is a column header that says where each number comes from. An operating site's trailing twelve months is evidence. A mature estimate for the same site is a forecast built on that evidence. A planned site under negotiation is a plan. Investors weigh them differently, so they should never share a column or a headline.
When the headline number on an early slide comes from the planned column, say so beside it. A reader who sees "annual revenue per clubhouse" will assume it is what a clubhouse earns now.
Forecasts and plans can teach how to present a location model, as long as they are labelled. In this guide, every planned or target figure is marked as such and none is treated as a measured result.
Common mistakes
Planned site as headline. Quoting a site under negotiation as what a location earns.
Profit before rent, unlabelled. A four-wall figure that leaves out rent without saying so, or a rent-free site used as the model.
No head office. Showing profitable sites without the central costs that the sites must cover.
Peak-month run rate. Annualizing December or an opening month.
Several profit figures. Different profit numbers for the same period on different pages, with no bridge.
Mixed averages. Averaging new and mature locations into one per-location figure.
Diagnostic checklist
Every column says actual (with period), mature or planned.
Headline figures name the location they come from.
Opening cost includes pre-opening spending and says who paid.
Site profit is shown after rent, or rent is on the next line.
A rent-free or owned site has a market-rent version.
Ramp is shown from your own openings.
Head office is a separate line, with the number of sites needed to cover it.
One profit definition is used across the deck, or a bridge reconciles them.
Frequently asked questions
Should I quote four-wall EBITDA or EBITDAR?
Either can be fine if it is named and the other line is close by. Our recommendation: if your locations pay rent, show profit after rent, because that is what a new site will have to cover. Show EBITDAR as well if your competitors report it, so the comparison is like for like.
My first location is in a building we own. How do I show its economics?
Show its actual results, then a second version with an estimated market rent, and say how you estimated it. Onda's page 17 footnote is a good start, but it leaves the reader to work out what rent would do to the figure.
How do I show ramp with only one or two locations open?
Show month-by-month sales from each opening date, as Impossible Kicks does for seven stores. With one location, show its monthly sales since opening and say plainly that one opening is a small sample.
Where does pre-opening spending go?
Public companies such as CAVA report restaurant-level profit excluding pre-opening costs. Our recommendation: keep it out of site profit, but include it in the opening cost, so payback reflects everything spent before the first sale. (CAVA Group, Inc. (SEC EDGAR))
How we chose these examples
Search (2026-10-03): the durable corpus index was searched for site-level, four-wall, store-level, per-location, build-out, investment per key/store/location and payback-per-location language. Decks from publicly listed companies, SPAC decks and decks marked confidential were set aside (DynaMaxx Clinics SPV I, Giggles, Burlington, Fiesta, Darden, Sonder, Muncher). Onda, Impossible Kicks and WeArena teardowns are live; no deletion or takedown request names these companies.
Six pages were rendered from the original public deck files and read from the images: Onda 7, 12 and 17; Impossible Kicks 2 and 18; WeArena 13. All six are new uploads. Other Onda pages appear in other guides for different tasks.
Definitions of restaurant-level profit, pre-opening costs, average unit volume and new-restaurant ramp are from CAVA Group's FY2024 Form 10-K; we read the definitions and the relevant risk-factor passage, not the whole filing. Company figures are not verified. The worked example is invented and labelled.
Classifications and recommendations are our editorial reading, not accounting advice. Drafted with AI assistance and checked by an editorial model against the slide images and sources; not reviewed by a person.