How to present a franchise model on a pitch deck: fees, royalties, franchisee profit and who keeps what.
How to Present a Franchise Model on a Pitch Deck
Seven slides from real pitch decks show how founders explain a franchise model: what the franchisee pays, what the brand keeps, what the franchisee earns, and when a company decides not to franchise at all.
TL;DR
A franchise slide should show the money on both sides: what each franchisee pays you (upfront fee, royalty as a share of revenue, other fees) and what a franchisee can expect to earn after paying you. Onda does the first well, splitting hotel revenue between owner (about 30%), manager (5% of revenue plus 15% of profits) and brand (10% of revenue). Hawkes Ocean Sports says it takes 30% of each franchisee's ticket revenue plus fees for marketing, training and fleet use. Fancy Art works through one real order: on a $311.24 sale the franchisee pays $103.75 to the central workshop and keeps $207.49 before wages and rent. Samosa Kings shows quarterly figures that add up but merge franchise income with its own stores. Mint House explains why it chose management agreements instead of franchising. OfficeSitters and Urjakart say they will franchise but give no numbers.
Franchise slides from real pitch decks
Each example shows the exact stored slide above its analysis and links to the full teardown. Stage and year are given only where the deck states them. Figures are the company's own claims; where we checked arithmetic, we say so.
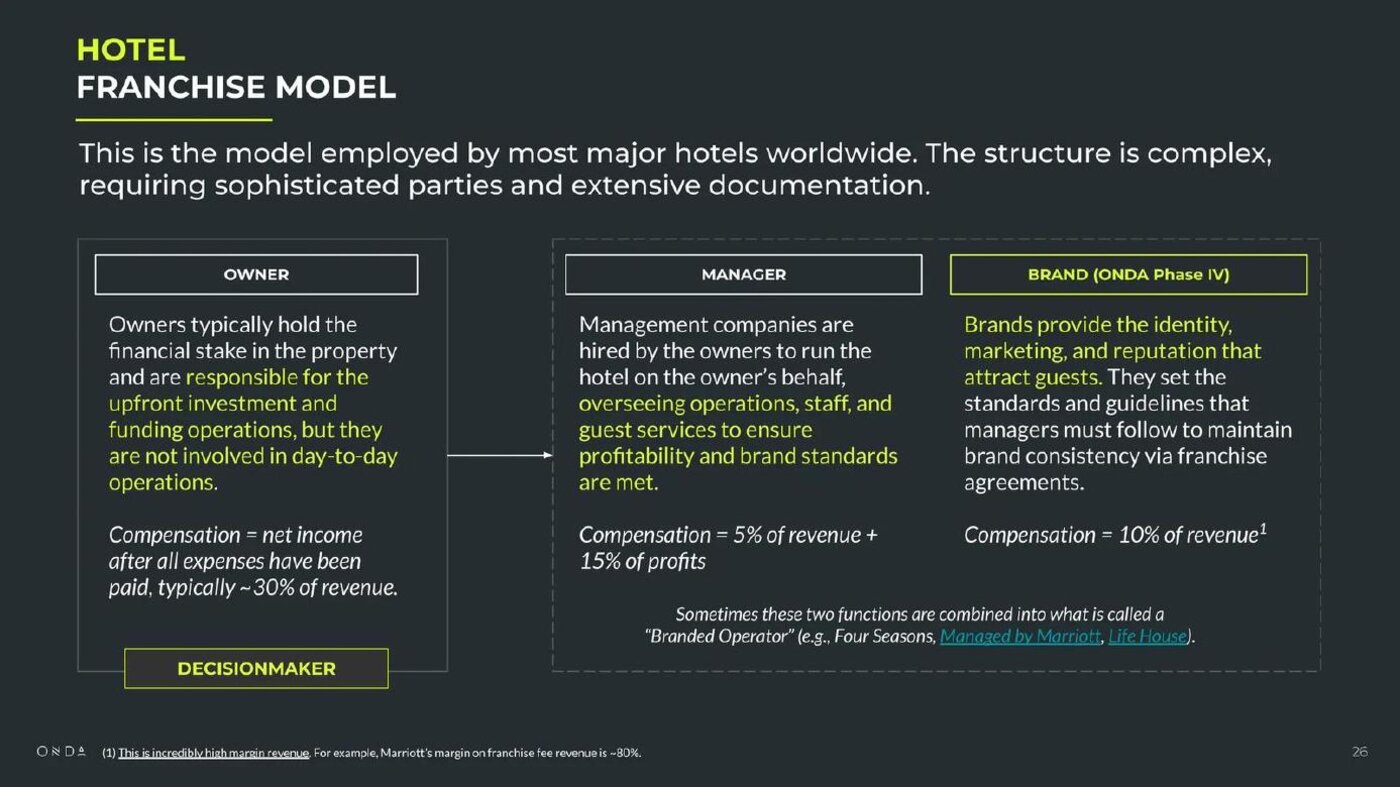
Onda business model slide — slide 26
Boutique hotels with co-working for remote workers ("digital nomad clubhouses"), starting in Costa Rica.
Onda deck, slide 26. Exact stored slide matched to this analysis.
Our analysis: The clearest fee structure in the set: every party, what it does and how it is paid, as a share of revenue or profit.
Evidence and limitation: The Marriott margin and the 30% owner figure have no source on the slide. Add a citation for industry figures.
What a founder can adapt: Show each party in your system and exactly how each one is paid.
Supporting analysis
What the deck claims: Hotel franchise model: owner keeps net income, "typically ~30% of revenue"; manager paid "5% of revenue + 15% of profits"; brand paid "10% of revenue". Onda places itself as the brand in a later phase ("BRAND (ONDA Phase IV)"). Footnote: brand fees are "incredibly high margin revenue"; Marriott's margin on franchise fee revenue "is ~80%".
Presentation choice: The clearest fee structure in the set: every party, what it does and how it is paid, as a share of revenue or profit.
When it does not fit: The Marriott margin and the 30% owner figure have no source on the slide. Add a citation for industry figures.
Picture-framing business with a central production hub serving franchise stores. The order sheet on the slide is dated 9 October 2017.
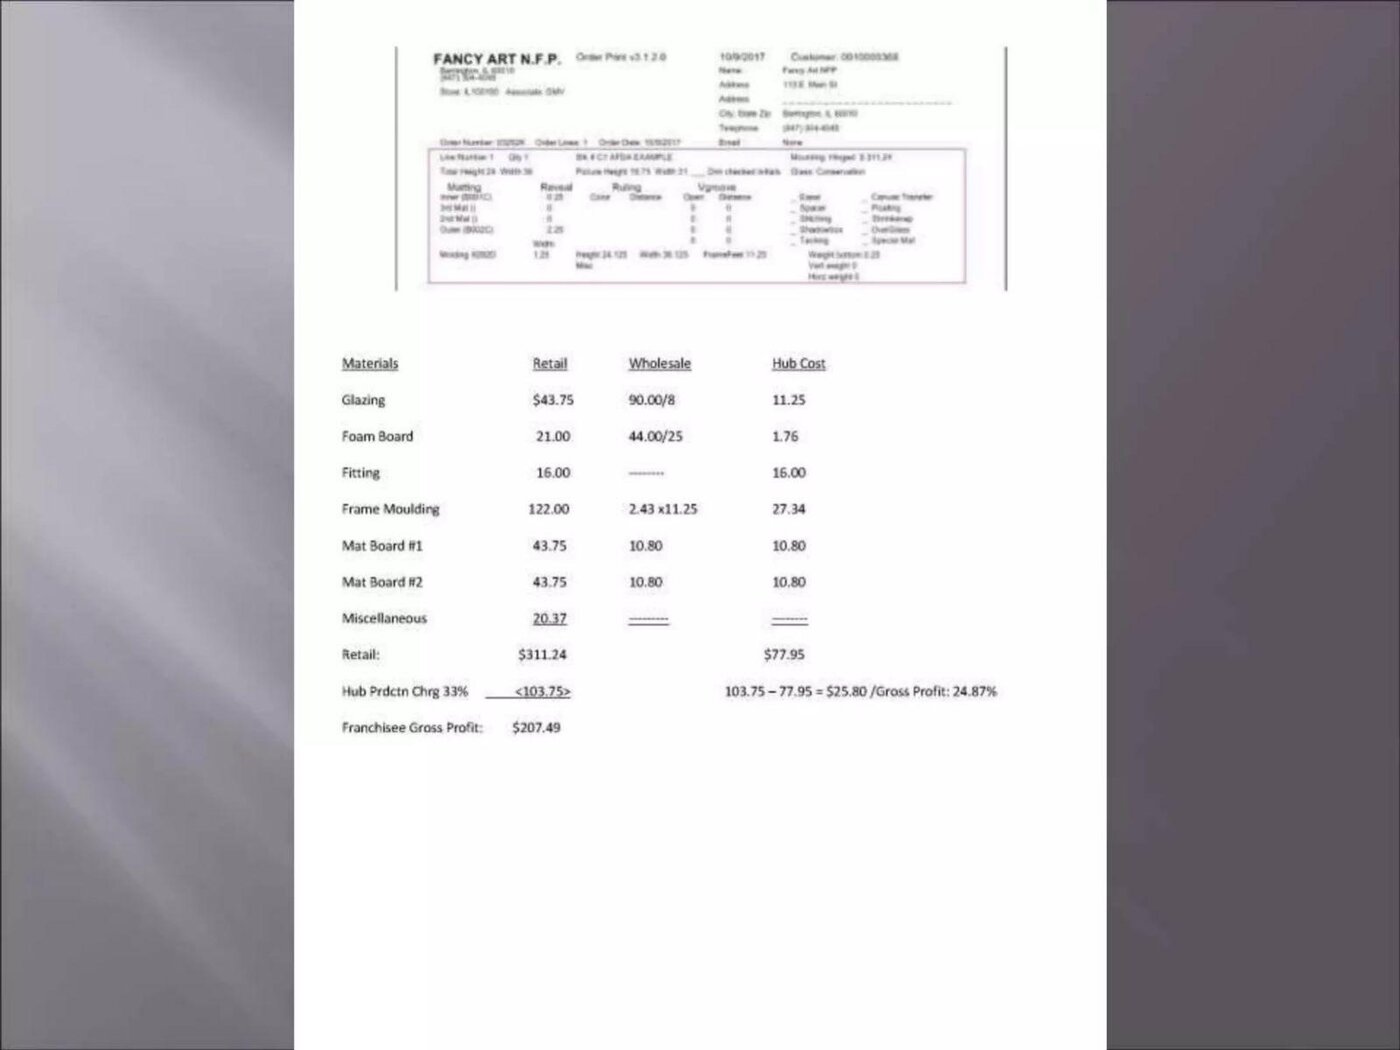
Fancy Art deck, slide 15. Exact stored slide matched to this analysis.
Our analysis: It follows one transaction from the customer's payment to what the franchisee and the hub each keep. We checked the arithmetic: both subtractions and the 24.87% are correct.
Evidence and limitation: $103.75 is 33.3% of $311.24, not 33%. "Franchisee gross profit" leaves out staff, rent and any royalty; name those costs or show them.
What a founder can adapt: Walk through one real sale and show each party's share.
Supporting analysis
What the deck claims: One real order: retail $311.24; "Hub Prdctn Chrg 33%" $103.75; "Franchisee Gross Profit: $207.49". Hub materials cost $77.95, so "103.75 – 77.95 = $25.80 /Gross Profit: 24.87%".
Presentation choice: It follows one transaction from the customer's payment to what the franchisee and the hub each keep. We checked the arithmetic: both subtractions and the 24.87% are correct.
When it does not fit: $103.75 is 33.3% of $311.24, not 33%. "Franchisee gross profit" leaves out staff, rent and any royalty; name those costs or show them.
Hawkes Ocean Sports business model slide — slide 6
Ocean experience centres and pilot training built around small personal submarines, plus private submarine sales.
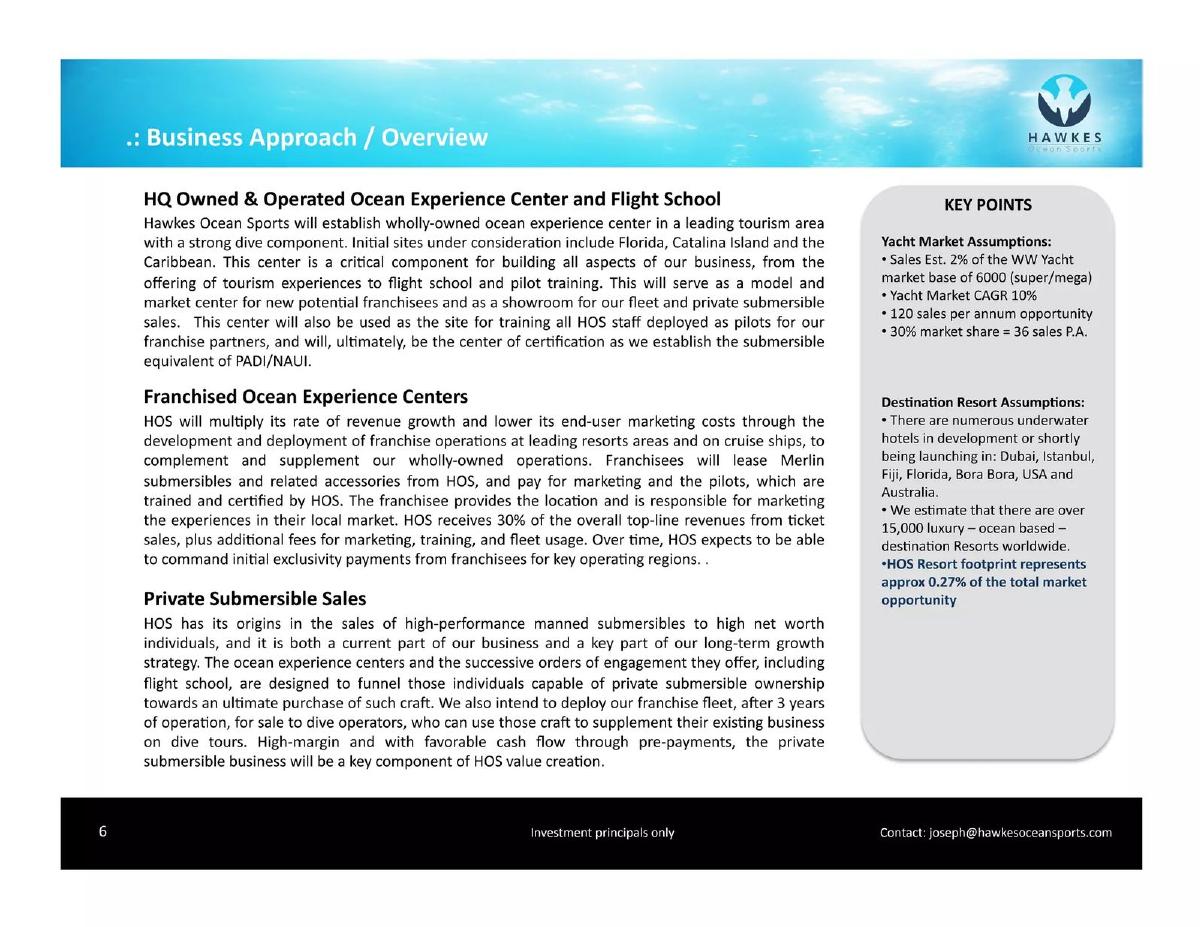
Hawkes Ocean Sports deck, slide 6. Exact stored slide matched to this analysis.
Our analysis: It states the main fee as a share of franchisee revenue and names every other fee type. The yacht figures are consistent: 2% of 6,000 is 120, and 30% of 120 is 36.
Evidence and limitation: Only the 30% has a number. A franchisee paying 30% of revenue plus other fees needs to see what is left; add a sample location.
What a founder can adapt: Name every fee a franchisee pays, with an amount for each.
Supporting analysis
What the deck claims: Franchisees lease submarines from Hawkes and pay for marketing and Hawkes-trained pilots; Hawkes "receives 30% of the overall top-line revenues from ticket sales, plus additional fees for marketing, training, and fleet usage", and expects later to charge "initial exclusivity payments" for key regions. Key points box: sales estimated at 2% of a worldwide base of 6,000 large yachts (120 a year), with a 30% share giving 36 sales a year.
Presentation choice: It states the main fee as a share of franchisee revenue and names every other fee type. The yacht figures are consistent: 2% of 6,000 is 120, and 30% of 120 is 36.
When it does not fit: Only the 30% has a number. A franchisee paying 30% of revenue plus other fees needs to see what is left; add a sample location.
Indian samosa chain starting in Hyderabad, growing through its own stores and franchise outlets. Deck dated March 2020.
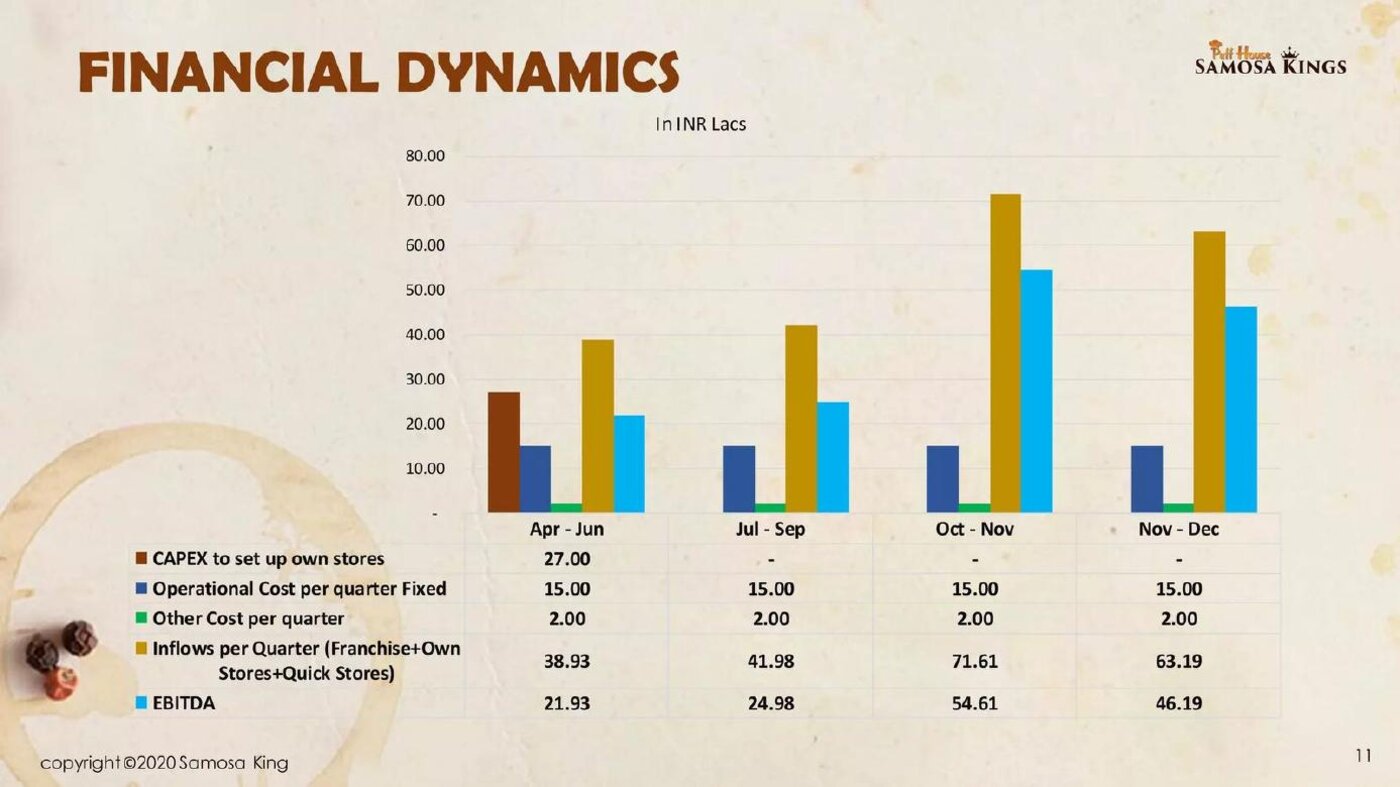
Samosa Kings deck, slide 11. Exact stored slide matched to this analysis.
Our analysis: The chart adds up: we checked that inflows minus 17.00 equals the stated EBITDA in every quarter.
Evidence and limitation: Franchise and own-store income are merged, so the franchise model can't be judged. The quarter labels overlap ("Oct - Nov", "Nov - Dec").
What a founder can adapt: Give franchise income its own line, with the number of outlets and the fee per outlet.
Supporting analysis
What the deck claims: Four quarters in INR lacs: capital cost to set up own stores 27.00 (first quarter only); fixed operating cost 15.00 and other cost 2.00 each quarter; "Inflows per Quarter (Franchise+Own Stores+Quick Stores)" 38.93, 41.98, 71.61, 63.19; EBITDA 21.93, 24.98, 54.61, 46.19.
Presentation choice: The chart adds up: we checked that inflows minus 17.00 equals the stated EBITDA in every quarter.
When it does not fit: Franchise and own-store income are merged, so the franchise model can't be judged. The quarter labels overlap ("Oct - Nov", "Nov - Dec").
Apartment-style hotels with hotel services, run under management agreements. Deck dated September 2023.
Mint House deck, slide 3. Exact stored slide matched to this analysis.
Our analysis: A contrast example: it explains why it chose not to franchise, and turns competitors' franchise model into a weakness.
Evidence and limitation: The 2x claim and the 80% margin have no source or time period on the slide.
What a founder can adapt: If you chose a different model from your industry's franchise standard, say why in one line.
Supporting analysis
What the deck claims: "Branded hotel chains are franchise models, can't force the hotel franchisees to change"; "Management agreements = take-rate model", "80%+ Gross Margin, asset-light, minimally capital intensive"; "2x Revenue / NOI increase when Mint House operates property".
Presentation choice: A contrast example: it explains why it chose not to franchise, and turns competitors' franchise model into a weakness.
When it does not fit: The 2x claim and the 80% margin have no source or time period on the slide.
Co-working space combined with on-site childcare. Deck marked 2018.
OfficeSitters deck, slide 10. Exact stored slide matched to this analysis.
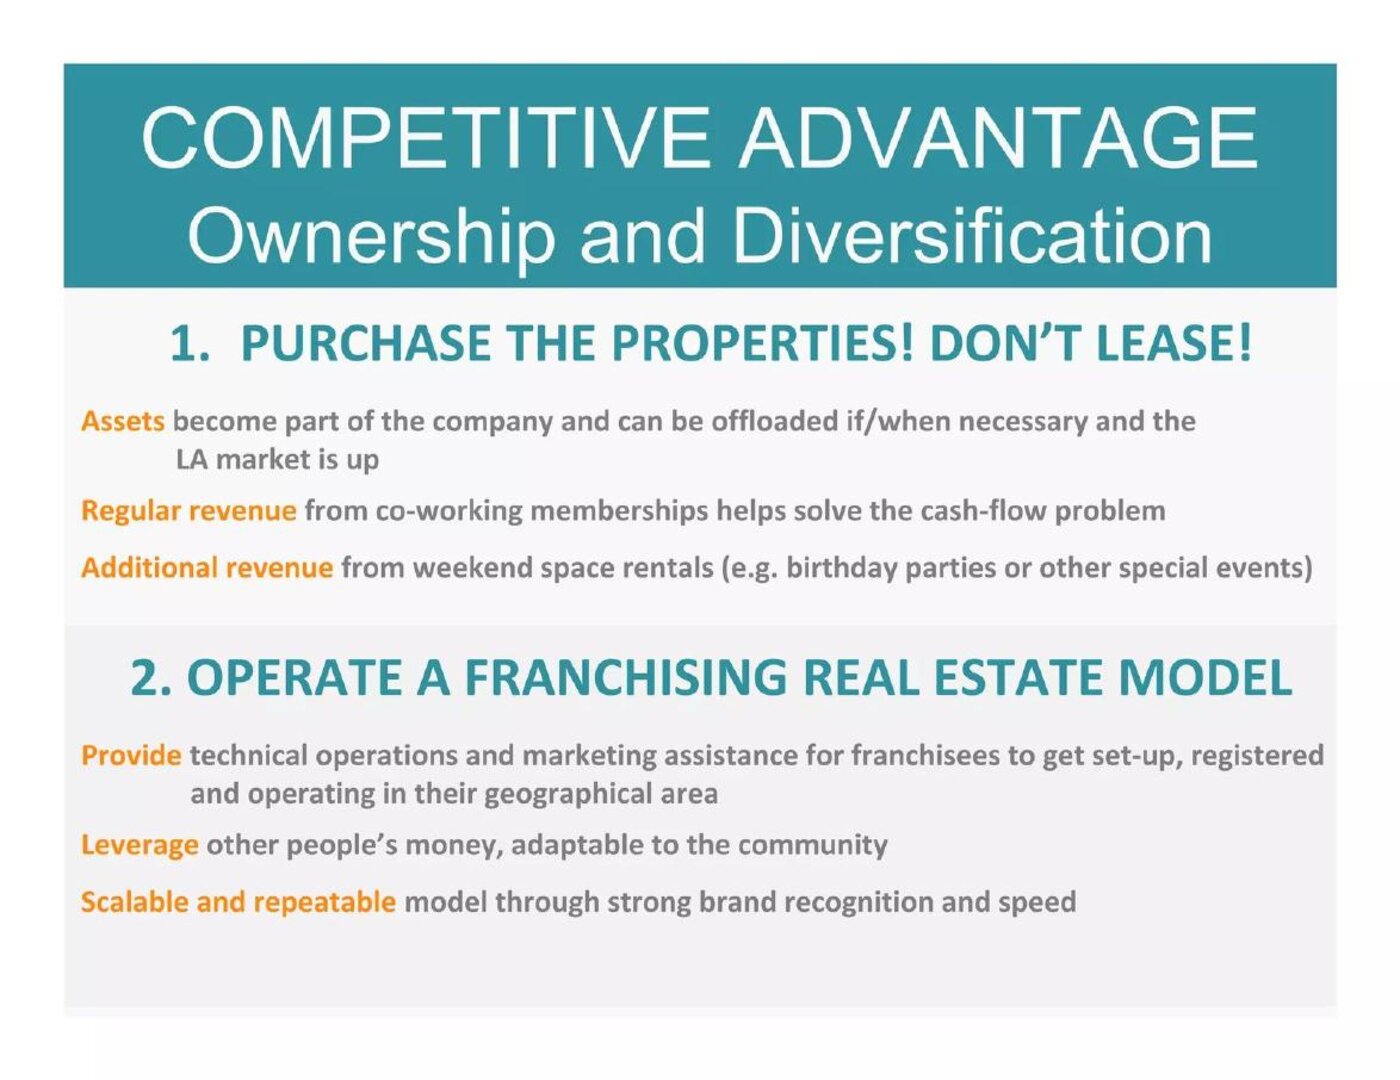
Our analysis: A weak example to learn from: franchising is named as an advantage with no fees, royalties or franchisee earnings.
Evidence and limitation: "Other people's money" describes your benefit, not the franchisee's. Show why a franchisee would join.
What a founder can adapt: If franchising is the growth plan, add the fee, the royalty and a target number of locations.
Supporting analysis
What the deck claims: "Operate a franchising real estate model": provide technical, operations and marketing help to franchisees; "Leverage other people's money"; "Scalable and repeatable model through strong brand recognition and speed".
Presentation choice: A weak example to learn from: franchising is named as an advantage with no fees, royalties or franchisee earnings.
When it does not fit: "Other people's money" describes your benefit, not the franchisee's. Show why a franchisee would join.
Urjakart deck, slide 11. Exact stored slide matched to this analysis.
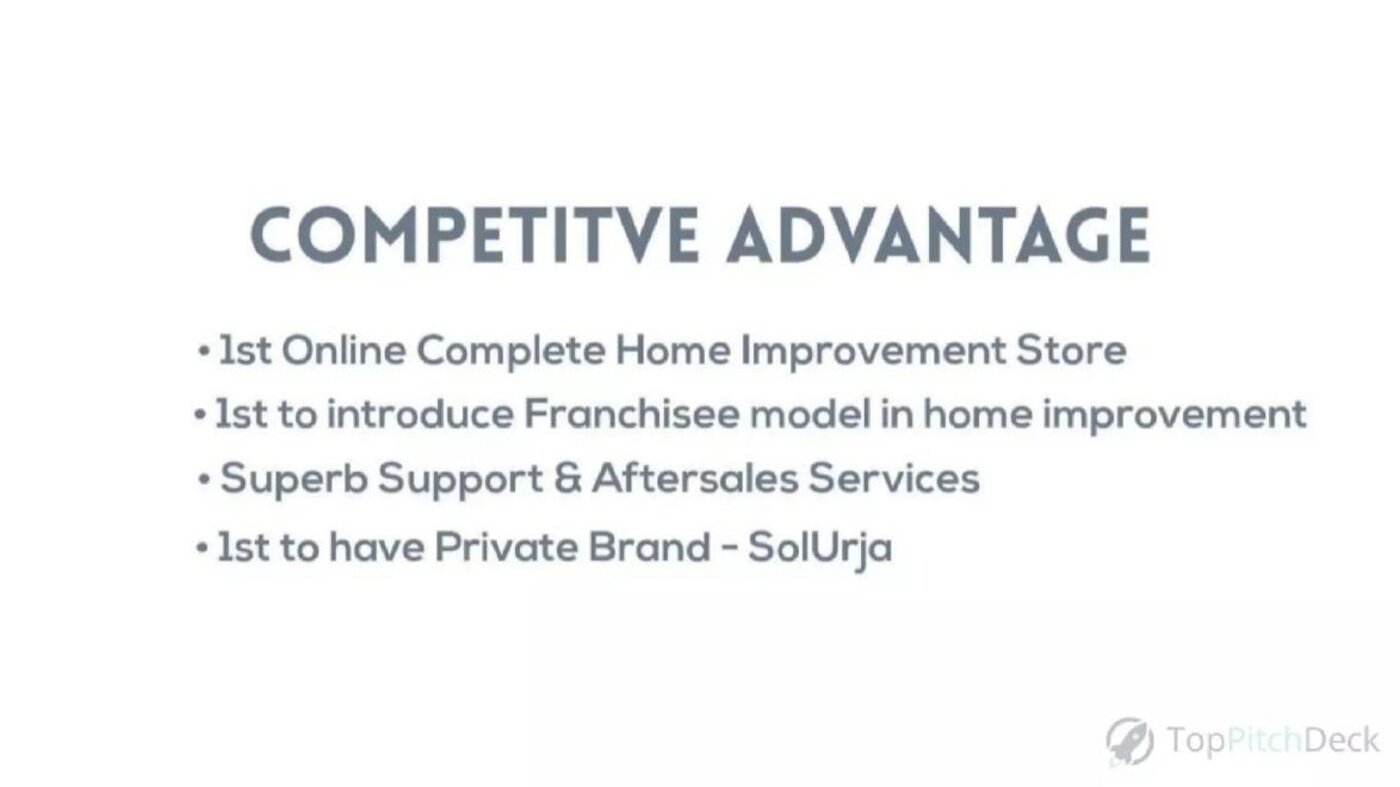
Our analysis: A weak example to learn from: a franchise model claimed as an advantage with no detail on what franchisees do or pay.
Evidence and limitation: "First" claims can't be checked from the slide and don't show the model works.
What a founder can adapt: Replace "first to franchise" with how many franchisees you have and what each earns you.
Supporting analysis
What the deck claims: Competitive advantages: "1st Online Complete Home Improvement Store"; "1st to introduce Franchisee model in home improvement"; "Superb Support & Aftersales Services"; "1st to have Private Brand - SolUrja".
Presentation choice: A weak example to learn from: a franchise model claimed as an advantage with no detail on what franchisees do or pay.
When it does not fit: "First" claims can't be checked from the slide and don't show the model works.
The strongest slides show fees, franchisee earnings and franchise income as separate numbers.
Example
Fees to the company
Franchisee earnings
Franchise income separate
Arithmetic checked
Onda
Yes (10% of revenue)
Owner ~30% of revenue
Not applicable (structure only)
No figures to add up
Fancy Art
Hub charge $103.75
Yes ($207.49 gross)
Yes (one order)
Correct; 33% label is 33.3%
Hawkes Ocean Sports
30% of revenue plus unpriced fees
No
No
Yacht figures correct
Samosa Kings
No
No
No (merged)
EBITDA correct
Mint House
Not franchising
Not applicable
Not applicable
Not checkable
OfficeSitters
No
No
No
No figures
Urjakart
No
No
No
No figures
Key Takeaways
Show what the franchisee pays you: upfront fee, royalty percentage and any other fees.
Show what the franchisee keeps, because nobody signs up to a franchise that doesn't pay them.
Separate franchise income from income from stores you own.
Label percentages correctly and make sure the arithmetic matches the label.
If you chose not to franchise, say why in one line; it shows you considered it.
Test your franchise slide before you send it
Answer these with numbers, even if they are targets.
Upfront. What does a franchisee pay to join?
Ongoing. What royalty and other fees do they pay, and as a share of what?
Franchisee. What does a typical location keep after your fees and its own costs?
Scale. How many franchises do you have or plan, and by when?
Mix. How much of your revenue comes from franchise fees versus your own locations?
Copyable framework: Franchisee pays [fee] upfront + [x]% of revenue; typical location revenue [amount], franchisee keeps [amount] after all costs
Illustrative example 1 — written by us
Before: Operate a franchising real estate model.
After: Franchise model: [fee] to join + [x]% of revenue; a typical site earns [amount] and keeps [amount]; [number] franchises planned by [year]
What improved: Our illustrative rewrite, not OfficeSitters' text. Bracketed parts are placeholders, not company facts. It turns a claim into a model an investor can test.
What this guide covers
A franchise model lets other people open and run locations under your brand. They pay for the location and the staff; you provide the brand, the system and support, and you take fees. It is a common growth plan for food, hospitality, retail and service businesses because it lets a small company grow without paying for every location itself.
Investors want to know two things about a franchise model. First, how much the company earns from each franchise location, and how reliable that income is. Second, whether franchisees will actually make enough money to want to join and stay. A slide that answers only the first question looks like it was written for the company, not for the people who have to buy in. This guide looks at slides that answer one or both questions, and at a few that answer neither.
Our business model guides cover marketplaces, subscriptions, advertising and hardware. None of them covers franchise economics, so this is a separate guide. We found franchise slides in about a dozen startup decks in our corpus; seven were readable and from companies that were private when they made the deck.
The money a franchisee pays you
Most franchise systems charge some combination of an upfront franchise fee, an ongoing royalty (usually a percentage of the franchisee's revenue), a marketing or brand fund contribution, and sometimes fees for training, software or supplies. Your slide should list each one with its number.
Onda, a hotel company for remote workers, lays this out clearly for the hotel industry. Its slide splits the three roles in a branded hotel: the owner, who puts up the money and keeps net income ("typically ~30% of revenue"); the manager, paid "5% of revenue + 15% of profits"; and the brand, paid "10% of revenue". Onda says it is the brand in this structure. A footnote adds that brand fees are "incredibly high margin revenue" and that Marriott's margin on franchise fee revenue is about 80%. The slide gives no source for the Marriott figure, so treat it as Onda's claim.
Hawkes Ocean Sports, which plans ocean experience centres built around small submarines, describes its fees in a paragraph rather than a table. Franchisees lease the submarines from Hawkes, pay for marketing and for pilots trained by Hawkes, and Hawkes "receives 30% of the overall top-line revenues from ticket sales, plus additional fees for marketing, training, and fleet usage." It adds that over time it expects to charge "initial exclusivity payments" for key regions. That is a clear description of the main fee, but the extra fees have no amounts, and 30% of revenue is a lot for a franchisee to pay before its own costs. A stronger slide would show a sample location's revenue, Hawkes's share, and what the franchisee keeps.
The money a franchisee keeps
Franchisees are customers of your franchise system. If the numbers don't work for them, you won't sign enough of them, and the ones you sign will struggle. Investors know this, so a slide that shows franchisee profit answers their next question before they ask it.
Fancy Art, a picture-framing business, does this with a real order. Its slide shows an order sheet dated 9 October 2017 and then breaks the $311.24 retail price into materials: glazing, foam board, fitting, frame moulding, two mat boards and miscellaneous items. The central workshop (the "hub") charges the franchisee $103.75 to make the frame, labelled "Hub Prdctn Chrg 33%", and the slide shows "Franchisee Gross Profit: $207.49". We checked the arithmetic: $311.24 minus $103.75 is $207.49. The hub's own materials cost $77.95, so it makes $25.80 on the order, which the slide gives as a 24.87% gross profit; $25.80 divided by $103.75 is 24.87%, so that matches too.
Two things a careful reader will notice. First, $103.75 is 33.3% of $311.24, not 33%; 33% would be $102.71. The difference is small, but a percentage label that doesn't match its number makes an investor check every other figure. Second, "franchisee gross profit" here is what is left after the cost of making the frame only. It doesn't take out the franchisee's staff, rent, or any royalty paid to Fancy Art. A franchisee comparing this with other opportunities would need those costs too.
The useful lesson is the method: one real transaction, followed from the customer's payment to each party's share. That is easier to trust than a projected average, as long as the labels are accurate and the costs left out are named.
Keep franchise income separate from your own stores
Many companies that franchise also run some locations themselves. Income from your own stores is full revenue with full costs. Income from franchises is a smaller fee with very few costs. Mixing the two hides how the business really works.
Samosa Kings, an Indian snack chain, shows a chart of quarterly figures in INR lacs (one lac is 100,000 rupees). In each quarter it shows a fixed operating cost of 15.00, other costs of 2.00, and "Inflows per Quarter (Franchise+Own Stores+Quick Stores)", then EBITDA. We checked each quarter: inflows minus 17.00 gives the stated EBITDA every time (38.93 to 21.93, 41.98 to 24.98, 71.61 to 54.61, and 63.19 to 46.19). A 27.00 capital cost to set up its own stores appears in the first quarter and is correctly left out of EBITDA.
The weakness is in the inflows line. Because franchise, own-store and quick-store income are combined, an investor can't tell how much comes from franchise fees, how many franchises it assumes, or what each one pays. The quarter labels also overlap ("Oct - Nov" and then "Nov - Dec"), which looks like a typing error but makes the chart harder to trust. A stronger version would give franchise income its own line, with the number of franchise outlets and the average fee per outlet.
Saying why you chose not to franchise
Some of the most useful franchise slides are from companies that decided against it. Mint House, which runs apartment-style hotels, lists its advantages on a slide titled "A better business model". One of them is a barrier for incumbents: "Branded hotel chains are franchise models, can't force the hotel franchisees to change." Another explains its own choice: "Management agreements = take-rate model" with "80%+ Gross Margin, asset-light, minimally capital intensive". It also claims a "2x Revenue / NOI increase when Mint House operates property".
Here the franchise model appears as a weakness of competitors: because big hotel brands depend on franchisees, they can't quickly redesign rooms or technology. Mint House runs properties under management agreements instead, so it keeps control. Whether that argument holds is for an investor to judge, and the 2x claim has no source on the slide, but the reasoning is visible. If your market is full of franchise systems and you chose a different route, one line like this answers the obvious question.
Onda's slide does something similar from the other side. It explains the standard hotel franchise structure, then says Onda plans to be the brand in it ("BRAND (ONDA Phase IV)"). Investors can see that franchising is a later phase, not the starting plan.
When the slide only says "franchise"
Two decks in our set mention franchising without any numbers. OfficeSitters, which combines co-working space with childcare, has a slide titled "Competitive Advantage: Ownership and Diversification". Its second point is "Operate a franchising real estate model": provide technical, operations and marketing help to franchisees, "leverage other people's money", and grow through "strong brand recognition and speed". There is no fee, no royalty, no count of planned franchises, and no sign of what a franchisee would earn.
Urjakart, an online home improvement store in India, lists "1st to introduce Franchisee model in home improvement" among four competitive advantages. The slide doesn't say what the franchisees do, what they pay, or how many there are. Being first is a claim an investor can't check from the slide, and it doesn't explain why the model works.
Both slides show that "we will franchise" is a plan, not a business model. If franchising is how you plan to grow, give it a slide with the numbers, even if they are targets. If it is only a later option, a single line on the roadmap is enough.
What a complete franchise slide includes
Putting the examples together, a complete franchise slide answers five questions. What does a franchisee pay upfront? What do they pay on an ongoing basis, and as a share of what? What does a typical location earn, and what does the franchisee keep after your fees and their own costs? How many franchises do you have or plan, and over what period? And how much of your projected revenue comes from franchise fees rather than your own locations?
None of the seven slides answers all five. Onda comes closest on the fee structure, Fancy Art on franchisee earnings, and Samosa Kings shows how a financial chart can mix the two kinds of income. You don't need all five on one slide; a fee table on the business model slide and a franchisee profit example in the appendix work well together. But each answer should be somewhere in the deck.
Finally, keep the language accurate. A royalty is a share of the franchisee's revenue; a fee is a fixed amount. Gross profit before staff and rent is not profit. A percentage label should match its number. Investors who know franchising will check these first.
Common mistakes
Fees with no amounts. Give a number for every fee you charge.
No franchisee earnings. Show what a location keeps after your fees.
Merged income. Separate franchise fees from your own stores.
Labels that don't match. Check every percentage against its number.
"Gross profit" that skips costs. Name the costs left out, such as staff and rent.
Diagnostic checklist
Upfront fee and ongoing royalty both stated.
A franchisee profit example, with the costs it leaves out named.
Franchise income shown separately from your own locations.
Number of franchises, current and planned.
Every percentage matches its number.
Frequently asked questions
How we chose these examples
Corpus: published pitch deck teardowns on StartupFundraising.com. Founder-uploaded private decks are excluded.
Selection (2026-10-01): we searched extracted slide text for franchise fees, franchisees, royalties and franchise outlets, then read each candidate from images made from the original deck files.
Eligibility: each company was private when its deck was made. We confirmed this from public funding announcements for Mint House (Series B, May 2022), Onda (private equity funding, November 2021) and Urjakart (seed from 500 Startups, October 2015); Hawkes Ocean Sports, Fancy Art, OfficeSitters and Samosa Kings showed no sign of a listing in their decks or in our searches.
Not used: Blink Charging (ev-charging deck) slide 26 (the company was already listed on Nasdaq when the deck was made), Giggles N' Hugs, Fiesta Restaurant Group and Darden (listed companies), Escape Artist Real Estate slide 5 (about a shared franchisee website, not franchise economics), and Brewtopia (its original deck file could not be retrieved, so its fee table couldn't be checked).
Overlap check: no other guide covers franchise models. The marketplace, subscription, advertising and hardware business model guides cover other revenue models.
Review: all seven slide images were inspected on 2026-10-01 and matched to company, deck and slide number, and the arithmetic on the Fancy Art, Hawkes Ocean Sports and Samosa Kings slides was recomputed (AI editorial model review). No person has yet completed an editorial review of this page.
Figures are the companies' own claims; we checked arithmetic, not underlying data. We make no claim that any slide caused a fundraising outcome.