Fancy Art, operating under the branding 'Fancy Art, *NFP' (Not Fancy Prices), is a retail art and custom framing business seeking $750,000 to scale its franchise model. The deck positions the company as a disruptor in an 'antiquated' industry by removing middlemen and utilizing a 'patented racking system' to display thousands of frame samples. While the presentation provides granular unit economics—showing a 24.87% gross profit for a production hub and a $207.49 profit for franchisees on a $311.24 sale—it lacks a formal team slide or a clear timeline for national expansion. The ask is heavily…
Key takeaways
- The company identifies a market gap in the multi-billion dollar framed art industry, which it claims is not yet mature or fully developed (Slide 1).
- Fancy Art utilizes a proprietary handheld point-of-sale device and an Order Management System to streamline the customer design process (Slide 4).
- A direct price comparison shows Fancy Art at $146.85 for a specific framing job, compared to $273.00 and $264.70 at two unnamed competitors (Slide 5).
- The business model includes multiple profit centers beyond framing, such as art restoration, appraisals, and digital printing (Slide 6).
- Unit economics for a sample $311.24 retail order show a franchisee gross profit of $207.49 after a 33% hub production charge (Slide 8).
- The company is seeking a total of $750,000 in funding, with the largest portion ($500,000) allocated to working capital for property and equipment (Slide 9).
- The deck mentions a parent corporation history dating back to 1992, though it lacks a specific slide detailing the current leadership team (Slide 9).
Fancy Art Pitch Deck Analysis
The Fancy Art investor presentation is a transition deck, moving a proven local retail concept into a scalable franchise model. The branding, centered on the acronym 'NFP' for 'Not Fancy Prices,' signals a value-based disruption of the high-end art gallery market. The deck relies heavily on physical evidence—photos of showrooms, proprietary hardware, and comparative receipts—to build a case for investment.
Slide 1: The Problem and Market Opportunity
The presentation opens by defining the framed art industry as a 'multi-billion dollar industry' that remains 'not mature and fully developed.' The core problem identified is a perception issue: consumers find custom framing difficult and expensive. The slide attributes high costs to an 'antiquated distribution system' involving multiple layers of middlemen. By stating that most people have never done custom framing, the company suggests a massive untapped market of 'image conscious' consumers who are currently priced out.
Slide 2: The Gallery Experience
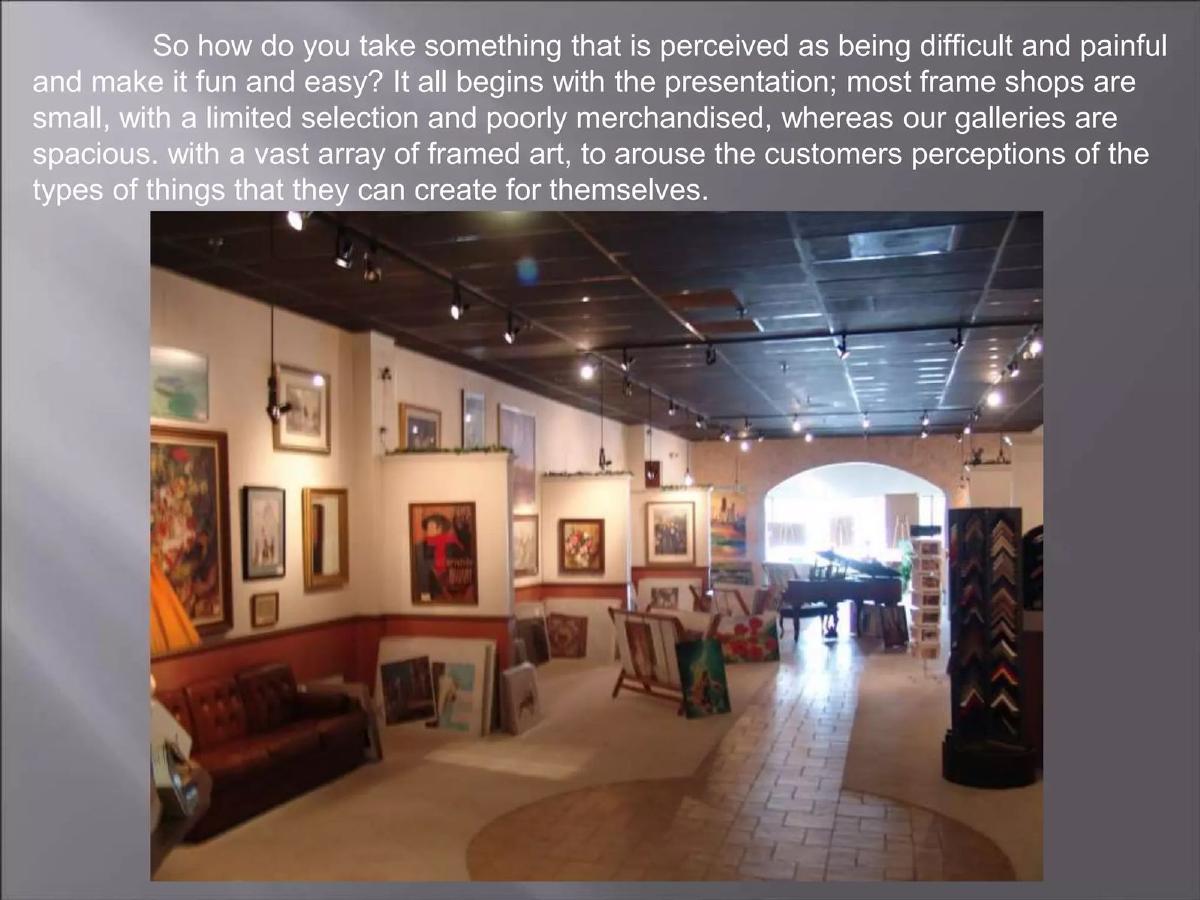
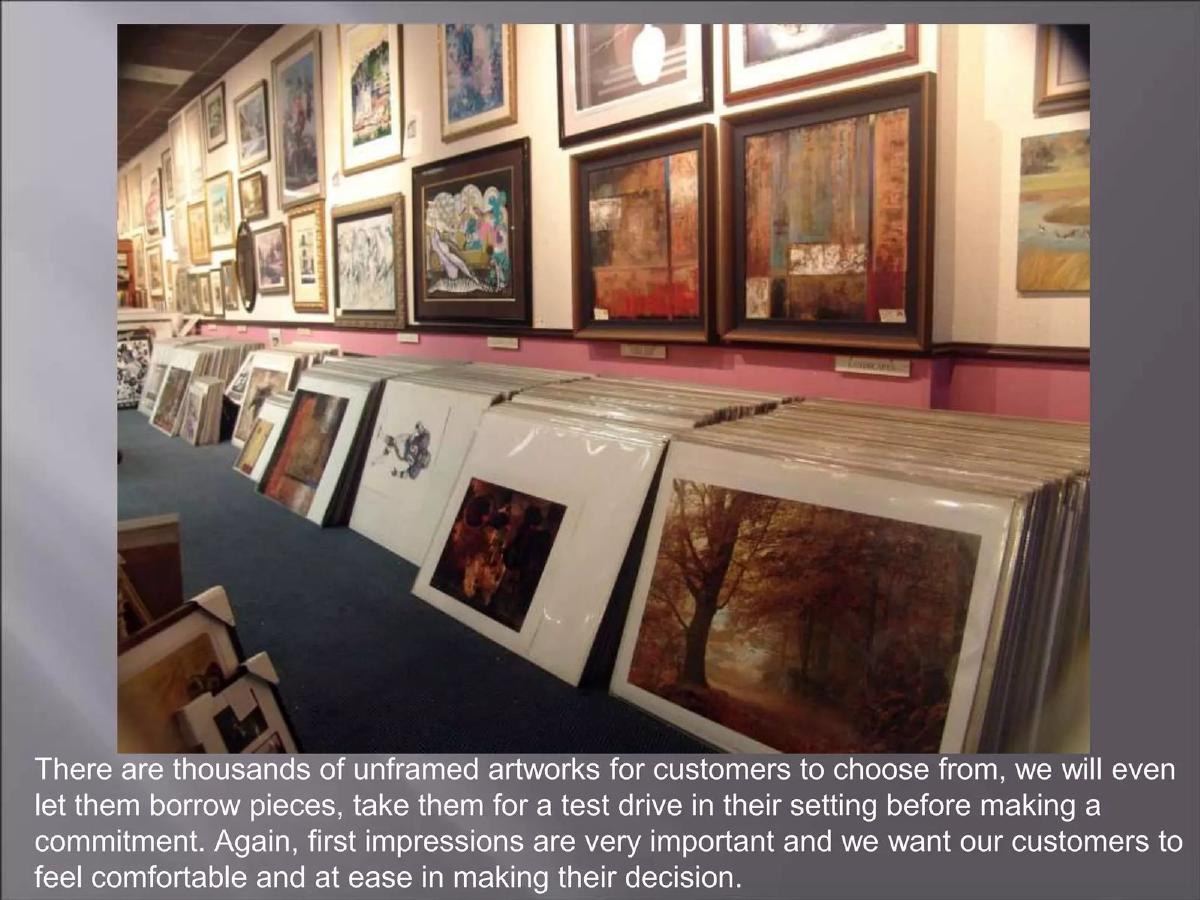
This slide focuses on the physical retail environment. It contrasts 'small, poorly merchandised' frame shops with Fancy Art's 'spacious' galleries. The visual shows a well-lit showroom with a piano and various art pieces, intended to 'arouse the customers' perceptions.' This is a classic 'show, don't tell' approach to retail disruption, emphasizing the customer experience as the first step in the sales funnel.
Slide 3: The Patented Racking System
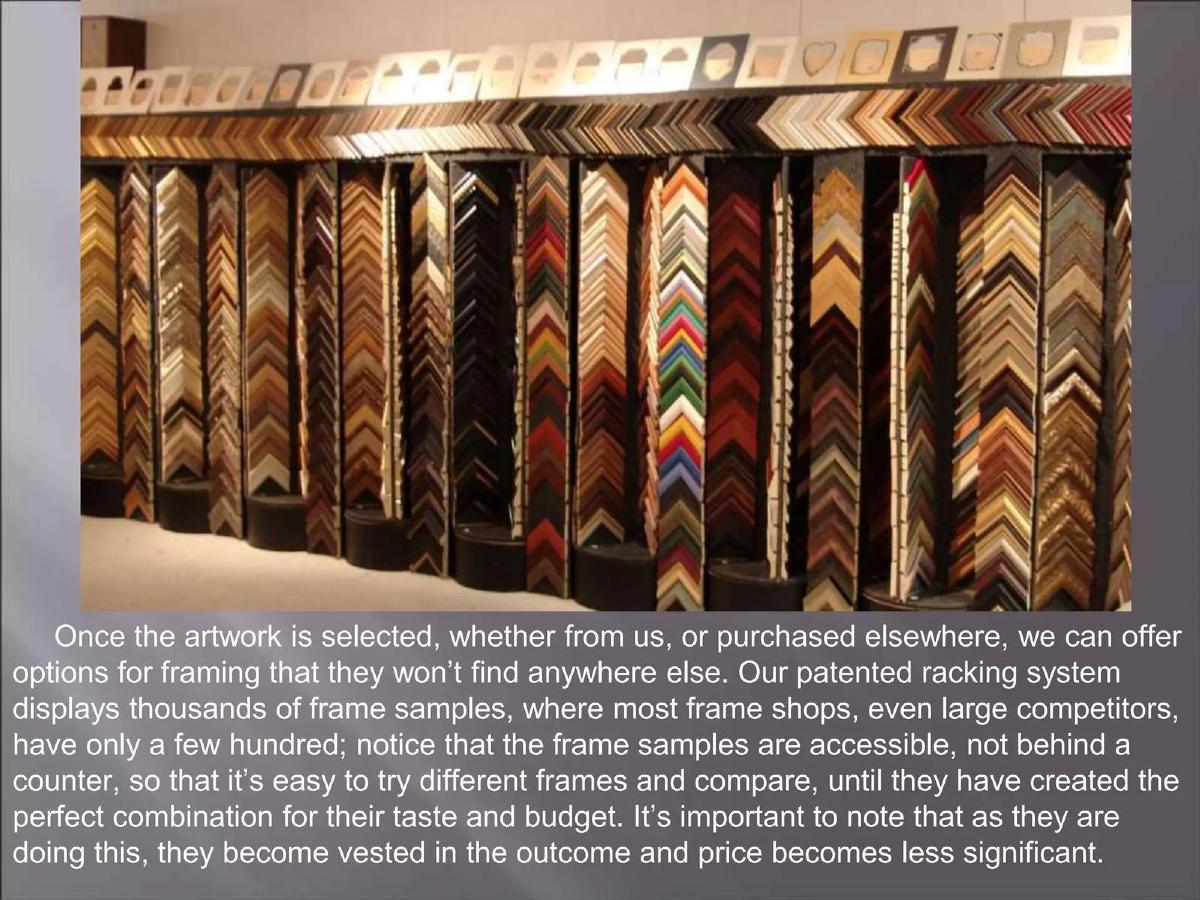
Fancy Art highlights a 'patented racking system' that displays thousands of frame samples. The strategic advantage mentioned here is accessibility; unlike competitors who keep samples behind a counter, Fancy Art allows customers to touch and compare frames freely. The slide makes a psychological claim that as customers engage with the samples, they become 'vested in the outcome and price becomes less significant.'
Slide 4: Proprietary Technology and POS
The deck introduces the 'Fancy Art Order Management System.' The visual features a legacy PC and a handheld device, which the text describes as a 'proprietary handheld point of sale device.' This technology is meant to make the design process 'fun and easy' while creating a digital archive of orders. For an investor, this represents a potential 'moat'—a proprietary tool that standardizes the franchise experience and ensures data retention for customer remarketing.
Slide 5: The Price Comparison (The 'WOW' Slide)
Slide 5 is the most aggressive in the deck. It shows a side-by-side comparison of the same picture framed at three different shops. Fancy Art’s price is $146.85, while 'Store B' is $273.00 and 'Store C' (a large competitor using a 50% off coupon) is $264.70. This slide effectively argues that even with competitors' deep discounting, Fancy Art’s base price is significantly lower, supporting the 'Not Fancy Prices' brand promise.
Slide 6: Revenue Streams and Profit Centers
To demonstrate the breadth of the business, Slide 6 lists eight distinct 'profit centers,' including artwork sales, custom mirrors, art restorations, and digital printing. This suggests that a franchisee is not reliant solely on framing, providing multiple avenues for customer acquisition and upselling.
Slide 7: The Franchise Value Proposition
This slide serves as a recruitment tool for potential franchisees. It lists benefits such as 'high profit margins,' 'low staffing requirements,' and 'exclusive franchise territories.' The tagline 'you’re in business for yourself, but not by yourself' is a standard franchise industry trope, but here it is backed by the promise of 'complete support nearby.'
Slide 8: Detailed Unit Economics
Slide 8 provides a granular look at a single transaction. It breaks down the 'Retail,' 'Wholesale,' and 'Hub Cost' for materials like glazing, foam board, and moulding. The most important figure for an investor is the 'Franchisee Gross Profit' of $207.49 on a $311.24 sale. It also shows a 'Hub Production Charge' of 33%, indicating a secondary revenue stream for the parent company or regional developer who manages the production 'hub.'
Slide 9: Allocation of Funds
The final slide in the set details the $750,000 ask. The largest line item is $500,000 for 'Working Capital,' which covers property acquisition and equipment. Notably, $100,000 is allocated to 'Seeded to Global Market Ventures, Inc.' to satisfy financial threshold requirements in registration states like Illinois. The slide concludes with a sports car metaphor, claiming the concept is 'finely tuned' and only needs 'fuel' (capital) to compete.
What Works in This Deck
Price Transparency: The direct comparison on Slide 5 is a powerful tool for proving market disruption. It removes ambiguity about how they compete. · Granular Economics: Slide 8 provides the kind of 'math' that investors need to see to understand how both the franchisee and the franchisor make money. · Proprietary Elements: By highlighting a 'patented racking system' and a 'proprietary handheld device,' the company moves away from being a simple commodity service and toward a technology-enabled retail platform.
What Is Missing
Team Slide: There is no information on who is running the company. Investors back people as much as ideas, and the absence of founder bios is a significant gap. · Growth Roadmap: While the deck asks for $750,000, it doesn't show a timeline for how many stores will be opened or where the initial expansion will take place. · Market Size Data: Slide 1 mentions a 'multi-billion dollar industry' but lacks specific CAGR (Compound Annual Growth Rate) data or a breakdown of the Total Addressable Market (TAM). · Modern Visuals: The technology shown (Slide 4) appears dated, which may raise questions about the current relevance of the 'proprietary' software in a modern mobile-first retail environment.
Founder Takeaways
Use real-world comparisons. The 'Store B vs. Store C' slide is a masterclass in proving value. If your startup is a low-cost alternative, show the receipts. Break down the unit economics. Don't just say you are profitable; show the cost of goods sold (COGS) and the resulting margins for every stakeholder in your ecosystem. Be specific about the 'Ask.' Fancy Art didn't just ask for a lump sum; they broke it down into PR, legal/registration, and working capital, which builds trust with potential investors. However, never omit the team. Even if you have a 20-year history, investors need to see the current leadership's faces and credentials to feel comfortable with the risk.
Frequently asked questions
- What is the primary problem Fancy Art is solving?
- According to Slide 1, the custom framing industry is hampered by an antiquated distribution system filled with middlemen who inflate prices. Fancy Art aims to simplify the process, which consumers perceive as difficult and expensive, by offering a spacious gallery experience and a 'Not Fancy Prices' (NFP) model that undercuts traditional competitors by nearly 50%.
- How does the company leverage technology in a retail environment?
- Slide 4 details a proprietary handheld point-of-sale device that allows customers to try different frame combinations and 'tweak it to their taste and budget.' This data is transferred to a store computer that manages invoices and archives order particulars, allowing for easy replication of previous orders for returning customers.
- What are the specific unit economics for a franchisee?
- Slide 8 provides a breakdown of a $311.24 retail sale. The material costs (glazing, foam board, moulding, etc.) total $77.95. A 'Hub Production Charge' of 33% ($103.75) is applied, leaving the franchisee with a gross profit of $207.49. The production hub itself earns a gross profit of 24.87% ($25.80) on that specific transaction.
- What is the intended use of the $750,000 investment?
- As shown on Slide 9, the funds are split across several categories: $500,000 for working capital (property, staffing, equipment), $100,000 to meet state financial threshold requirements for franchise registration, $50,000 for public relations, $45,000 for franchise web portals and broker networks, $5,000 for web development, and $50,000 in reserves.
- Does the deck provide information on the management team?
- No. The provided slides omit a dedicated team or 'About Us' slide. While Slide 9 mentions a parent corporation existing since 1992 and Slide 5 lists physical locations in Barrington and Lake Zurich, there are no biographies, names, or professional backgrounds provided for the founders or executive leadership.